Tesla Model 3. Flickr Image.
As an investor myself, the inventory of a company is a crucial part that I am very much interested to know more about. I am interested not only in the inventory itself, but also the relationship between the inventory and revenue growth. What I want to find out is if the expansion of inventory would also drive revenue growth. If the revenue declines but the inventory expands, this is a proportionately inverse relationship and there might be something wrong with the company.
On the other hand, if the inventory declines but the revenue increases, that is something very interesting to find out. Unless the company does not carry its own inventory, under the normal course of operation, the long-term trend will be that the inventory should expand and so does the revenue if the company is growing.
For Tesla, the company inventory makes up as much as 40% of its current asset and generates substantial economic benefit for the company in the future. As a result, I would like to go into as much detailed as possible of the company inventory and its relationship with revenue growth.
Other than the inventory, I also want to look at the breakdown of the inventory and how the components relate to revenue growth. the inventory is broken down to individual components, the most important component to look at would be the “Finished Goods”.
The reason is that the finished goods make up almost half of the amount of inventory in the company balance sheet. In addition, the “Finished Goods” is mostly made up of vehicles in transit that will fulfill customer orders in the short term. Therefore, the “Finished Goods” is an important part of the inventory component that I would like to pay attention to.
To find out more about the inventory components, you can visit this post: Tesla Inventory And Its Components
Chart of Tesla Inventory and Its Percentage to Revenue
Tesla inventory and percentage to revenue
As the above chart shows, the total inventory has been expanding steadily from 1Q15 to 1Q19. There were some dips in some quarters, but the long-term trend shows that the inventory has been expanding.
In terms of percentage of inventory to revenue, the trend that we are seeing in the chart above is that it has been declining. In 2Q15, the inventory has reached the highest point of 140% of revenue. Throughout 2015, inventory was almost always more than the revenue generated.
Moving forward to 2016, 2017 and 2018, the inventory percentage to revenue has slowly decreased to as low as 40% of revenue in 4Q18 and it went up again to 80% in 1Q19. What the trend implies is that for most of the quarters, revenue growth has always been faster than inventory growth. For that reason, the percentage has decreased as a result of faster revenue expansion.
The inventory bounced up significantly to 80% of revenue in 1Q19 and reached an all time high of $3.9 billion. This may or may not be something of a concern but we will need to see what happen in the next quarter.
Chart of Tesla Inventory vs Revenue Growth
Tesla inventory vs revenue growth
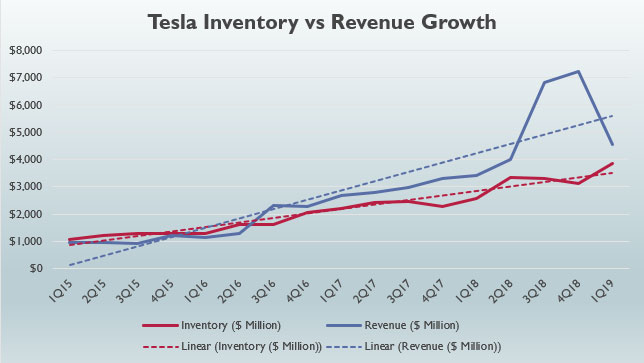
The chart above shows the dotted trend line of revenue growth versus inventory growth.
From the chart above, it has proven the statement that revenue growth is faster than inventory growth. You can see that the slope of the trend line of revenue is slightly steeper than the slope of the trend line of inventory.
From a spreadsheet calculation which I did not show here, the average sequential growth rate of revenue is 13% whereas the average sequential growth rate of inventory is 9%. The revenue has been growing sequentially at a rate slightly more than that of inventory.
To find out more about Tesla revenue growth, please visit this page: Tesla Revenue and Gross Margin.
Chart of Tesla Finished Goods Inventory and Its Percentage to Revenue
Tesla finished goods inventory and percentage to revenue
As I mentioned above that the finished goods inventory is closely related to the revenue generation as the component is mostly made up of vehicle in transit, I have plotted a chart of finished goods inventory and its percentage to revenue.
From the chart above, the same trend is occurring where the finished good inventory has been increasing. For finished goods inventory percentage to revenue, the trend shows that the figure has been decreasing from 1Q15 to 4Q18 and this happened as a result of revenue growth rate that is greater than the finished goods inventory growth rate.
The finished goods inventory bounced up slightly in 1Q19 to 50% of revenue and reached an all time high of $2.1 billion. This may or may not be something of a concern but we will need to see what happen in the next quarter.
Chart of Tesla Finished Goods Inventory vs Revenue Growth
Tesla finished goods inventory vs revenue growth
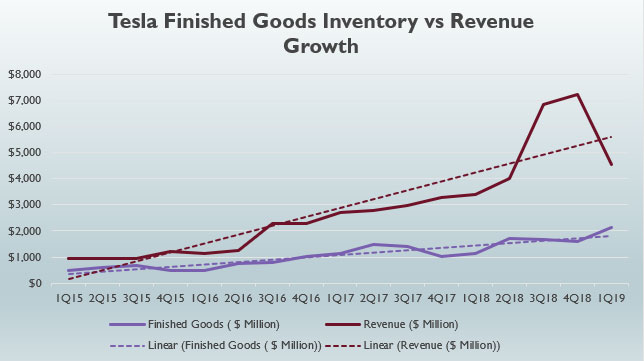
The chart above shows the dotted trend line of revenue growth versus finished goods inventory growth.
From a spreadsheet calculation that I did not show here, the average sequential growth rate from 1Q15 to 1Q19 for finished goods inventory is 12% whereas revenue growth rate is 13%. Therefore, revenue growth is slightly better than finished goods inventory.
From the chart, the trend line shows that revenue is growing faster than the finished goods inventory. The slope of the trend line of revenue is steeper than the slope of the trend line of finished goods inventory. This is the same trend that we observed in above chart for total inventory vs revenue growth.
Conclusion
Tesla is growing both its revenue and inventory at almost the same rate sequentially. Revenue growth is slightly better than inventory growth. The same trend is observed for finished good inventory where it is growing at almost the same rate as revenue sequentially.
Disclosure:The authors wrote this article themselves, and it expresses their own opinions. The authors are not receiving compensation for writing the article. The authors have no business relationship with any company whose stocks are mentioned in this article.
References:
1. Financial figures in the charts above were obtained from Tesla Quarterly Results.
2. Featured image was obtained from Thomas Hawk and Mike Fonseca.


