GMC Red Sierra. Source: Flickr
Investors following a company may want to look at the assets section, as these assets represent the future economic benefits of the company.
The rise and fall of specific asset classes on the balance sheet can indicate the financial health of the company. Investors should pay particular attention to assets that directly generate cash flow, such as receivables, inventory, and leasing assets.
Generally, a growing company should see its assets increase alongside revenue and sales. This is especially true for an automaker like General Motors, which relies heavily on fixed or hard assets for its operations.
This article presents an overview of General Motors’ (NYSE: GM) total assets, including a detailed breakdown of current and long-term assets, fixed assets, and cash-generating assets.
Let’s dive in!
Investors looking for other statistics of General Motors may find more resources on these pages:
- GM share buyback history,
- GM vs Ford in vehicle profit and margin, and
- GM debt analysis – net debt, debt ratio, payment due, liquidity, etc..
Please use the table of contents to navigate this page.
Table Of Contents
Definitions And Overview
O2. What Does The Growth Of GM’s Total Assets Represent?
Consolidated Result
A1. Total Assets
A2. Growth Rates Of Total Assets
Short-Term Assets
B1. Current Assets
Long-Term Assets
C1. Long-Term Assets
Breakdown Of Long-Term Assets
D1. Tangible Assets – Property
Cash-Generating Assets
E1. Equipment On Operating Leases
E2. GM Financial Receivables
Summary And Reference
S1. Summary
S2. References and Credits
S3. Disclosure
Definitions
To help readers understand the content better, the following terms and glossaries have been provided.
Cash-Generating Assets: Cash-generating assets are assets that directly contribute to the generation of cash flow for a company. These assets are crucial for a company’s operations, as they are responsible for producing revenue and ensuring liquidity. Examples of cash-generating assets include:
Examples of Cash-Generating Assets:
- Receivables: Accounts receivable represent money owed to the company by customers for goods or services provided. These receivables are expected to be collected in the near future, contributing to cash flow.
- Inventory: Inventory consists of goods that are available for sale. Selling inventory generates revenue and cash for the company.
- Leasing Assets: Equipment or property that the company leases to others generates rental income, contributing to cash flow.
- Investments: Investments in stocks, bonds, or other financial instruments can generate interest, dividends, or capital gains, providing cash flow.
- Property, Plant, and Equipment (PP&E): These are tangible fixed assets used in production. The revenue generated from selling goods or services produced using these assets contributes to cash flow.
Importance of Cash-Generating Assets:
- Revenue Generation: These assets are essential for producing revenue, which is crucial for the company’s profitability and growth.
- Liquidity: Cash-generating assets help maintain the company’s liquidity by ensuring a steady inflow of cash.
- Operational Efficiency: Efficient management of these assets can improve operational performance and financial stability.
Understanding cash-generating assets is vital for assessing a company’s ability to generate revenue, maintain liquidity, and ensure long-term financial health.
Property: Property on the balance sheet typically refers to tangible assets owned by a company that are used in its operations to generate revenue. These assets are also known as property, plant, and equipment (PP&E). Here’s a breakdown:
Property, Plant, and Equipment (PP&E)
- Property: This includes land and buildings owned by the company. Land is often listed separately because it doesn’t depreciate, while buildings do.
- Plant: This refers to the physical facilities where the company’s products are manufactured or where other business operations take place.
- Equipment: This includes machinery, vehicles, office equipment, furniture, and other tangible assets used in the company’s operations.
Understanding property on the balance sheet is crucial for assessing a company’s investment in long-term tangible assets and how effectively it uses these assets to generate revenue.
Equipment On Operating Leases: Equipment on operating leases refers to tangible assets that a company leases to others for their use, but retains ownership of. These are typically recorded on the balance sheet under a category such as “Operating Lease Assets” or similar.
Key Points
- Leased Assets: The equipment under operating leases is owned by the lessor (the company providing the lease) and leased to the lessee (the company or individual using the asset).
- Revenue Generation: The lessor generates revenue from these assets through lease payments received from the lessees.
- Depreciation: The lessor depreciates these leased assets over their useful lives, as they retain ownership and bear the associated risks and rewards.
- Presentation: On the balance sheet, these assets are typically listed under property, plant, and equipment (PP&E) or a separate section for leased assets, at their net book value (acquisition cost minus accumulated depreciation).
Understanding how equipment on operating leases is reported on the balance sheet helps assess the company’s investment in and revenue generation from leasing activities.
GM Financial Receivables: GM Financial Receivables refer to amounts owed to General Motors by its customers, typically arising from the sale of vehicles and related services on credit.
These receivables are categorized as current assets if they are expected to be collected within one year, and as non-current assets if the collection period extends beyond one year.
Key Points
- Accounts Receivable: This includes amounts due from dealerships and customers for vehicle sales made on credit. For example, as of Dec 31, 2023, GM Financial’s receivable totaled approximately $84 billion.
- Notes Receivable: These are formal promissory notes issued by customers, often with longer collection periods and may include interest.
- Other Receivables: This can include various types of non-trade receivables such as tax refunds, insurance claims, and advances to employees.
Presentation on Balance Sheets
- Current Assets: Receivables expected to be collected within one year are listed under current assets.
- Non-Current Assets: Receivables expected to be collected after more than one year are listed as non-current assets.
- Net Realizable Value: Financial receivables are reported at their net realizable value, which is the estimated amount expected to be collected, accounting for any allowances for doubtful accounts.
Understanding GM Financial’s receivables is crucial for assessing the company’s liquidity, credit risk, and overall financial health.
What Does The Growth Of GM’s Total Assets Represent?
The growth of General Motors’ (GM) total assets represents several key aspects of the company’s financial health and operational expansion:
- Increased Investments: The rise in total assets indicates that GM is investing more in its operations, including property, plant, equipment, and other assets necessary for production and sales.
- Revenue Generation: Growing assets often correlate with increased revenue and sales, as the company expands its capacity and capabilities.
- Strategic Acquisitions: GM may have acquired new assets, such as facilities, technologies, or subsidiaries, to strengthen its market position and diversify its offerings.
- Improved Financial Health: A steady increase in total assets can signal improved financial stability and a stronger balance sheet, which can enhance investor confidence.
- Operational Efficiency: The growth in assets, when coupled with efficient asset utilization, can lead to better operational performance and profitability.
Overall, the growth of GM’s total assets reflects the company’s ongoing efforts to expand, innovate, and improve its financial standing.
General Motors’ Total Assets
gm-total-assets
(click image to expand)
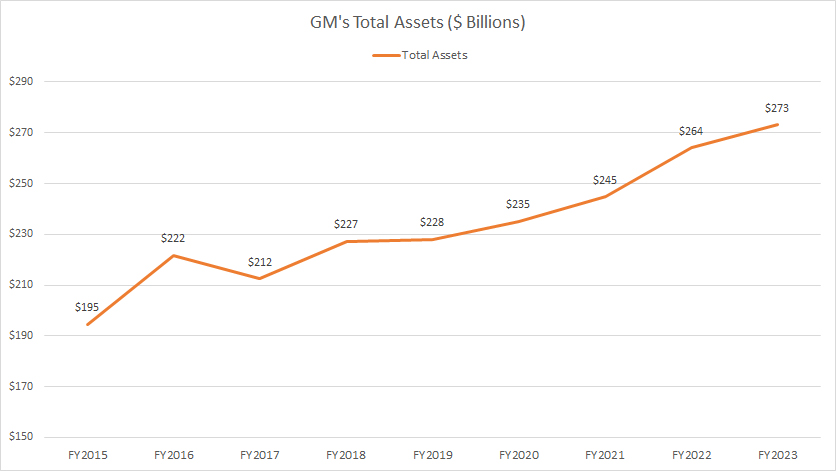
GM’s total assets have surged from $195 billion in fiscal year 2015 to $273 billion in fiscal year 2023, marking an impressive growth of 40% over eight years. In fiscal year 2022, GM’s total assets were estimated at $264 billion, and in fiscal year 2021, they stood at $245 billion.
As mentioned in this section – GM’s assets growth, the increase in GM’s total assets over the last eight years since fiscal year 2015 illustrates the company’s significant financial expansion and investment in its operations.
In addition, the growth of GM’s assets correlates with the increase in revenue and sales, as the company expands its capacity and capabilities. This trend often bodes well for shareholders, signaling robust financial health and potential for continued growth.
Growth Rates Of General Motors’ Total Assets
gm-growth-rates-of-total-assets
(click image to expand)
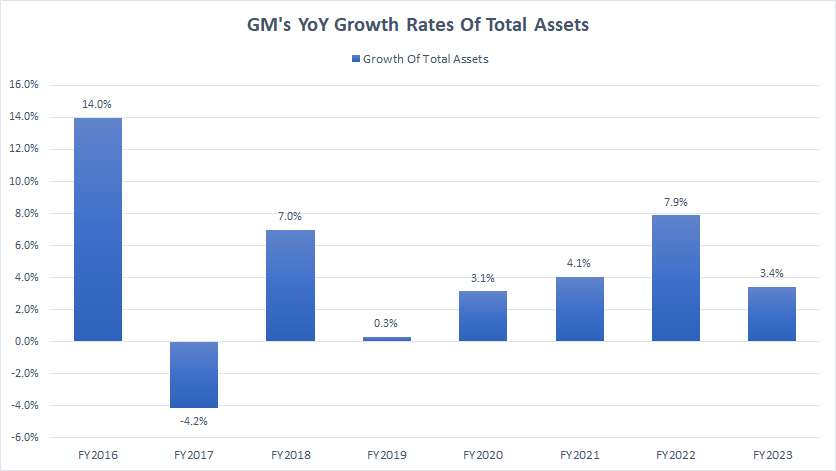
GM’s total assets saw modest growth of 3.4% in fiscal year 2023, following a significant increase of 7.9% in fiscal year 2022. In fiscal year 2021, GM’s total assets were 4.1% higher compared to the previous year. On average, GM’s total assets have experienced a steady annual growth rate of 5.1% over the past three years.
A notable trend is that GM’s total assets have consistently increased over the past eight years, as depicted in the graph above. This continuous growth in GM’s total assets bodes well for shareholders, indicating several favorable factors, including increased investment, growing revenue, and improving operational efficiency.
General Motors’ Current Assets
gm-current-assets
(click image to expand)
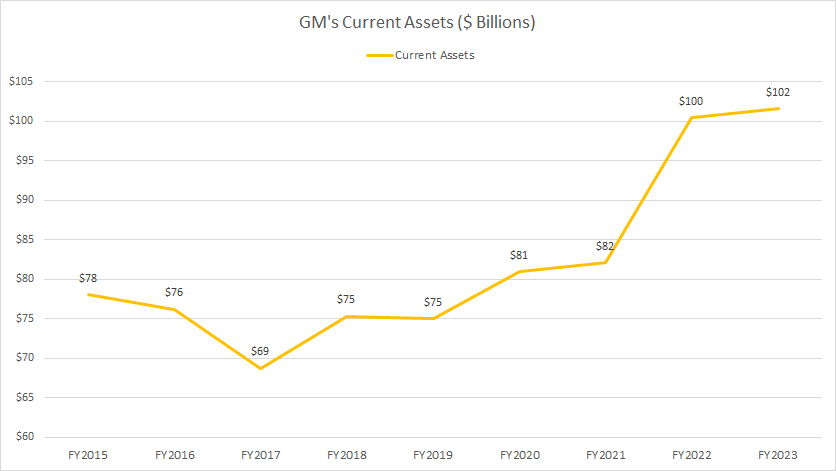
Alongside the overall growth in total assets, GM’s current assets have also shown significant expansion since fiscal year 2015, reaching $102 billion in fiscal year 2023. Over this period, GM’s current assets have increased by 30%, or $24 billion.
The growth of GM’s current assets represents several key aspects of the company’s short-term financial health and operational efficiency. For instance, the increase in GM’s current assets often leads to greater liquidity, providing the company with more liquid assets such as cash, inventory, and receivables.
Additionally, the growth of GM’s current assets indicates an improvement in inventory levels. This growing inventory suggests that GM is ramping up production of vehicles and parts, potentially anticipating higher sales demand and achieving greater operational efficiency.
Furthermore, the growth of GM’s current assets also translates to an increase in cash and cash equivalents. This stronger cash position provides the company with enhanced financial flexibility, often leading to a positive working capital, which is crucial for day-to-day operations and short-term financial stability.
Overall, the increase in GM’s current assets bodes well for shareholders because it signals the company’s enhanced financial health and operational efficiency.
General Motors’ Long-Term Assets
gm-long-term-assets
(click image to expand)
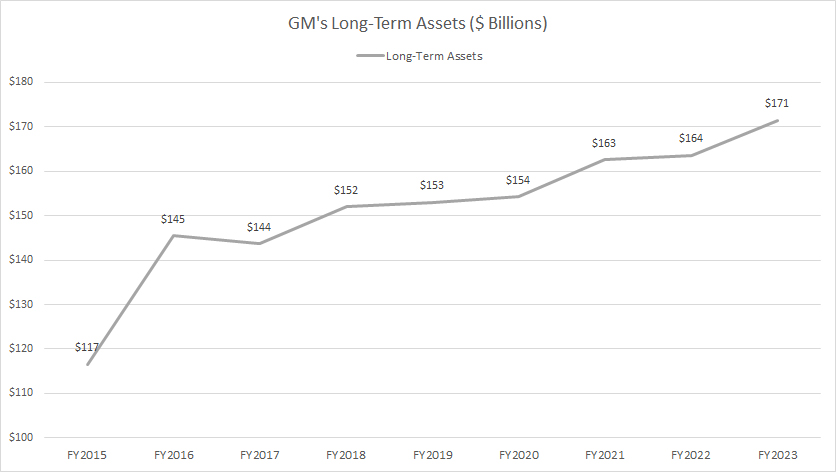
GM’s long-term assets have significantly risen since fiscal year 2015, reaching a record figure of $171 billion in fiscal year 2023. In fiscal year 2022, GM’s long-term assets were estimated at $164 billion. Overall, since fiscal year 2015, GM’s long-term assets have increased by 48%.
The growth of GM’s long-term assets represents several key aspects of the company’s strategic investments and financial stability. For instance, the increase in GM’s long-term assets often indicates that the company is making significant investments in property, plant, equipment, and technology to enhance its production capabilities and infrastructure.
Additionally, the rise in GM’s long-term assets also suggests that the company is expanding. For instance, GM is likely growing its operations through acquisitions, establishing new facilities, or upgrading existing ones to meet future demand.
GM’s growing long-term assets also signify an enhanced competitive position. By investing in long-term assets, GM strengthens its market position, enabling innovation and the introduction of new products and services.
Overall, the growth of GM’s long-term assets is a positive indicator of the company’s strategic direction and its ability to invest in its future growth and stability.
GM’s Tangible Assets – Property
gm-property
(click image to expand)
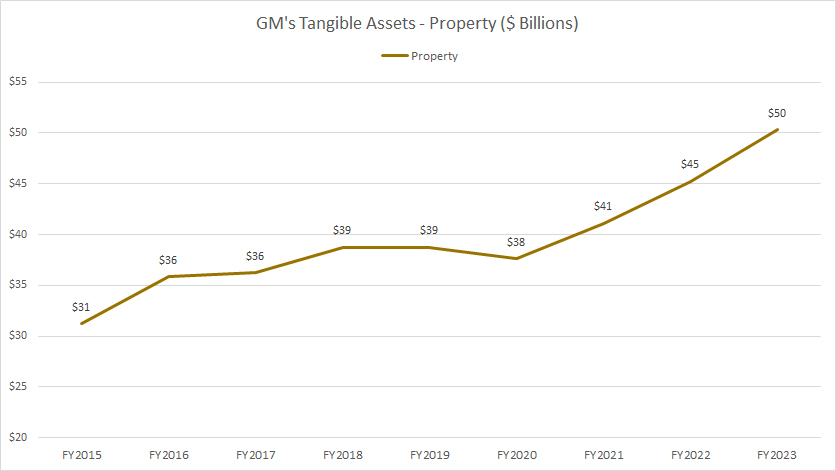
Some of GM’s most valuable assets are found within the long-term assets section of the balance sheet. These include property, which primarily consists of tangible assets such as factories, land, offices, equipment, and more. The definition of GM’s property assets is available here: GM’s property.
GM’s properties are among the company’s most vital assets. These asset classes enable GM to derive long-term economic benefits, such as sustained revenue generation. Without these assets, GM would be unable to operate, as they are essential for the manufacturing and distribution of the company’s products, including its cars, trucks, and SUVs.
As seen from the chart, GM’s property assets have significantly risen since fiscal year 2015, reaching $50 billion as of fiscal year 2023. Property assets remained flat between 2017 and 2020, primarily due to the sale of the GM Europe subsidiary during that period.
However, GM’s property assets continued to rise steadily after fiscal year 2020, surpassing their previous record high and reaching $50 billion by the end of 2023.
The growth of GM’s property assets is a clear indication of the company’s expansion. As GM’s businesses grow, they inevitably require more physical assets, such as offices, factories, warehouses, and equipment, to support this development.
In summary, the increase in GM’s property assets bodes well for the company and its shareholders, reflecting a positive outlook for sustained growth and investment.
GM’s Equipment On Operating Leases
gm-equipment-on-operating-leases-asset
(click image to expand)
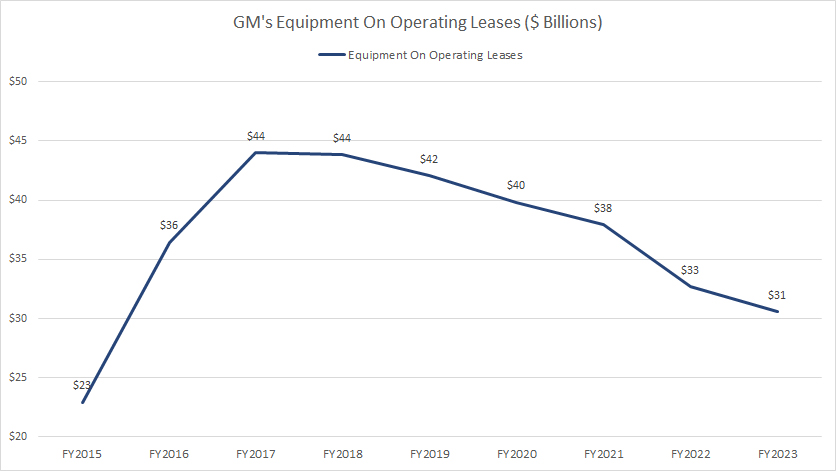
The equipment on operating leases asset is one of GM’s cash-producing or income-producing assets. You can find more information about GM’s cash-producing assets here: GM’s cash-generating assets.
As the name implies, equipment on operating leases are tangible or fixed assets that GM leases to third parties for leasing revenue. These assets primarily consist of vehicles leased to retail customers through GM Financial. You can more information about GM’s equipment on operating leases here: GM’s equipment on operating leases.
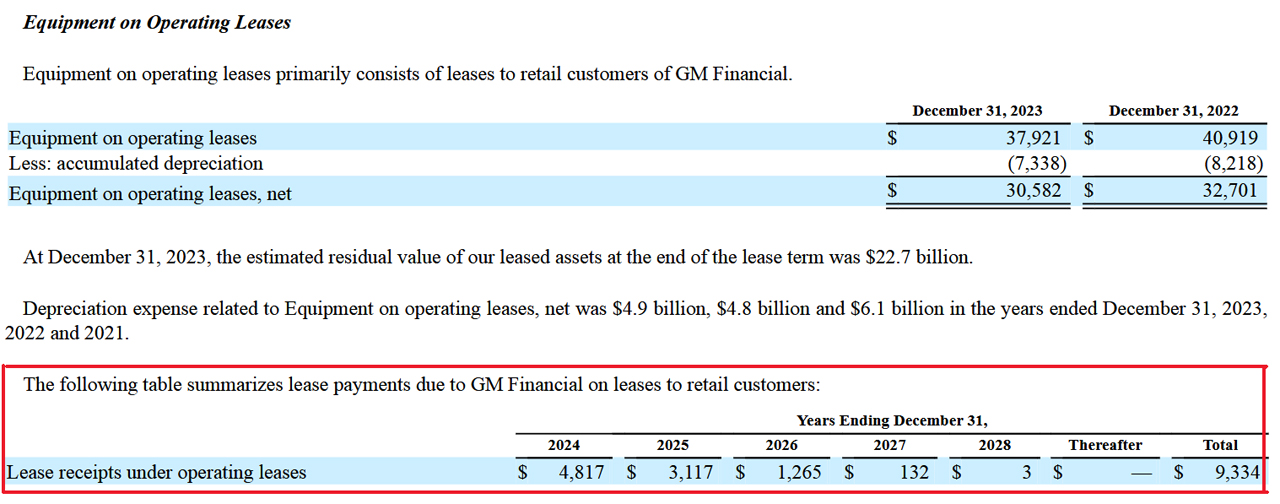
The following snapshot shows GM’s lease payment due to equipment on operating lease assets presented in the company’s 2023 annual report.
gm-lease-payment-from-equipment-on-operating-leases
(click image to expand)
As shown in the above snapshot, the expected cash or revenue generated from the equipment on operating leases is projected to total up to $9 billion over the four years spanning 2024 to 2027. You can see why this asset is being emphasized in this discussion and being called cash flow generating asset as they literally produce income for GM.
Referring back to the chart above, the growth of this income-generating asset was evident between fiscal 2015 and 2018. However, the asset has been steadily declining after fiscal year 2018. By fiscal year 2023, GM’s equipment on operating leases was valued at only $31 billion, marking a 30% decrease from its historical high reported in fiscal 2018.
As previously mentioned, the decline of a cash-generating asset is not a positive indicator for a company, especially in terms of revenue growth. In GM’s case, the reduction in this specific asset may lead to a decline in leasing revenue in the future.
However, it is important to note that leasing revenue constitutes only a small fraction of GM’s total revenue. For example, the lease payment from equipment on operating leases projected in fiscal year 2024 accounted for only about 3% of the total revenue generated in fiscal year 2023.
GM Financial Receivables
gm-financial-receivables
(click image to expand)
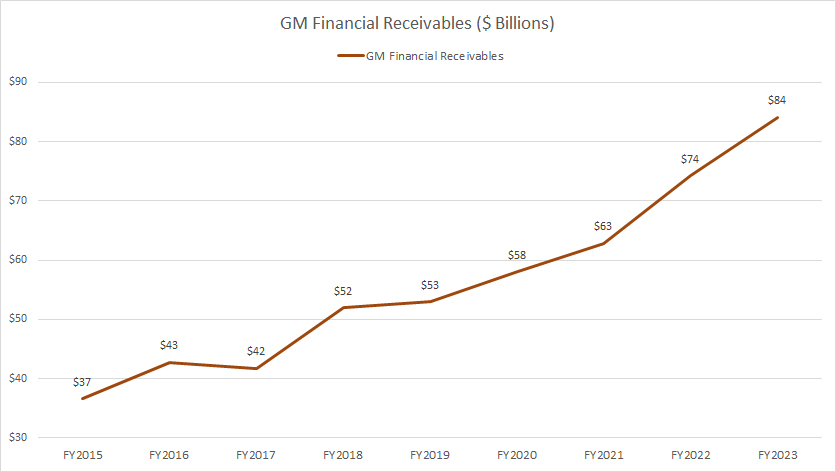
GM Financial receivables are another of GM’s cash or income-producing assets. These receivables are essentially loans provided to retail customers and commercial dealers, from which GM earns interest income. As such, GM Financial receivables represent an important asset class that generates substantial revenue for the company. You can find more information about GM Financial receivables here: GM Financial receivables.
As depicted in the graph above, GM Financial receivables have significantly grown over the years, reaching a record figure of $84 billion at the end of fiscal year 2023. This marks a 127% increase from the $37 billion recorded in fiscal year 2015.
Unlike the equipment on operating leases asset, which has been flat since fiscal 2017 and even declined in recent years, GM Financial receivables assets have been steadily increasing over the years. This growth is a positive sign, as it means that GM’s total sales will benefit from the increase in interest income.
In this aspect, the increase in GM Financial receivables represents several positive aspects of the company’s financial health and growth strategy.
Firstly, an increase in receivables indicates that more retail customers and commercial dealers are taking out loans from GM Financial. This suggests strong demand for GM’s financing services.
Secondly, as GM Financial receivables rise, the company earns more interest income from these loans, contributing to its overall revenue and profitability.
Thirdly, an uptick in receivables can indicate GM’s expansion into new markets or customer segments, broadening its reach and customer base.
Moreover, the increased receivables also means financial stability of the company. GM’s growing receivables reflect its ability to extend credit confidently, showcasing its financial stability and capability to manage credit risk.
Overall, the growth in GM Financial receivables is a positive indicator of the company’s financial health, operational success, and strategic growth efforts.
Conclusion
To sum up, GM’s total assets have consistently increased over the past eight years, signaling positive factors such as increased investment, growing revenue, and improving operational efficiency.
GM’s growth in other asset classes, such as current and long-term assets, also indicates a robust financial position, strategic investments, and enhanced operational efficiency.
These positive trends benefit shareholders by enhancing the company’s ability to meet short-term obligations, invest in new opportunities, and drive future growth.
References and Credits
1. All financial figures presented in this article were obtained and referenced from GM’s annual reports published in the company’s investor relation page: GM Annual and Quarterly Results.
2. Flickr Images.
Disclosure
References and examples such as tables, charts, and diagrams are constantly reviewed to avoid errors, but we cannot warrant the total correctness of all content.
The content in this article is for informational purposes only and is neither a recommendation nor a piece of financial advice to purchase a stock.
If you find the information in this article helpful, please consider sharing it on social media and providing a link to it from any website so that more articles like this can be created.
Thank you!

