An automotive part. Pexels Image.
The inventory is one of the most followed assets especially for companies whose inventories represent a significant portion of their assets.
For your information, General Motors (NYSE:GM) carries a significant number of inventories in its balance sheets, which accounted for more than 15% of its current assets as of 2024.
As an investor myself, I will always pay attention to a company’s inventory.
Particularly, the inventory turnover ratio and days sales in inventory are some of the ratios that help analyze a company’s inventory management.
In this article, we will explore General Motors’ inventory numbers and the respective inventory breakdown.
Additionally, we also look at some inventory ratios related to sales and current assets.
Let’s get started!
Please use the table of contents to navigate this page.
Table Of Contents
Definitions And Overview
- Inventory To Current Assets Ratio
- Inventory To Revenue Ratio
- Inventory Turnover Ratio
- Inventory Days
- Work In Progress Inventory
- Finished Goods Inventory
O2. How Does GM Manage Its Inventory?
O3. What Is In GM’s Inventory?
Consolidated Inventory
A1. Total Inventory
A2. Inventory YoY Growth Rates
Breakdown Of Inventory
B1. Inventory By Components
B2. Inventory By Components In Percentage
Total Inventory To Assets And Revenue Ratios
C1. Inventory To Current Assets Ratio
C2. Inventory To Revenue Ratio
Inventory Turnover And Days Ratios
D1. Inventory Turnover Ratio
D2. Days Of Inventory
Finished Goods Inventory Turnover And Days Ratios
E1. Finished Goods Inventory Turnover Ratio
E2. Finished Goods Days Of Inventory
Summary And Reference
S1. Summary
S2. References and Credits
S3. Disclosure
Definitions
To help readers understand the content better, the following terms and glossaries have been provided.
Inventory To Current Assets Ratio: The inventory to current asset ratio is a financial metric that compares a company’s inventory to its current assets. This ratio is calculated by dividing the inventory value by the total value of current assets. The formula looks like this:
Inventory to Current Asset Ratio = {Inventory} / {Current Assets}
This ratio provides insights into how much of a company’s current assets are tied up in inventory. It’s an important measure for understanding liquidity and operational efficiency.
A higher ratio may indicate that a significant portion of the company’s resources is invested in inventory, which might suggest issues with inventory management or sales.
Conversely, a lower ratio suggests that the company has a diversified range of current assets, potentially indicating better liquidity and less risk of inventory obsolescence. This ratio is particularly relevant in industries where inventory management is crucial, such as retail, manufacturing, and distribution.
Inventory To Revenue Ratio: The inventory-to-revenue ratio is a financial metric used to evaluate how efficiently a company manages its inventory relative to its sales. It is calculated by dividing the ending inventory balance by the total revenue for the same period. The formula looks like this:
Inventory to Revenue Ratio = {Inventory} / {Revenue}
This ratio helps to understand the proportion of a company’s inventory compared to its revenue. A lower ratio is generally preferred as it indicates that the company is efficiently converting its inventory into sales.
Conversely, a higher ratio may suggest overstocking or inefficiencies in managing inventory, potentially leading to higher holding costs or obsolescence risks. It’s an important indicator for businesses to monitor, especially those in the retail or manufacturing sectors, as it can significantly impact their cash flow and profitability.
Inventory Turnover Ratio: The inventory turnover ratio is a financial metric measuring how often a company’s inventory is sold and replaced over a specific period, typically a year. It is calculated by dividing the cost of goods sold (COGS) by the average inventory.
This ratio helps businesses understand how efficiently they manage their inventory, indicating whether they effectively sell their stock without overstocking or understocking.
A higher inventory turnover ratio implies that a company is selling its inventory quickly and is generally seen as positive, indicating strong sales or effective inventory management. Conversely, a low turnover ratio could suggest weak sales or excessive inventory levels.
Inventory Days: Inventory days, also known as days inventory outstanding (DIO), is a financial metric that measures the average number of days a company takes to sell its entire inventory over a specific period, typically a year.
It reflects how efficiently a company manages its inventory, indicating how quickly it can convert its inventory into sales. A lower number of inventory days suggests that a company is more efficient at selling its inventory, while a higher number suggests slower sales.
To calculate inventory days, you divide the ending inventory by the cost of goods sold (COGS) for the period, then multiply the result by the number of days in the period.
Work In Progress Inventory: Work-in-progress (WIP) inventory refers to the materials and items being manufactured but not yet completed products. It includes all the costs incurred during the manufacturing process, such as raw materials, labor, and overhead costs, up to that point in the production process.
WIP is considered an asset on a company’s balance sheet and is a critical part of the inventory for manufacturing and construction companies, as it provides insight into production efficiency, operational flow, and the potential value of unfinished goods. Proper management of WIP inventory is essential for accurate financial reporting and effective supply chain management.
Finished Goods Inventory: Finished Goods Inventory refers to the stock of completed products that are ready for sale but have not yet been sold. These products have undergone the entire production process, from raw materials to final goods, and are waiting to be distributed to retailers or consumers.
This type of inventory is a crucial component of a manufacturing company’s assets, reflecting both the value of the labor and materials invested in the products. Monitoring and managing finished goods inventory effectively is essential for meeting customer demand, optimizing sales, and maintaining efficient production cycles.
How Does General Motors Manage Its Inventory?
General Motors (GM), like many large automotive manufacturers, employs a variety of strategies to manage its inventory effectively, ensuring that it aligns with demand while minimizing costs. Here are some key strategies GM uses:
1. **Just-In-Time (JIT) Manufacturing**: GM has adopted the JIT inventory system, which aims to reduce inventory levels by receiving goods only as they are needed in the production process. This approach helps GM minimize inventory costs and reduce waste.
2. **Demand Forecasting**: Accurate demand forecasting is critical for effective inventory management. GM uses sophisticated analytics and market research to predict customer demand for different models and configurations. This helps the company adjust production schedules and inventory levels accordingly.
3. **Supplier Integration**: GM works closely with its suppliers to ensure a smooth supply chain. By integrating suppliers into their inventory management system, GM can reduce lead times and ensure a steady flow of materials and parts. This collaboration often involves sharing forecasts and production schedules to synchronize supply with demand.
4. **Technology and Automation**: GM utilizes advanced technology and automation systems for inventory management, including Enterprise Resource Planning (ERP) and Supply Chain Management (SCM) systems. These systems provide real-time visibility into inventory levels, production schedules, and supplier deliveries, allowing GM to make informed decisions quickly.
5. **Strategic Inventory Positioning**: GM strategically positions inventory at various points in its supply chain to serve customers efficiently. This includes finished vehicles at dealerships, parts at distribution centers, and raw materials at manufacturing plants. Strategic positioning helps reduce delivery times and improve service levels.
6. **Lean Manufacturing**: Embracing lean manufacturing principles, GM focuses on reducing waste throughout its production and inventory processes. This involves continuous improvement practices to streamline operations, improve quality, and reduce excess inventory.
7. **Dealer Management**: GM collaborates closely with its dealership network to manage the inventory of finished vehicles. The company provides dealers with tools and data to balance inventory levels with sales trends, helping them order the right mix of models and options to meet local market demand.
By employing these strategies, General Motors aims to balance minimizing inventory costs and efficiently meeting customer demand. This is crucial in the automotive industry, where customer preferences can shift rapidly, and the cost of holding inventory is high.
What Makes Up General Motors’ Inventories?
GM Inventory Components ($ Millions)
| Fiscal Year | |||||||
|---|---|---|---|---|---|---|---|
| 2024 1Q | 2023 | 2022 | 2021 | 2020 | 2019 | 2018 | |
| Raw Materials & Work In Progress | $7,384 | $7,422 | $8,014 | $8,240 | $5,117 | $4,713 | $4274 |
| Finished Goods & Service Parts | $10,149 | $9,0039 | $7,353 | $4,748 | $5,118 | $5,685 | $5,542 |
GM’s inventory consists of the following components:
- 1. Productive materials (raw materials), supplies, and work in process
- 2. Finished products (inclusive of service parts)
Productive materials or raw materials primarily consist of steel, aluminum, resins, copper, lead, and platinum group metals.
The company stated that it does not carry a substantial inventory of such raw materials over levels reasonably required to meet its production requirement.
Finished products are new vehicles in transit for deliveries and used vehicles returned from daily rental car companies and vehicles utilized by GM’s employees.
GM’s inventories are stated at the lower of cost or net realizable value and are reviewed periodically to determine if inventory quantities are more than expected usage or if they have become obsolete.
If there is a write-down in inventory, the charges will be reflected in operating expenses in the income statements.
Total Inventory
GM total inventory
(click image to expand)
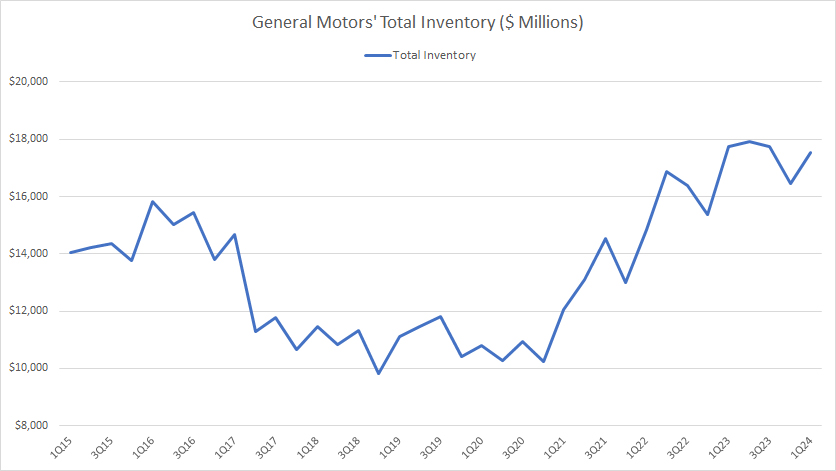
GM’s total inventory has significantly risen since fiscal year 2021. Prior to fiscal year 2021, GM’s total inventory had mostly remained flat, possibly due to the disruption of the pandemic.
As of 1Q 2024, GM’s total inventory reached a record figure close to $18 billion, an all-time high since 2015.
Inventory YoY Growth Rates
GM inventory YoY growth rates
(click image to expand)
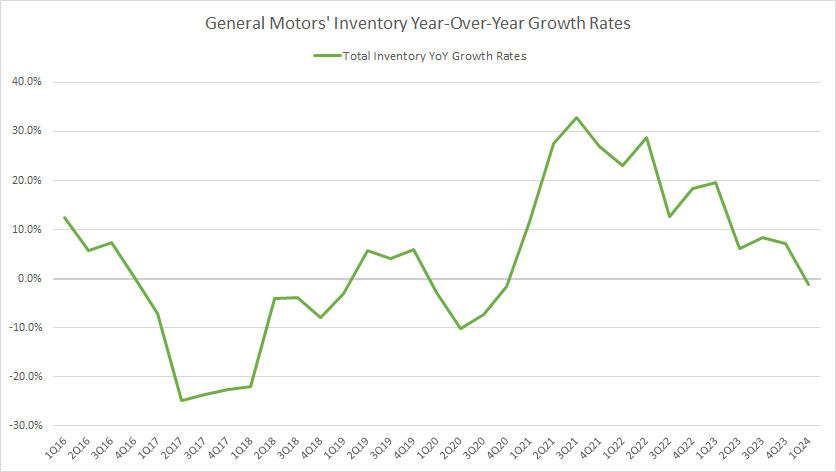
GM had registered mainly an inventory decline before fiscal year 2021. However, in post-pandemic periods after fiscal year 2021, GM has been having significant inventory growth, as depicted in the chart above.
The growth of GM’s total inventory has averaged 8% per quarter since fiscal 1Q 2023.
In my opinion, one primary reason for GM’s inventory growth in recent periods has been due to the updates in models and the introduction of new electric vehicles (EVs). These practices have significantly driven up inventory levels as GM prepares to meet the market’s evolving demands.
Inventory By Components
GM inventory components
(click image to expand)
GM’s total inventories are broken down into two components and they are (1) finished products and (2) productive materials (inclusive of work in progress). The definitions of GM’s inventory components are available here: work-in-progress inventory and finished-goods inventory.
GM’s finished product inventory is also made up of service parts such as vehicle accessories and replacement parts.
GM’s raw material inventory had significantly soared in the last several periods but has tapered down recently.
On the other hand, GM’s finished product inventory was at a record figures in 2024, reaching over $10 billion in the latest quarter.
Is GM anticipating something big with such a high level of finished product inventory?
Inventory By Components In Percentage
GM inventory components in percentage
(click image to expand)
The definitions of GM’s inventory components are available here: work-in-progress inventory and finished-goods inventory.
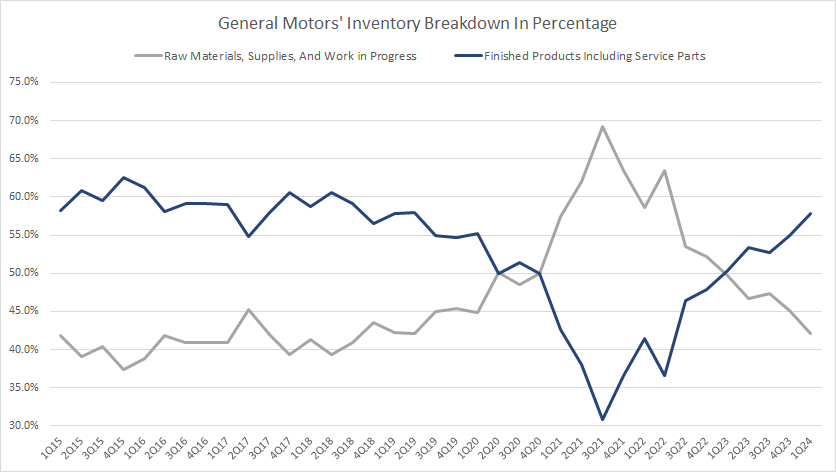
Percentage-wise, GM’s raw material inventory had significantly exceeded the finished product inventory prior to 2023.
However, GM’s finished product inventory has been catching up and has exceeded the raw material inventory since fiscal 2023. As of 1Q 2024, GM carried significantly more finished products than raw materials. The ratio of GM’s finished product inventory exceeded 55% and was on the cusp of reaching 60%.
Inventory To Current Assets Ratio
GM total inventory to current assets ratio
(click image to expand)
The definition of inventory to current assets ratio is available here: inventory to current assets ratio.
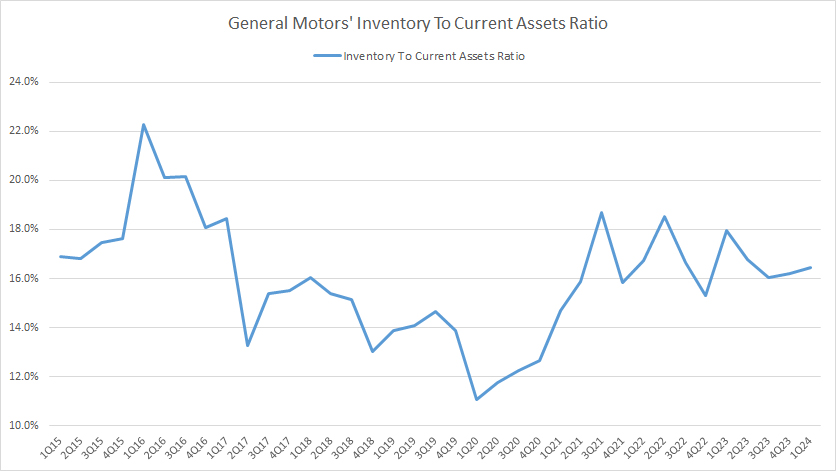
GM’s inventory levels are certainly on the high side in post-pandemic periods, as reflected in the elevated inventory to current assets ratio in the post-pandemic age.
Over the last several quarters, GM’s total inventory has consistently made up over 16% of its current assets.
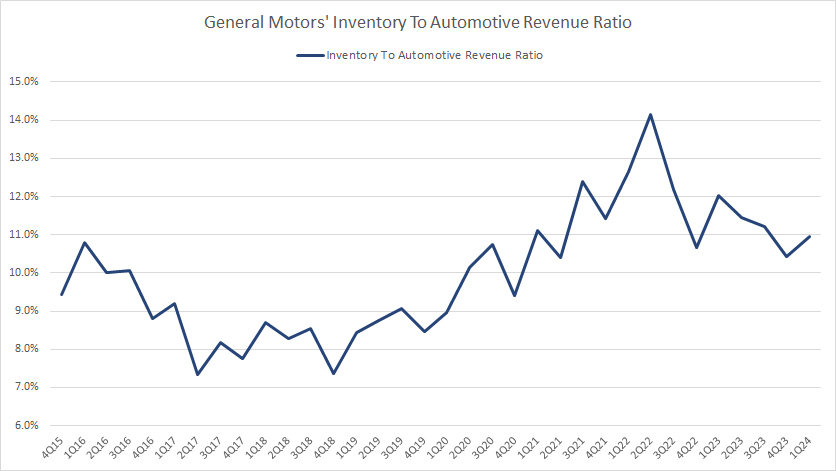
Inventory To Automotive Revenue Ratio
GM total inventory to revenue ratio
(click image to expand)
The definition of inventory to revenue ratio is available here: inventory to revenue ratio.
Similarly, GM’s rising inventory to its automotive revenue ratio in recent periods shows that GM’s inventory levels have significantly risen after fiscal year 2021.
The ratio had been consistently above 10% since fiscal year 2021.
Inventory Turnover Ratio
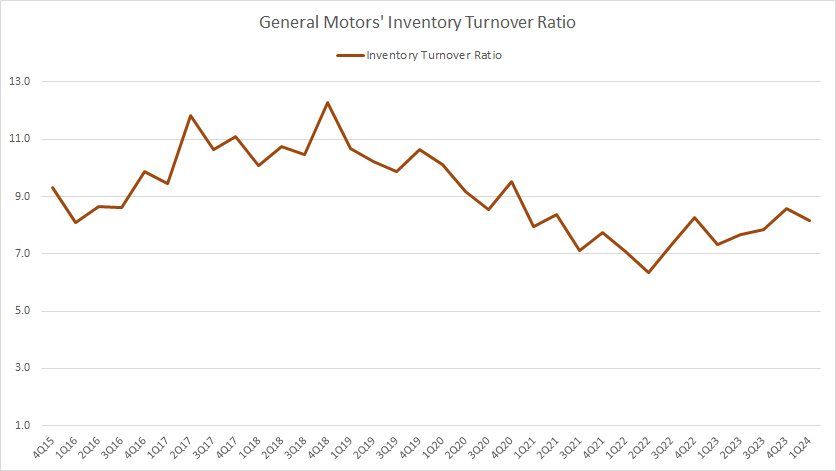
GM inventory turnover ratio
(click image to expand)
The inventory turnover ratio formula is shown below:
Inventory Turnover Ratio = Cost of Automotive Sales / Closing Inventory
The definition of inventory turnover ratio is available here: inventory turnover ratio.
GM’s inventory turnover ratio has significantly deteriorated post-pandemic compared to pre-COVID levels. However, it has slightly recovered recently.
As of 1Q 2024, GM’s inventory turnover ratio hovered around 8.0X. The lower ratio has implied that GM’s total inventory has been cleared at a slower rate.
Although the inventory ratio has recovered recently, it is still far below the pre-COVID levels.
Days Sales In Inventory
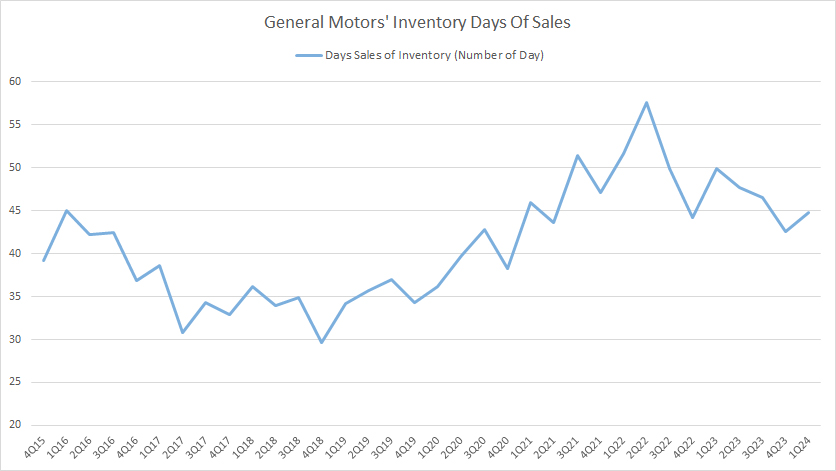
GM days of sales in inventory
(click image to expand)
The days of sales in inventory are similar to the inventory turnover ratio except that it is in numbers of days. The definition of inventory days ratio is available here: inventory days.
As shown in the chart, GM took about 40 plus days to clear its total inventory. Annually, GM is capable of clearing its inventory by about 9 times at this rate.
GM’s inventory days ratio has significantly risen in recent periods, illustrating the company’s longer inventory holding period.
Finished Goods Inventory Turnover Ratio
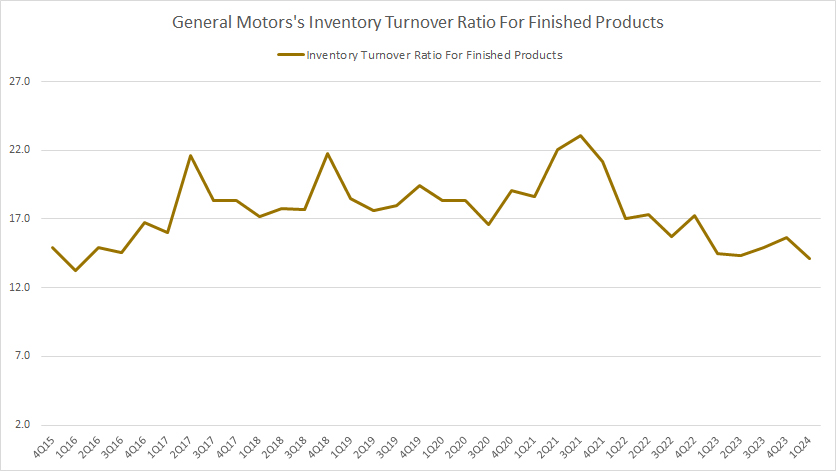
GM finished products inventory turnover ratio
(click image to expand)
If we look at the finished goods inventory alone, the turnover ratio was much better than the total inventory. As illustrated in the chart above, GM’s finished goods inventory turnover ratio has consistently hovered above 12.0X, which is much higher than the 7.0X for total inventory. The higher ratio indicates a much better turnover for GM’s finished goods inventory compared to total inventory.
However, GM’s finished goods inventory ratio has dropped below 17.0X since fiscal year 2022, illustrating GM’s slower rate at clearing its finished goods inventory recently.
Finished Product Inventory Days
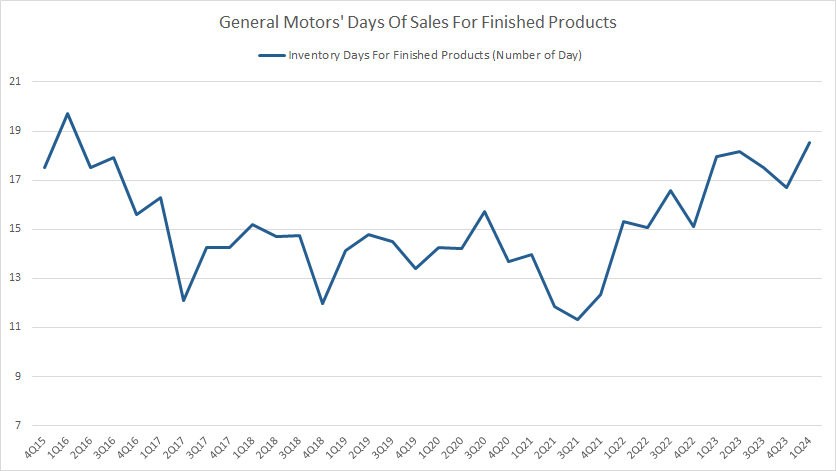
GM finished product inventory days
(click image to expand)
An industry standard that has been used by most automotive companies including Tesla in measuring inventory turnover is the inventory days on hand for finished products.
For your information, the finished product inventory refers to new and used vehicle inventories as well as service parts for General Motors.
The formula to calculate the inventory days is shown below:
Days of sales for finished products = (new car inventory / trailing deliveries ) X 261 working days
(Source: automotive news)
For a quarterly calculation, I have slightly modified the above equation. I have replaced the new car inventory with GM’s finished products to include not only new vehicles but also used vehicles as well as service parts.
Therefore, GM’s inventory days for finished products hovered above 17 days as of fiscal 1Q 2024 and was much lower than that of the total inventory.
This ratio has significantly risen in recent periods, indicating the longer finished product inventory holding periods.
Conclusion
GM’s total inventory has ballooned significantly to record figures in recent quarters, totaling close to $18 billion in 2024.
Is GM anticipating a surge in demand looking ahead?
References and Credits
1. All financial figures presented in this article were obtained and referenced from GM’s SEC filings, earnings reports, news releases, shareholder presentations, quarterly and annual reports, webcast, etc., which are available in GM Shareholder Information.
2. Pexels Images.
Disclosure
References and examples such as tables, charts, and diagrams are constantly reviewed and cross-checked to avoid errors.
The content in this article is for informational purposes only and is neither a recommendation nor a piece of financial advice to purchase a stock.
If you find the information in this article helpful, please consider sharing it on social media and also provide a link back to this article from any website so that more articles like this one can be created in the future.
Thank you!


