GM Cruise autonomous vehicle. Flickr Image.
This article presents General Motors (NYSE: GM)’s U.S. market share of trucks, crossover/SUVs, and sedans/cars.
General Motors categorizes its U.S. vehicle lineup into three segments:
- Trucks
- Cars (or Sedans)
- SUVs (or Crossovers)
This breakdown provides a clear view of GM’s diverse offerings in the U.S. market. Let’s look at the market share numbers!
For other key statistics of General Motors, you may find more information on these pages:
Global Sales & Market Share
Wholesale
U.S. Sales & Market Share
Revenue
Profit Margin
Debt & Cash
GM China Statistics
Comparison With Peers
- GM vs Ford: vehicle profit and margin comparison,
- GM vs Tesla & Ford: advertising and marketing budget,
- GM vs Tesla: R&D spending,
Other Statistics
- Inventory levels, inventory days and turnover ratio,
- Share buyback history,
- Asset analysis: receivables, property, etc.,
Please use the table of contents to navigate this page.
Table Of Contents
Definitions And Overview
O2. What drives the market share decline in GM’s sedan cars in the U.S.?
Consolidated Results
Market By Vehicle Type
B1. Market Share Of Truck, SUV, and Sedan
Conclusion And Reference
S1. Insight
S2. References and Credits
S3. Disclosure
Definitions
To help readers understand the content better, the following terms and glossaries have been provided.
Market Share: General Motors’ market share is calculated by comparing the company’s vehicle sales to the total vehicle sales in the market over a specific period, typically on a quarterly or annual basis.
This calculation can be applied to various contexts, such as a particular country’s market, a region, or the global market. Here is the formula:
GM’s Market Share = {{GM’s Vehicle Sales} / {Total Market Vehicle Sales}} * 100%
This will give you General Motors’ market share as a percentage of the total market. For example, if General Motors sold 2 million vehicles in a year in the U.S., and the total U.S. vehicle sales were 15 million, GM’s market share would be:
GM’s Market Share = {{2,000,000} / {15,000,000}) * 100% = 13.33%
This calculation gives a snapshot of General Motors’ competitive position within the automotive market for the period in question. Market share is a crucial metric for assessing a company’s size, health, and competitiveness within its industry.
What drives the market share decline in GM’s sedan cars in the U.S.?
The decline in GM’s sedan market share in the U.S. is driven by several factors:
-
Shifting Consumer Preferences: Over the past decade, U.S. consumers have increasingly favored SUVs, crossovers, and trucks due to their spaciousness, versatility, and perceived value. Sedans, once a staple of the automotive market, have become less appealing to buyers seeking practicality and utility.
-
Profitability and Strategic Focus: GM has prioritized vehicle segments with higher profit margins, such as trucks and SUVs. Sedans, which are less profitable, have seen reduced investment and marketing efforts, further contributing to their decline.
-
Impact of Electric Vehicles (EVs): GM’s focus on EV development has shifted resources away from traditional sedans. The company is investing heavily in electrifying its lineup, which includes SUVs and trucks, aligning with broader industry trends.
-
Market Trends: The overall sedan segment in the U.S. has been shrinking, with many automakers scaling back sedan production or discontinuing models altogether. GM’s sedan lineup has also been affected by this industry-wide shift.
These factors collectively highlight GM’s strategic adaptation to evolving consumer demands and market dynamics.
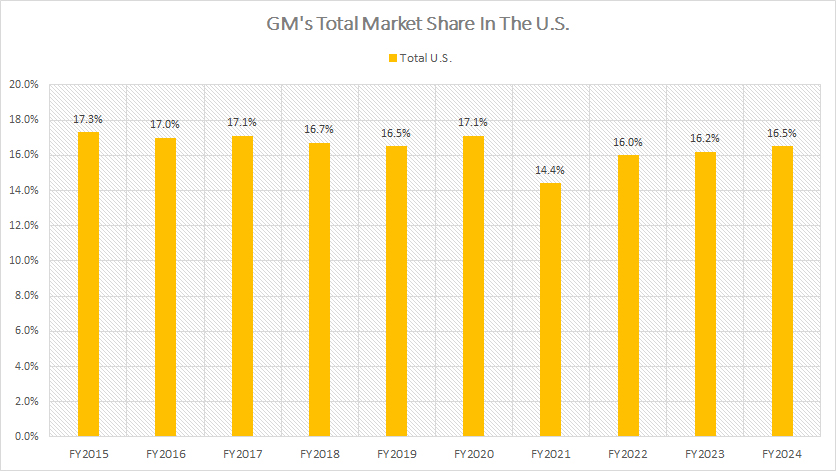
GM’s Total U.S. Market Share
GM-U.S.-total-market-share
(click image to expand)
The calculation of GM’s market share is available here: market share.
Market Share in FY2024:
| Vehicle Type | FY2024 |
|---|---|
| Total U.S. | 16.5% |
3-Year Market Share Trend from FY2022 to FY2024:
| Vehicle Type | FY2022 to FY2024 |
|---|---|
| Total U.S. | 16.0% to 16.5% |
5-Year Market Share Trend from FY2020 to FY2024:
| Vehicle Type | FY2020 to FY2024 |
|---|---|
| Total U.S. | 17.1% to 16.5% |
10-Year Market Share Trend from FY2015 to FY2024:
| Vehicle Type | FY2015 to FY2024 |
|---|---|
| Total U.S. | 17.3% to 16.5% |
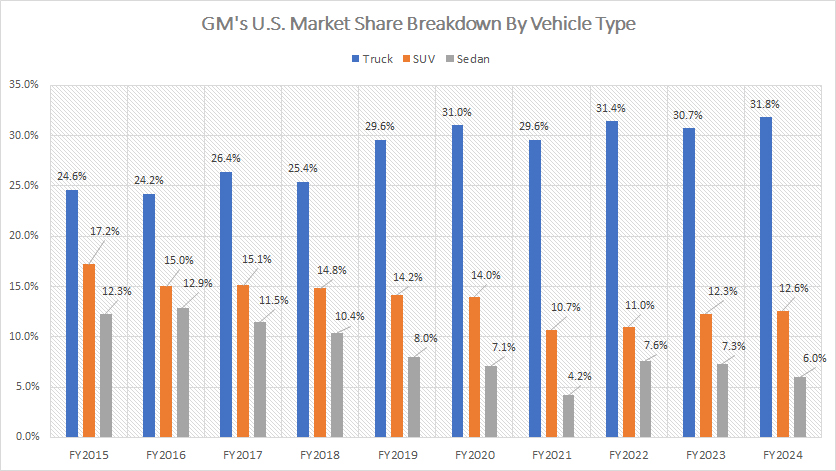
Market Share Of Truck, SUV, and Sedan
GM-U.S.-market-share-by-vehicle-type
(click image to expand)
The calculation of GM’s market share is available here: market share.
Market Share in FY2024:
| Vehicle Type | FY2024 |
|---|---|
| Truck | 31.8% |
| SUV/Crossover | 12.6% |
| Sedan/Car | 6.0% |
3-Year Market Share Trend from FY2022 to FY2024:
| Vehicle Type | FY2022 to FY2024 |
|---|---|
| Truck | 31.4% to 31.8% |
| SUV/Crossover | 11.0% to 12.6% |
| Sedan/Car | 7.6% to 6.0% |
5-Year Market Share Trend from FY2020 to FY2024:
| Vehicle Type | FY2020 to FY2024 |
|---|---|
| Truck | 31.0% to 31.8% |
| SUV/Crossover | 14.0% to 12.6% |
| Sedan/Car | 7.1% to 6.0% |
10-Year Market Share Trend from FY2015 to FY2024:
| Vehicle Type | FY2015 to FY2024 |
|---|---|
| Truck | 24.6% to 31.8% |
| SUV/Crossover | 17.2% to 12.6% |
| Sedan/Car | 12.3% to 6.0% |
Insight
A notable key insight is General Motors’ (GM) strategic shift in its vehicle lineup, reflecting evolving consumer preferences and market dynamics in the U.S. automotive industry.
Trucks remain GM’s strongest segment, accounting for a dominant share of its U.S. market, with steady growth from 31.0% in 2020 to 31.8% in 2024. This stability highlights GM’s ability to capitalize on the high demand for larger and more versatile vehicles.
SUVs and crossovers have also shown strong recovery, with their market share increasing from 11.0% in 2022 to 12.6% in 2024, suggesting GM’s adaptability in responding to consumer trends.
In contrast, sedans have experienced a dramatic decline, falling from a market share of 12.3% in 2015 to just 6.0% in 2024. This decrease underscores the industry’s broader shift away from sedans, driven by consumer preference for SUVs and trucks, as well as GM’s focus on higher-margin segments like SUVs and electric vehicles.
Overall, GM’s strategy illustrates its ability to prioritize profitable vehicle categories while navigating changes in market demand.
References and Credits
1. All sales figures presented were obtained and referenced from General Motors’ quarterly and annual statements published on the company’s investor relations page: GM Investor Relations.
2. Flickr Images.
Disclosure
We may use artificial intelligence (AI) tools to assist us in writing some of the text in this article. However, the data is directly obtained from original sources and meticulously cross-checked by our editors multiple times to ensure its accuracy and reliability.
If you find the information in this article helpful, please consider sharing it on social media. Additionally, providing a link back to this article from any website can help us create more content like this in the future.
Thank you for your support and engagement! Your involvement helps us continue to provide high-quality, reliable content.


