A Tesla sale office. Flickr Image.
This article delves into various statistics related to Tesla’s inventory, including the total inventory, breakdown by category and segment, as well as inventory ratios.
For the coverage of inventory turnover ratio, investors may find more information on this page: Tesla’s inventory turnover ratio and days of inventory.
Tesla’s inventory comprises all the vehicles and parts it has in stock and available for sale or use in production. They include new vehicles (cars, trucks, etc.), used vehicles, replacement parts, and accessories.
In addition, Tesla’s inventory also includes raw materials and components required for vehicle production. Efficient inventory management is crucial for Tesla to meet customer demand, maintain production schedules, and minimize costs.
As Tesla grows, its inventory has significantly risen over the years. As of 2024, Tesla’s inventory represented over 20% of its current assets, making it the second largest asset after cash.
Tesla’s inventory generates substantial future economic benefits for the company. As such, investors should pay attention to this asset class. A bloating inventory will hurt the company’s financial health, but a properly managed one will bring immersed advantages.
Let’s look at the numbers! You may find related statistic of Tesla on these pages:
- Tesla solar vs automotive,
- Is Tesla going out of business, and
- Tesla assets turnover vs General Motors.
Please use the table of contents to navigate this page.
Table Of Contents
Definitions And Overview
- Inventory To Current Assets Ratio
- Inventory To Revenue Ratio
- Work In Progress Inventory
- Finished Goods Inventory
O2. How Does Tesla Manage Its Inventory?
O3. What Is In Tesla’s Inventory?
Consolidated Inventory
B1. Inventory Levels
B2. Inventory YoY Growth Rates
Breakdown Of Inventory By Segment
C1. Inventory By Segment
C2. Inventory By Segment In Percentage
Breakdown Of Inventory By Category
C3. Inventory By Category
C4. Inventory By Category In Percentage
Inventory Ratios
D1. Total Inventory To Current Assets Ratio
D2. Total Inventory To Revenue Ratio
Summary And Reference
S1. Summary
S2. References and Credits
S3. Disclosure
Definitions
To help readers understand the content better, the following terms and glossaries have been provided.
Inventory To Current Assets Ratio: The inventory to current asset ratio is a financial metric that compares a company’s inventory to its current assets.
This ratio is calculated by dividing the inventory value by the total value of current assets. The formula looks like this:
Inventory to Current Asset Ratio = {Inventory} / {Current Assets}
This ratio provides insights into how much of a company’s current assets are tied up in inventory. It’s an important measure for understanding liquidity and operational efficiency.
A higher ratio may indicate that a significant portion of the company’s resources is invested in inventory, which might suggest issues with inventory management or sales.
Conversely, a lower ratio suggests that the company has a diversified range of current assets, potentially indicating better liquidity and less risk of inventory obsolescence.
This ratio is particularly relevant in industries where inventory management is crucial, such as retail, manufacturing, and distribution.
Inventory To Revenue Ratio: The inventory-to-revenue ratio is a financial metric used to evaluate how efficiently a company manages its inventory relative to its sales.
It is calculated by dividing the ending inventory balance by the total revenue for the same period. The formula looks like this:
Inventory to Revenue Ratio = {Inventory} / {Revenue}
This ratio helps to understand the proportion of a company’s inventory compared to its revenue. A lower ratio is generally preferred as it indicates that the company is efficiently converting its inventory into sales.
Conversely, a higher ratio may suggest overstocking or inefficiencies in managing inventory, potentially leading to higher holding costs or obsolescence risks.
It’s an important indicator for businesses to monitor, especially those in the retail or manufacturing sectors, as it can significantly impact their cash flow and profitability.
Work In Progress Inventory: Work-in-progress (WIP) inventory refers to the materials and items being manufactured but not yet completed products.
It includes all the costs incurred during the manufacturing process, such as raw materials, labor, and overhead costs, up to that point in the production process.
WIP is considered an asset on a company’s balance sheet and is a critical part of the inventory for manufacturing and construction companies, as it provides insight into production efficiency, operational flow, and the potential value of unfinished goods.
Proper management of WIP inventory is essential for accurate financial reporting and effective supply chain management.
Finished Goods Inventory: Finished Goods Inventory refers to the stock of completed products that are ready for sale but have not yet been sold.
These products have undergone the entire production process, from raw materials to final goods, and are waiting to be distributed to retailers or consumers.
This type of inventory is a crucial component of a manufacturing company’s assets, reflecting both the value of the labor and materials invested in the products.
Monitoring and managing finished goods inventory effectively is essential for meeting customer demand, optimizing sales, and maintaining efficient production cycles.
Tesla’s finished goods inventory includes products-in-transit to fulfill customer orders, new vehicles available for sale, used vehicles and energy products available for sale, according to the quarterly and annual reports.
How Does Tesla Manage Its Inventory?
Tesla, Inc. utilizes a distinctive approach to managing its inventory compared to traditional automotive manufacturers. This approach is integral to Tesla’s broader strategy of innovation, efficiency, and customer satisfaction. Here’s an overview of how Tesla manages its inventory:
1. **Direct Sales Model**: Tesla sells its vehicles directly to consumers, bypassing the conventional dealership model. This direct-to-consumer approach helps Tesla maintain tighter control over its inventory levels, reducing excess inventory and associated costs.
2. **Build-to-Order**: Tesla primarily operates on a build-to-order system where customers configure and order their vehicles online. This system allows Tesla to align production closely with demand, minimizing the need for large inventories of unsold vehicles.
3. **Vertical Integration**: Tesla’s high degree of vertical integration, including in-house manufacturing of key components like batteries and electric motors, provides it greater flexibility and control over its supply chain. This control helps Tesla to adjust production plans more swiftly and efficiently, further optimizing inventory levels.
4. **Real-Time Data and Analytics**: Tesla leverages advanced data analytics and real-time monitoring to forecast demand, track inventory levels, and optimize production schedules. This data-driven approach enables Tesla to respond rapidly to changes in market demand and reduce the risk of overproduction or stockouts.
5. **Global Inventory Distribution**: Tesla strategically positions its inventory across various global markets based on regional demand forecasts. This global distribution strategy helps minimize transit times and costs, ensure quicker customer delivery, and optimize regional inventory levels.
6. **Software Updates Over-the-Air (OTA)**: Tesla’s ability to enhance vehicle features and functionality through OTA software updates reduces the need for physical inventory to implement upgrades. This capability allows Tesla to maintain the relevance and value of its vehicles post-manufacture, unlike traditional automakers that might need to manage inventory of updated models or parts.
7. **Efficient Logistics and Delivery**: Tesla continues to invest in improving its logistics and delivery operations. The goal is to reduce delivery times from factory to customer, which enhances customer satisfaction and helps reduce inventory holding costs.
By integrating these strategies, Tesla is able to manage its inventory more effectively, aligning production with demand, reducing unnecessary costs, and ensuring a better match between its manufacturing output and customer orders. This approach is key to Tesla’s operational efficiency and market success.
What Is In Tesla’s Inventory?
Tesla Inventory Components ($ Millions)
| Fiscal Year (Dec 31) | ||||||
|---|---|---|---|---|---|---|
| 2024 | 2023 | 2022 | 2021 | 2020 | 2019 | |
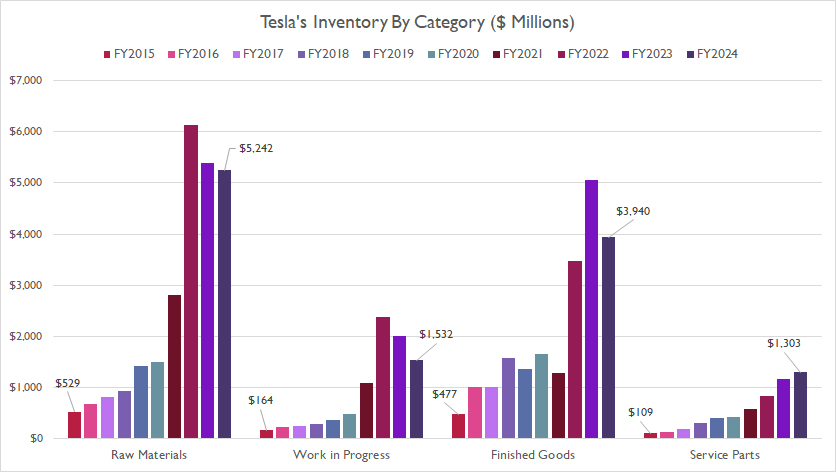
| Raw Materials | $5,242 | $5,390 | $6,137 | $2,816 | $1,508 | $1,428 |
| Work In Progress | $1,532 | $2,016 | $2,385 | $1,089 | $493 | $362 |
| Service Parts | $1,303 | $1,171 | $842 | $575 | $434 | $406 |
| Finished Goods | $3,940 | $5,049 | $3,475 | $1,277 | $1,666 | $1,356 |
As shown in the table above, Tesla’s inventory consists of the following categories:
- 1. Raw materials
- 2. Work in progress
- 4. Service parts
- 3. Finished goods
Among all categories, the raw materials category is among the largest component, consistently accounting for over 40% of the total inventory.
Tesla’s finished goods inventory ranks as the second-largest category, accounting for approximately 30% of the total inventory.
Tesla defines its finished goods inventory as vehicles in transit to fulfill customer orders, new vehicles available for sale, used vehicles, and energy products available for sale.
As a result, Tesla’s finished goods inventory includes new and used vehicles as well as energy products.
As of the end of fiscal year 2024, Tesla’s finished goods inventory reached nearly $3.9 billion, making it the second-largest inventory component, while raw material inventory stood at $5.2 billion.
Tesla’s substantial number of finished products can be a double-edged sword, with potential benefits and drawbacks for the company.
The advantage of keeping a large amount of finished goods can ensures that products are always available to meet customer demand, especially during peak sales periods.
This can lead to higher customer satisfaction and loyalty, while also protect a business against price increases from suppliers. It locks in costs, providing financial predictability.
The downside to having a bloated finished goods inventory is incurring costs related to storage, insurance, and maintenance. These expenses can reduce the overall profitability of the goods sold.
In addition, money invested in inventory is capital that is not available for other potentially more profitable investments. It can affect the liquidity and the financial flexibility of the business.
Inventory Levels
Tesla quarterly inventory
(click image to expand)
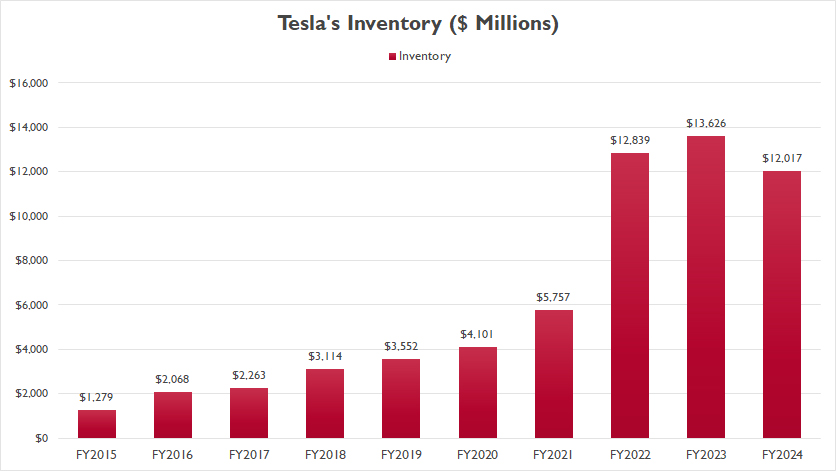
Tesla’s total inventory topped a record high of $13.6 billion in fiscal year 2023, up 6% over fiscal year 2022. In fiscal year 2024, Tesla’s total inventory slipped to $12.0 billion, down 12% or $1.6 billion from a year ago.
On average, Tesla’s total inventory measured $12.8 billion between fiscal year 2022 and 2024.
Since 2015, Tesla’s total inventory has surged by a factor of 10. This dramatic increase reflects the company’s rapid growth and expansion, driven by the escalating demand for electric vehicles and clean energy solutions.
Essentially, Tesla’s decision to expand its inventory to such an extent is backed by solid business rationale. However, some critics argue that this rapid inventory growth might pose risks for the company.
They suggest that Tesla’s inventory may have ballooned to a critical level that could potentially harm the company’s financial health.
Furthermore, the soaring inventory levels might indicate a deceleration in demand for Tesla’s automotive and energy products. So, should we be concerned about Tesla’s rapidly increasing inventory? Find out more as you read on.
Inventory YoY Growth Rates
Tesla inventory YoY growth rates
(click image to expand)
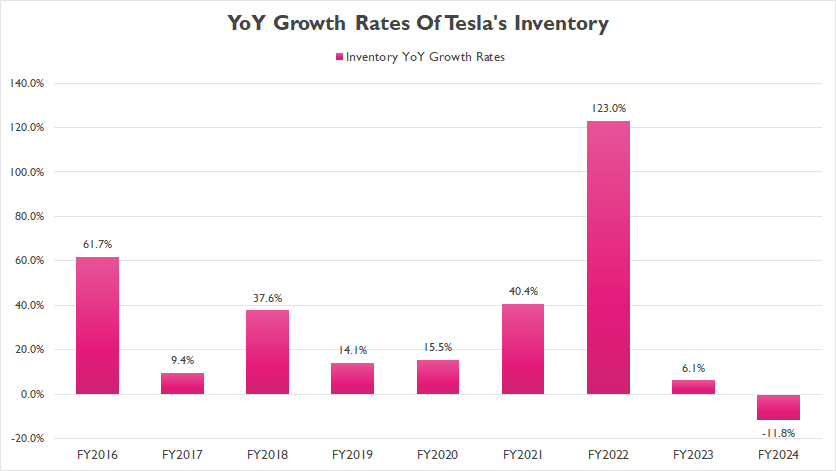
Tesla’s inventory growth has been predominantly positive throughout most fiscal years, as illustrated in the graph above. However, fiscal year 2024 marked a notable shift, as the automaker experienced its first decline, with inventory levels decreasing by 12%.
On average, Tesla’s inventory growth has measured 39% annually between fiscal year 2022 and 2024, with fiscal year 2024 reporting the first decline since 2016. Additionally, in fiscal year 2023, Tesla reported a mere 6% growth in inventory, one of the slowest rates ever recorded.
In short, Tesla’s inventory growth has significantly decelerated since fiscal year 2023. This marked slowdown in inventory growth indicates a shift in the company’s operational dynamics.
The initial rapid expansion might have been fueled by the increasing global demand for clean energy products, but the recent deceleration suggests Tesla is adapting to market changes and optimizing its inventory management.
Inventory By Segment
tesla-inventory-by-segment
(click image to expand)
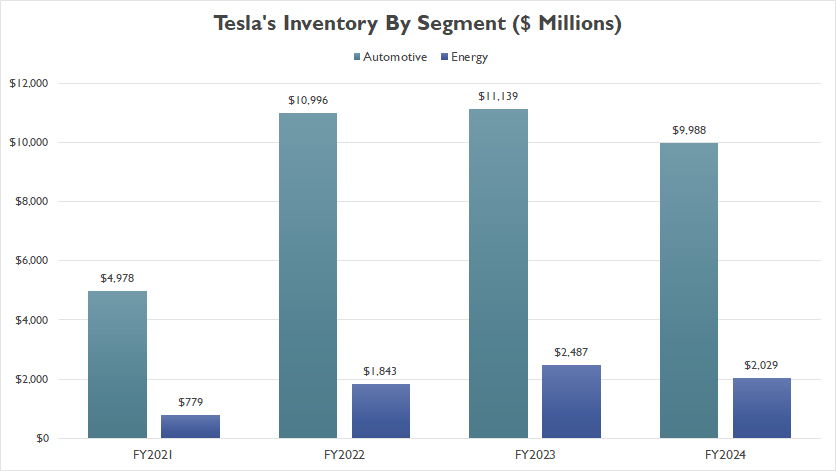
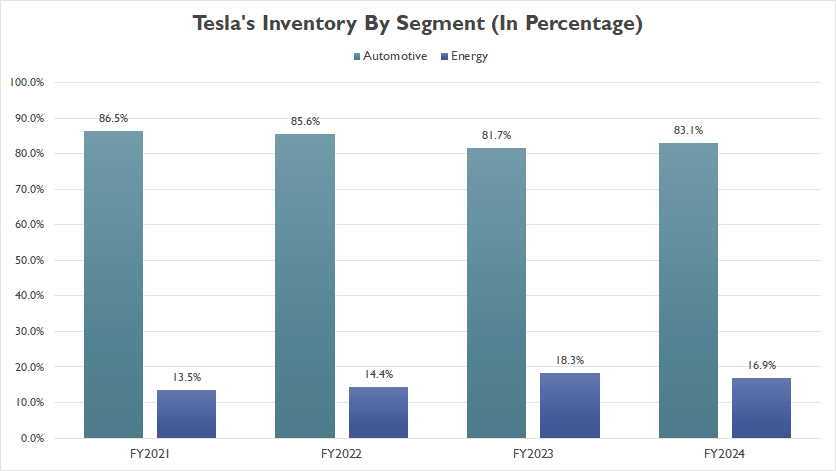
Tesla’s total inventory can be grouped into two segments: automotive and energy, according to the annual reports.
As shown in the graph above, the automotive segment constitutes the bulk of Tesla’s total inventory. By the end of fiscal year 2024, the inventory level in this segment reached an impressive $10 billion.
On the other hand, Tesla’s inventory within the energy segment stood at a modest $2.0 billion in fiscal year 2024, representing only about one-fifth of the automotive segment’s value.
A notable trend is that both segments reported a significant decline in inventory by the end of fiscal year 2024 compared to the previous year.
This reduction in inventory highlights a potential shift in Tesla’s operational strategy, focusing on optimizing stock levels and improving inventory management.
Overall, the significant decline in inventory across both segments underscores Tesla’s commitment to refining its operations, enhancing efficiency, and maintaining a leaner inventory approach.
This trend illustrates the company’s adaptability and focus on sustainable growth in a dynamic market environment.
Inventory By Segment In Percentage
tesla-inventory-by-segment-in-percentage
(click image to expand)
Tesla’s total inventory can be grouped into two segments: automotive and energy, according to the annual reports.
From a percentage perspective, Tesla’s automotive segment inventory has consistently represented over 80% of the total, while the energy segment has accounted for less than 20%.
By the end of fiscal year 2024, the automotive segment inventory made up 83% of the total, whereas the energy segment constituted 17%.
Since fiscal year 2021, the inventory share of the automotive segment has slightly declined, while that of the energy segment has increased. This trend illustrates a gradual shift in Tesla’s inventory composition, reflecting the company’s expanding focus on its energy business.
The increase in the energy segment’s inventory share highlights Tesla’s commitment to growing its clean energy initiatives.
As the world increasingly moves toward sustainable energy solutions, Tesla’s investment in energy products such as solar panels, energy storage systems, and related technologies is becoming more prominent.
This shift underscores the company’s strategic diversification beyond automotive manufacturing and into the broader energy market.
Inventory By Category
tesla-inventory-by-category
(click image to expand)
Tesla’s inventory also can be grouped by category: raw materials, work-in-progress, finished goods, and service parts. The definitions of these categories are available here: work-in-progress inventory and finished-goods inventory.
Of all the components, the raw materials part has accounted for the largest portion, reaching $5.2 billion as of the end of fiscal year 2024.
On the other hand, Tesla’s finished goods inventory has decreased to $3.9 billion by the end of fiscal year 2024 from $5 billion a year ago, making this category the second largest inventory component after raw materials.
Tesla’s work-in-progress and service parts inventory have also increased, but not as much as raw materials and finished goods. Both remained relatively flat in 2024.
Since fiscal year 2015, Tesla’s raw materials inventory has surged at a much faster rate than its finished goods inventory.
This trend illustrates a strategic focus on stockpiling essential components needed for production. By ensuring a robust supply of raw materials, Tesla can maintain production efficiency and quickly respond to manufacturing demands.
The rapid increase in raw materials inventory suggests Tesla’s anticipation of future growth and its commitment to scaling up production capacity.
This proactive approach helps the company mitigate potential supply chain disruptions and ensures it can meet the ever-increasing demand for its products.
In contrast, the relatively slower growth in finished goods inventory indicates that Tesla is effectively managing its production output to align with market demand.
By avoiding excessive build-up of finished goods, Tesla can minimize holding costs and reduce the risk of overstocking.
Overall, the significant rise in raw materials inventory compared to finished goods reflects Tesla’s strategic planning and readiness to capitalize on growth opportunities.
Inventory By Category In Percentage
tesla-inventory-by-category-in-percentage
(click image to expand)
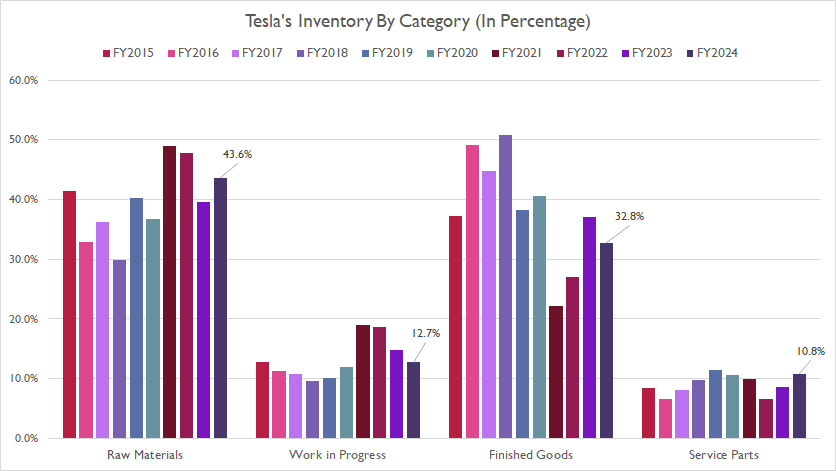
Tesla’s inventory also can be grouped by category: raw materials, work-in-progress, finished goods, and service parts. The definitions of these categories are available here: work-in-progress inventory and finished-goods inventory.
Tesla’s raw materials inventory accounted for 44% of the total by the end of fiscal year 2024, while finished goods inventory represented 33%. Meanwhile, work-in-progress and service parts inventories have each constituted approximately 10% of the total inventory.
A notable trend is that all inventory components have maintained relatively consistent percentage shares throughout most fiscal years, as presented in the chart above.
This consistency has been established despite the significant fluctuations in inventory components that we observed in earlier discussions.
This stability in inventory composition suggests that Tesla has established a balanced approach to managing different types of inventory, ensuring that no single component disproportionately impacts the overall inventory levels.
By maintaining consistent percentage shares across all inventory components, Tesla can better predict inventory needs, manage resources more efficiently, and reduce the risk of overstocking or stockouts.
This balanced approach also allows the company to respond more flexibly to changes in market demand and production schedules.
Overall, the relatively consistent percentage shares of all inventory components demonstrate Tesla’s strategic and disciplined approach to inventory management, contributing to the company’s long-term growth and success.
Total Inventory To Current Assets Ratio
Tesla total inventory to current assets ratio
(click image to expand)
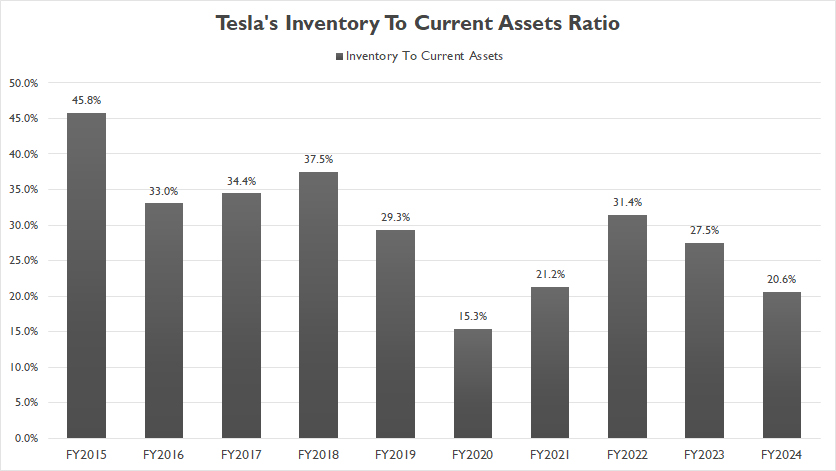
The definition of inventory to current assets ratio is available here: inventory to current assets ratio.
Tesla’s ratio of inventory to current assets has significantly declined since fiscal year 2015, reaching just 21% by the end of fiscal year 2024.
In fiscal year 2015, Tesla’s total inventory accounted for approximately 46% of its current assets. This figure decreased to 28% in fiscal year 2023 and further declined to 21% in fiscal year 2024.
This trend illustrates Tesla’s effective inventory management and improved operational efficiency over the years.
By reducing the proportion of inventory relative to current assets, Tesla has managed to optimize its working capital and enhance liquidity.
This improvement allows the company to allocate resources more effectively, invest in growth opportunities, and better withstand market fluctuations.
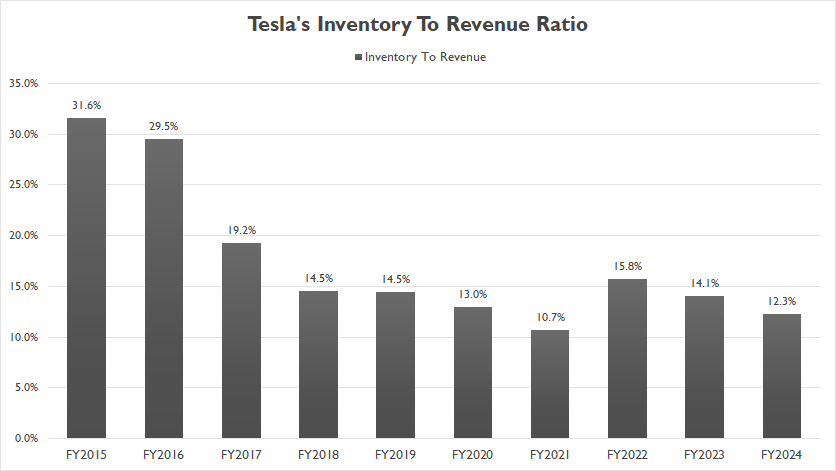
Total Inventory To Revenue Ratio
Tesla total inventory to revenue ratio
(click image to expand)
The definition of inventory to revenue ratio is available here: inventory to revenue ratio.
Similar to the ratio of inventory to current assets, Tesla’s ratio of inventory to revenue has also experienced a similar decline over the years.
Since fiscal year 2015, Tesla’s ratio of inventory to revenue has decreased by more than half, dropping from 32% in 2015 to only 12% as of the end of fiscal year 2024.
The decline in the inventory-to-revenue ratio indicates that Tesla has been able to generate more revenue with relatively lower inventory levels.
In aother words, Tesla has been managing its inventory more efficiently relative to its revenue. This means that the company is able to convert its inventory into sales more quickly, reducing the amount of capital tied up in unsold goods.
Additionally, the lower inventory to revenue ratio also means that Tesla can generate more revenue with less inventory, which improves cash flow.
This enhanced liquidity allows the company to invest in growth opportunities, research and development, and other strategic initiatives without being burdened by excessive inventory costs.
Conclusion
In summary, since fiscal year 2021, the automotive segment’s inventory share has slightly declined, while the energy segment’s share has increased. This trend illustrates Tesla’s expanding focus on its energy business.
Additionally, all of Tesla’s inventory components have maintained relatively consistent percentage shares throughout most fiscal years, demonstrating a balanced approach to inventory management.
Overall, the tenfold increase in Tesla’s total inventory since 2015 highlights the company’s ambitious growth strategy and its commitment to meeting the rising demand for sustainable energy solutions.
References and Credits
1. All financial figures presented were obtained and referenced from Tesla’s annual report published on the company’s investor relations page: Tesla Investor Relations.
2. Flickr Images.
Disclosure
We may utilize the assistance of artificial intelligence (AI) tools to produce some of the text in this article. However, the data is directly obtained from original sources and meticulously cross-checked by our editors multiple times to ensure its accuracy and reliability.
If you find the information in this article helpful, please consider sharing it on social media. Additionally, providing a link back to this article from any website can help us create more content like this in the future.
Thank you for your support and engagement! Your involvement helps us continue to provide high-quality, reliable content.

An inventory checklist is always important to an interlining supplier. This checklist will help interlining suppliers understand how many raw materials they need to orders for the interlining products such as woven interlining, non-woven interlining and fusible interlining. However, the level of inventory to be ordered is not the same in each ordering period. You should pay attention to the market change in the interlining industry.