
Tesla supercharger rally. Flickr Image.
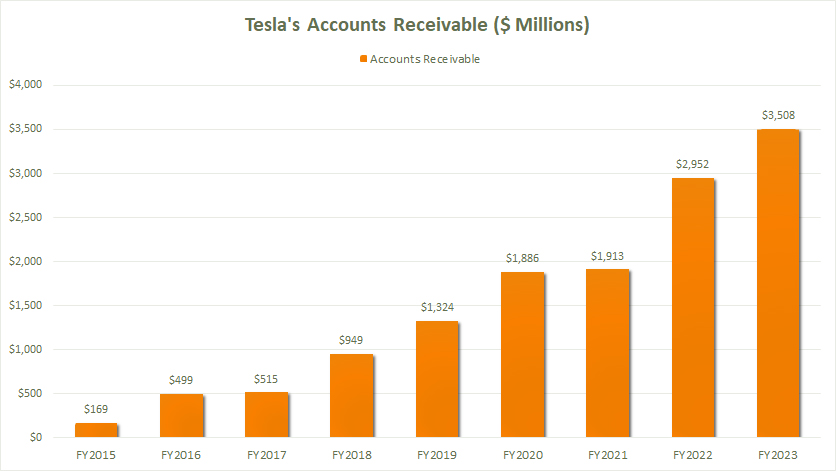
Tesla’s accounts receivable have been growing steadily, reflecting the company’s expanding operations. For example, as of Dec 31, 2023, Tesla’s accounts receivable stood at $3.5 billion, a 19% increase year-over-year.
Efficient management of accounts receivable is crucial for maintaining healthy cash flow and ensuring the company can meet its short-term obligations.
This article explores the accounts receivable of Tesla and the related ratios:
- Accounts Receivable to Sales Ratio: This ratio helps assess the proportion of sales made on credit.
- Accounts Receivable Turnover Ratio: Measures how efficiently Tesla collects cash from credit sales.
- Days Sales Outstanding (DSO): Indicates the average number of days it takes for Tesla to collect payment after a sale
Please use the table of contents to navigate this page.
Table Of Contents
Definitions And Overview
- Accounts Receivable to Sales Ratio
- Accounts Receivable to Current Assets Ratio
- Accounts Receivable Turnover Ratio
- Days Sales Outstanding (DSO)
Breakdown Of Accounts Receivables
A1. Key Items In Tesla’s Accounts Receivable
Accounts Receivables
As A Percentage Of Revenue And Current Assets
A3. Accounts Receivable To Sales Ratio
A4. Accounts Receivable To Current Assets Ratio
Sales On Credit
Accounts Receivable Ratios
A6. Accounts Receivable Turnover Ratio
A7. Days Sales Outstanding
Conclusion And Reference
S1. Conclusion
S2. References and Credits
S3. Disclosure
Definitions
To help readers understand the content better, the following terms and glossaries have been provided.
Accounts Receivable To Sales Ratio: The Accounts Receivable to Sales Ratio is a financial metric indicating the proportion of a company’s sales made on credit. It provides insight into how much of the company’s revenue is tied up in accounts receivable, which can affect cash flow and liquidity. Here’s how it is calculated:
Accounts Receivable to Sales Ratio = Accounts Receivable / Total Sales
High Ratio: A higher ratio suggests that a significant portion of sales is made on credit, which could indicate potential challenges in cash collection or lenient credit policies.
Low Ratio: A lower ratio implies that most sales are made on a cash basis or that the company is efficient in collecting payments from customers.
Accounts Receivable To Current Assets Ratio: The Accounts Receivable to Current Asset Ratio is a financial metric measuring the proportion of a company’s accounts receivable relative to its total current assets.
This ratio helps assess how much of the company’s liquid assets are tied up in receivables, which can affect liquidity and cash flow management. Here’s how it is calculated:
Accounts Receivable to Current Asset Ratio = Accounts Receivable / Total Current Assets
High Ratio: Indicates that a significant portion of the company’s current assets are in accounts receivable, which might suggest potential liquidity issues if those receivables are not collected promptly.
Low Ratio: Implies that a smaller portion of current assets is tied up in receivables, indicating better liquidity and cash flow management.
Accounts Receivable Turnover Ratio: The Accounts Receivable Turnover Ratio is a financial metric measuring how efficiently a company collects its accounts receivable, indicating how many times the company converts its receivables into cash during a specific period.
This ratio is crucial for assessing the effectiveness of a company’s credit policies and collection practices. Here’s how it is calculated:
Accounts Receivable Turnover Ratio = Net Credit Sales / Average Accounts Receivable
Where:
- Net Credit Sales: Total sales made on credit, excluding returns and allowances.
- Average Accounts Receivable: The average of the beginning and ending accounts receivable for the period.
High Ratio: Indicates that the company is efficient in collecting its receivables and has effective credit policies. It suggests strong liquidity and good cash flow management.
Low Ratio: Suggests potential issues in collecting receivables, possibly due to lenient credit terms, ineffective collection practices, or financial difficulties of customers.
Days Sales Outstanding (DSO): Days Sales Outstanding (DSO) is a financial metric measuring the average number of days a company takes to collect payment after making a sale. It’s a key indicator of a company’s efficiency in managing its accounts receivable. Here’s how DSO is calculated and why it matters:
DSO = ( Accounts Receivable / Total Credit Sales ) × Number of Days
Where: Number Of Days = Number Of Work Days Per Year = 365
Lower DSO: Indicates that the company collects its receivables quickly. This is generally seen as positive, as it implies better cash flow management and fewer outstanding customer debts.
Higher DSO: Suggests that the company takes longer to collect its receivables, which could indicate issues with credit policies or customer payment behaviors. This can lead to cash flow challenges.
DSO can vary significantly across different industries due to varying credit terms and payment cycles. It’s essential to compare a company’s DSO to industry benchmarks for a more accurate assessment.
Key Items In Tesla Accounts Receivable
Tesla’s accounts receivable is a key asset on the balance sheet, representing the amount of money owed to the company by its customers for goods and services sold on credit. Here’s a closer look at the componenents of Tesla’s accounts receivable:
- Amounts related to sales of powertrain systems.
- Sales of energy generation and storage products.
- Receivables from financial institutions and leasing companies offering various financing products to Tesla customers.
- Sales of regulatory credits to other automotive manufacturers.
- Maintenance services on vehicles owned by leasing companies.
- Government rebates already passed through to customers.
Tesla mentioned that the company does not carry significant accounts receivable related to vehicle sales as customer payments are normally due prior to vehicle delivery. As a result, most transactions related to vehicle sales are cash transactions.
Nevertheless, some receivables do come from vehicle sales but the amounts are not expected to be significant. For example, Tesla should receive the cash immediately for approved transaction between Tesla’s customers and the financial institutions.
It may take only a couple of days for Tesla to get these payments when the customers opt for a loan to buy the company products. Here is a quote from the 2023 annual report regarding accounts receivable on vehicle sales.
- “Depending on the day of the week on which the end of a fiscal quarter falls, our accounts receivable balance may fluctuate as we are waiting for certain customer payments to clear through our banking institutions and receipts of payments from our financing partners, which can take up to approximately two weeks based on the contractual payment terms with such partners.”
However, for other products such as regulatory credits sales and goverment rebates, Tesla may take a longer time to collect the payments as reflected in the following quote by the company.
- “Our accounts receivable balances associated with our sales of regulatory credits are dependent on contractual payment terms. Additionally, government rebates can take up to a year or more to be collected depending on the customary processing timelines of the specific jurisdictions issuing them.”
Tesla Accounts Receivable Results
tesla-accounts-receivable
(click image to expand)
Tesla’s accounts receivable has significantly risen since 2015, reaching a notable milestone of $3.5 billion as of the end of fiscal year 2023. Tesla’s accounts receivable of $3.5 billion in 2023 was 19% higher from a year ago or nearly triple the amount in 2019.
The impressive growth in Tesla’s accounts receivable has been driven primarily by business expansion. As Tesla’s revenue grows, so do the accounts receivable.
Accounts Receivable to Sales Ratio
tesla-accounts-receivable-to-revenue-ratio
(click image to expand)
The definition of Tesla’s accounts receivable to sales ratio is available here: accounts receivable to sales ratio. A higher percentage of the ratio indicates that more sales are made on credit.
Moreover, an increasing ratio could potentially lead to short-term liquidity problem since most revenues are tied up in accounts receivable, thereby slowing down the cash conversion cycle for the company.
Nevertheless, Tesla’s accounts receivable to sales ratio has remained relatively modest, topping just 3.6% as of the end of fiscal year 2023. On average, Tesla’s accounts receivable to sales ratio has measured at just 4% between 2021 and 2023.
At only 4% of revenue, Tesla’s accounts receivable doesn’t seem to post any threat to the company’s liquidity, as most sales are done in cash transactions, as stated by the company in this section: Tesla’s accounts receivable key items.
Accounts Receivable To Current Asset Ratio
tesla-accounts-receivable-to-current-assets-ratio
(click image to expand)
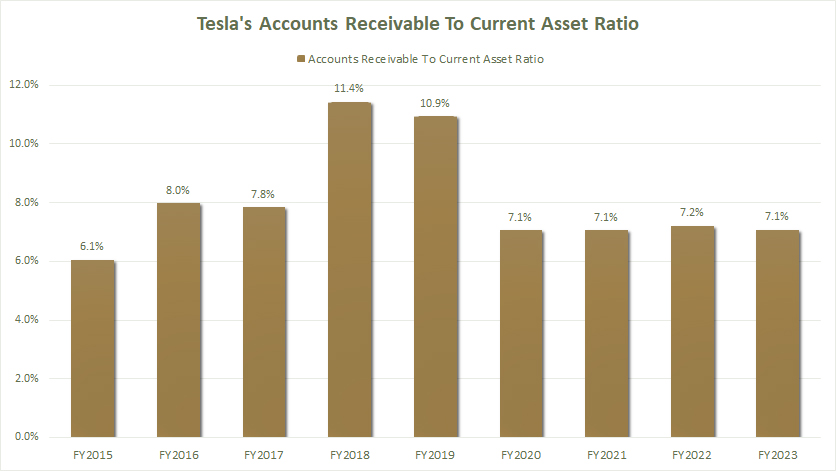
The definition of Tesla’s accounts receivable to current assets ratio is available here: accounts receivable to current assets ratio. This ratio measures how much working capital is locked up in account receivables, as current assets equal working capital.
A high ratio indicates too much working capital being tied up in accounts receivable. This may lead to less cash available to the company and trigger a liquidity crisis.
Nevertheless, Tesla does not seem to have high accounts receivable with respect to its current assets, as shown in the chart above. At a ratio of just 7% in fiscal year 2023, Tesla’s accounts receivable looks reasonably modest with regard to the current assets.
On average, Tesla’s accounts receivable to current assets ratio has averaged 7% between fiscal year 2021 and 2023, which is much lower than the ratio recorded pre-pandemic.
Again, Tesla’s modest accounts receivable to current assets ratio indicates that the accounts receivable does not seem to pose any threat to the company’s short-term liquidity.
Tesla Credit Sales
tesla-credit-sales
(click image to expand)
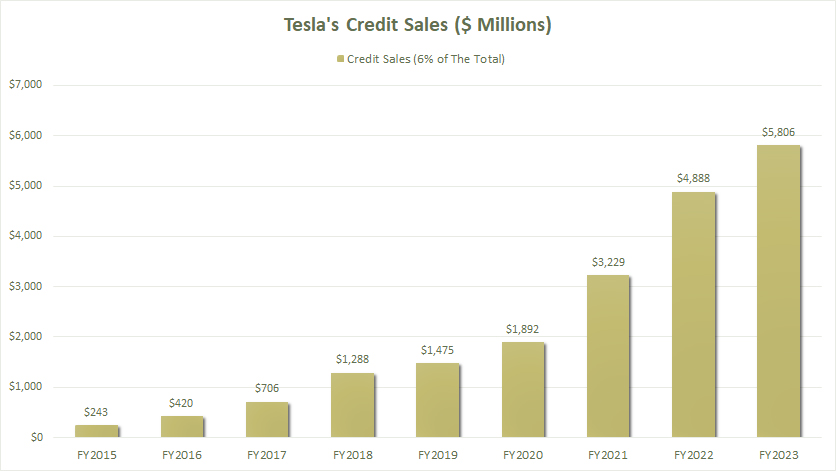
To measure Tesla’s accounts receivable turnover ratio and days sales outstanding, we need to find out Tesla’s sales done on credit. In this section, we assumed that roughly 6% of Tesla’s revenue is earned on credit.
At 6% credit sales, that equals to about $5.8 billion in revenue for fiscal year 2023. This amount looks fairly reasonable as Tesla earned about $98 billion in total revenue in fiscal year 2023.
Tesla also mentioned that the company does not do a lot of credit sales as most transactions on vehicle sales are paid in cash, as seen in this section: Tesla’s accounts receivable key items.
Accounts Receivable Turnover Ratio
tesla-accounts-receivable-turnover-ratio
(click image to expand)
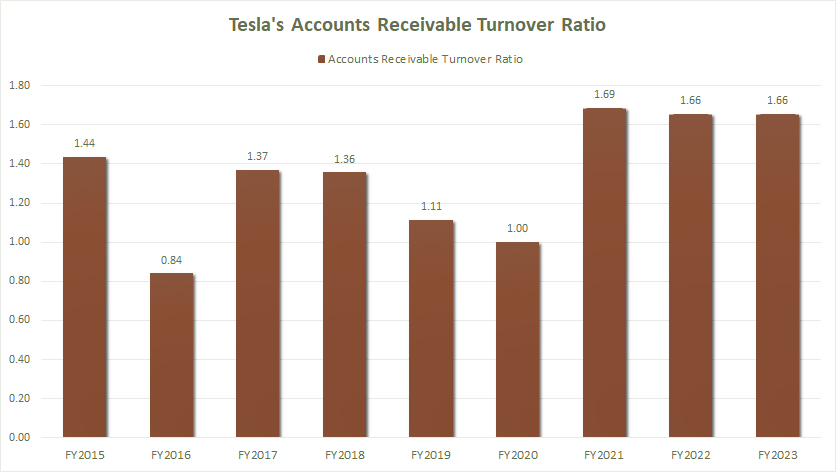
The definition of Tesla’s accounts receivable turnover ratio is available here: accounts receivable turnover ratio. A higher ratio indicates that the company is more efficient at collecting payments.
With a credit sales of 6%, Tesla can only collects its payment by 1.67 time in a year, as reflected by the 1.67X accounts receivable turnover ratio in fiscal year 2023. On average, Tesla’s accounts receivable turnover ratio has measured at 1.67X between fiscal year 2021 and 2023.
This number looks reasonable as Tesla has menioned that it can takes up to a year to collect payments, particularly for transactions related to government rebates and regulatory credits.
Tesla’s Days Sales Outstanding
tesla-days-sales-outstanding
(click image to expand)
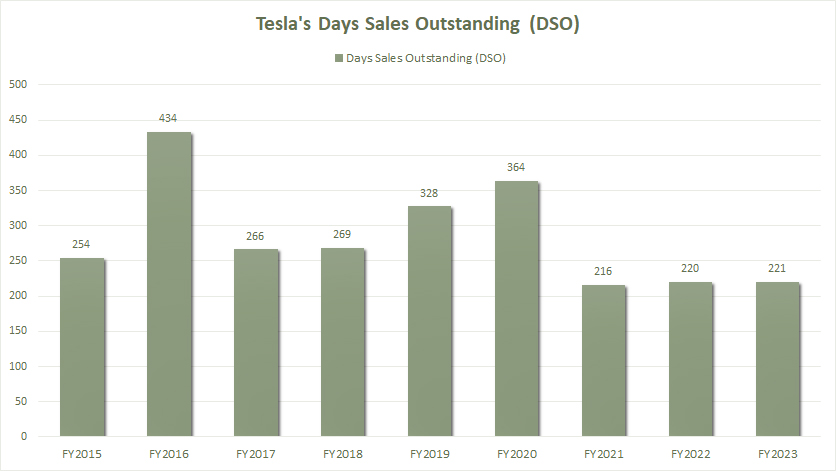
The definition of Tesla’s days sales outstanding (DSO) is available here: days sales outstanding. A lower ratio indicates that the company is more efficient at collecting payments, as it takes fewer days to collect the money.
Similarly, Tesla is slow in collecting payments, as reflected by the high days sales outstanding number in the chart above. Tesla can take up to 221 days or 7 months to collect its money.
On average, Tesla’s days sales outstanding has measured at 219 days between fiscal 2021 and 2023. However, this figure has significantly improved in recent years, as shown in the chart above. Before the pandemic prior to 2020, Tesla took up to a year or 365 days to collect its payments.
Summary
Tesla keeps its accounts receivable small in order to improve liquidity or cash position. Tesla’s accounts receivable in 2023 made up just 3.6% of revenue and 7% of current assets, which were relatively modest.
Tesla is slow in collecting its payments, taking up to 7 months on average between 2021 and 2023, when assuming that 6% of revenue is done on credit.
This number is expected as the company has mentioned that revenue related to regulatory credits and government rebates is slow to come by and can take up to 1 year or more.
References and Credits
1. All financial figures in this article are obtained and referenced from Tesla’s annual reports which can be found in: Tesla Investor Relations.
2. Flickr Images.
Disclosure
References and examples such as tables, charts, and diagrams are constantly reviewed to avoid errors, but we cannot warrant the full correctness of all content.
The content in this article is for informational purposes only and is neither a recommendation nor a piece of financial advice to purchase a stock.
If you find the information in this article helpful, please consider sharing it on social media and also provide a link back to this article from any website so that more articles like this one can be created in the future.
Thank you!


“My opinion is that the accounts receivable for vehicle sales should mostly come from payments owed by financial institutions for approved financing arrangements between Tesla’s customers and the financial institutions. It may take only a couple of days for Tesla to get these payments when the customers opt for a loan to buy the company products.”
Tesla does not have a financing subsidiary like most auto manufactures and sells its vehicles directly not through dealerships. If you look at the balance sheets of the major dealership groups, like the two largest, AutoNation Inc. and Penske Automotive Group you will also find high account receivables. AutoNation’s Q2 2020 10-Q shows receivables equal to 13.5 calendar (not sales) days of average revenue and 19.1% of current assets. Penske’s Q1 10-Q, 11.2 days and 11.4%.
The reason for the high receivables is because it takes far more than a couple of days for dealers in the United States to receive the proceeds of loans from financial institutions that are financing auto purchases. This is so big a thing for auto dealers that they have a special type of accounts receivable just for it called “Documents in Transit”. Before a lender will make the payment it must be in possession of the vehicle title and lien (the lien is printed on the title). For a new vehicle the process starts with the dealer presenting a Manufacturer’s Certificate of Origin, a paper document (although often machine readable), to a state motor vehicle agency. Even in the best of times these agencies are not terribly quick. Dealers do get preferential treatment but still face long waits. During the COVID emergency the DMV situation got much worse. Here in Connecticut the current wait time for the DMV to issue a title for dealers using its online system is 21 days. There are many states that now use an electronic lien title system that transmits the lien and title to the lender overnight. In the other states the titles are mailed. Once the lender has the title and lien, only then is the payment made. In the old days that payment was made by check printed overnight and mailed the next business day but these days it may be electronic.
I know something about this because I supported accounting systems for dealership associations in the 1970s and was the lead developer for a bank that was a major issuer of auto loans of the pilot Electronic Lien Transfer System with a state DMV in the 1990s.