People. Source: Flickr
This article explores and compares the profit margins of social media giants such as Meta Platforms, Twitter, Snap Inc., and Pinterest.
We will look at the gross margin, operating margin, net profit margin, and EBITDA margin of these companies.
In general, margins indicate the profitability of a company. Therefore, the larger the margin, the higher the profit of the company is.
Besides, margins can be compared across companies that operate in the same industry and adopt the same accounting standard.
Typically, companies with a better margins tend to perform better in the long run, not just in stock prices but also in capital returns, which includes cash dividends and share buybacks, if there is any.
For example, Meta Platform has recently initiated a cash dividend. The social media giant also has been buying back its shares over the last several years. For your information, Meta Platform has one of the best margins within its sector.
Without further delay, let’s take a look!
You may find related statistic of social media companies on these pages:
Please use the table of contents to navigate this page.
Table Of Contents
Overview
O2. Why Are Social Media Companies Making So Much Money?
Profit Margins
A1. Gross Margin
A2. Operating Margin
A3. Net Profit Margin
A4. Adjusted EBITDA Margin
Summary And Reference
S1. Insight
S2. References and Credits
S3. Disclosure
Definitions
To help readers understand the content better, the following terms and glossaries have been provided.
Gross Margin: Gross margin is a financial metric representing the percentage of revenue exceeding the cost of goods sold (COGS). It is calculated by subtracting the COGS from the total revenue and dividing the result by the total revenue.
The gross margin indicates how much money a company has left over after accounting for the direct costs of producing its products or services. It is an important measure of a company’s profitability and efficiency in managing its production costs.
Operating Margin: Operating profit margin is a financial metric that measures the percentage of revenue that remains after deducting all operating expenses, such as salaries, rent, and utilities, but before deducting interest and taxes.
The operating profit margin indicates how much profit a company generates from its core business operations, and it is a key indicator of its operational efficiency and profitability. A higher operating profit margin indicates that a company can generate more profit from its operations, which can be reinvested in the business or distributed to shareholders.
Net Profit Margin: Net profit margin is a financial metric that measures the percentage of revenue that remains after deducting all expenses, including operating expenses, interest, taxes, and other non-operating expenses.
The net profit margin indicates how much profit a company generates from its total revenue and is a key indicator of its profitability. A higher net profit margin means that a company can generate more profit from its revenue, which can be used for reinvestment, expansion, or distribution to shareholders.
EBITDA Margin: EBITDA margin is a financial metric that measures a company’s profitability by calculating its earnings before interest, taxes, depreciation, and amortization (EBITDA) as a percentage of its total revenue.
The EBITDA margin is a useful measure of a company’s operating profitability. It shows how much cash flow a company generates from its core business operations without the impact of non-operating expenses such as interest and taxes. A higher EBITDA margin indicates that a company is generating more cash flow from its operations, which can be used for reinvestment, debt reduction, or distribution to shareholders.
Why Are Social Media Companies Making So Much Money?
Social media companies make a significant amount of money primarily because they have access to vast amounts of user data, which they can use to sell targeted advertising. These platforms engage millions of users daily, providing an ideal audience for businesses looking to promote their products or services.
Social media platforms usually have a lot of users, and these users are heavily engaged and targeted. Therefore, they are extremely valuable to advertisers. Here are a few key reasons why social media companies are so profitable:
- **Targeted Advertising**: Social media platforms collect data on users’ interests, behaviors, and demographics, which allows advertisers to target their ads very specifically. This increases the chances of user engagement with the ads, making advertising on social media more effective and, therefore, more valuable.
- **Large User Base**: Social media companies have billions of users worldwide, offering advertisers a vast audience. This global reach is incredibly attractive to businesses of all sizes.
- **User Engagement**: Social media is designed to be addictive. Features like infinite scrolling, notifications, and personalized content keep users engaged for longer periods. Social media users usually spend more time on the platforms, thereby increasing the ads shown. As a result, there will be more revenue for social media companies.
- **Diverse Revenue Streams**: While advertising is the primary source of revenue, many social media companies have diversified. They offer premium memberships, virtual goods, marketplace transactions, and other services to generate additional income.
- **Cost-Effectiveness**: Digital advertising offers a better return on investment than traditional media. For advertisers, the ability to measure the effectiveness of their ads in real-time allows for better budget allocation and strategy adjustments, making social media an attractive platform for advertising.
In summary, the combination of targeted advertising capabilities, a large and engaged user base, and diversified revenue streams enable social media companies to generate significant profits.
Gross Margin
Meta, Twitter, Snap and Pinterest’s gross margin comparison
(click image to expand)
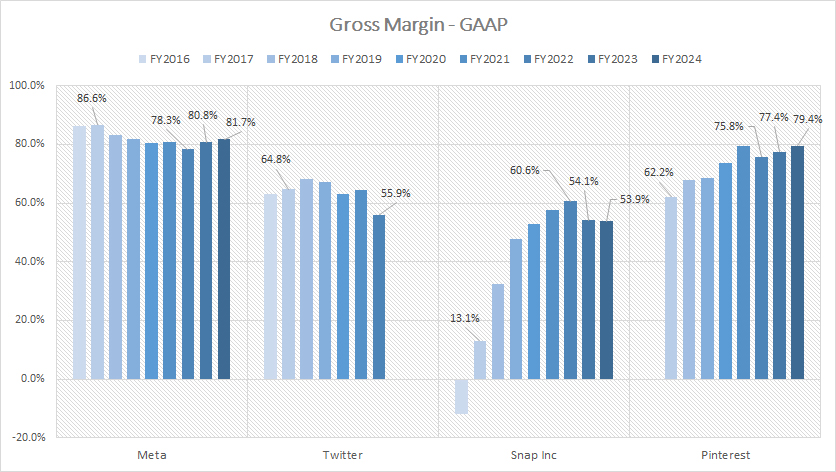
The definition of gross margin is available here: gross margin. The majority of social media companies generate revenue by selling advertising space on their platforms.
Therefore, the gross margin for social media companies is a measurement of the direct costs of providing advertisement services to customers.
From the first look of the chart above, Meta commands the highest gross margin among all social media companies compared, generating as much as 80% of gross margin between fiscal year 2022 and 2024.
Despite being the most profitable, the gross margin of Meta Platforms has slightly gone lower since 2016, down from 86% in 2016 to 82% as of 2024.
The decline in the gross margin of Meta Platforms over the years highlights the company’s struggle to manage its costs and maintain its profitability in the face of increasing competition and changing market dynamics.
On the contrary, Snap’s gross margin has expanded the fastest, despite being relatively new in the social media space. As of fiscal 2024, Snap’s gross margin reached 54%, up significantly from the negative result in 2016.
Pinterest’s gross margin is not that far behind, reaching as much as 79% as of fiscal year 2024, second only to Meta. Similar to Snapchat, Pinterest’s gross margin has been on a tear, highlighting the company’s remarkable growth over the years.
Twitter’s gross margin is the lowest among all social media companies compared and has remained relatively stagnant since 2016.
As of 2022, Twitter’s gross margin totaled only 55.9%, a significant decline over 2021.
Operating Margin
Meta, Twitter, Snap and Pinterest’s operating margin comparison
(click image to expand)
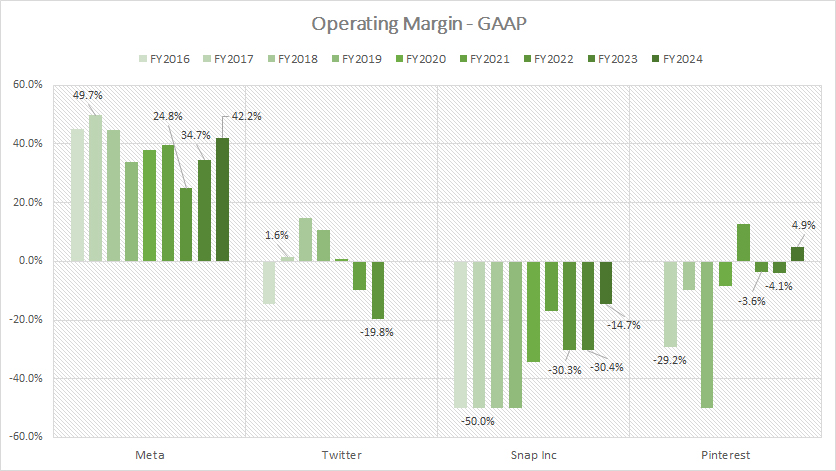
The definition of operating margin is available here: operating margin. Again, Meta Platforms leads the pack when it comes to operating efficiency, as reflected by its impressive operating margins.
As presented in the chart, Meta Platforms’ operating margin topped at an impressive 42% as of fiscal year 2024, the highest among all social media companies compared.
Despite being a leading social media company, Meta’s profitability has modestly declined since 2016, as reflected by the decreasing operating margin which has gone down from the peak of nearly 50% in 2017 to 42% as of 2024.
A key observation is that most social media companies have operated at a loss, as shown by the negative operating margins in most periods. For example, Snap Inc., with an operating margin of -15% in fiscal year 2024, was still operating at a loss, despite having been incurring negative operating losses since 2016.
Twitter’s profitability has also significantly tumbled, with its operating margin plummeting to -19.8% in 2022 compared to -9.7% in the previous year.
On the contrary, Pinteres’ operating margin turned to a positive figure of 5% in fiscal year 2024 from -4% in 2023, marking a turnaround from an unprofitable operation to a profitable one. Pinterest is most likely a rare germ in the social media space.
Nevertheless, the poor operating margins of Twitter, Snapchat, and Pinterest illustrate the huge operating expenses incurred by these companies, due primarily to research and development expenses, as presented in this article, Meta R&D Vs. Snap, Twitter, And Pinterest.
In summary, the substantial operating expenses incurred by most social media companies are the primary drivers of their operating losses.
Net Profit Margin
Meta, Twitter, Snap and Pinterest’s net profit margin comparison
(click image to expand)
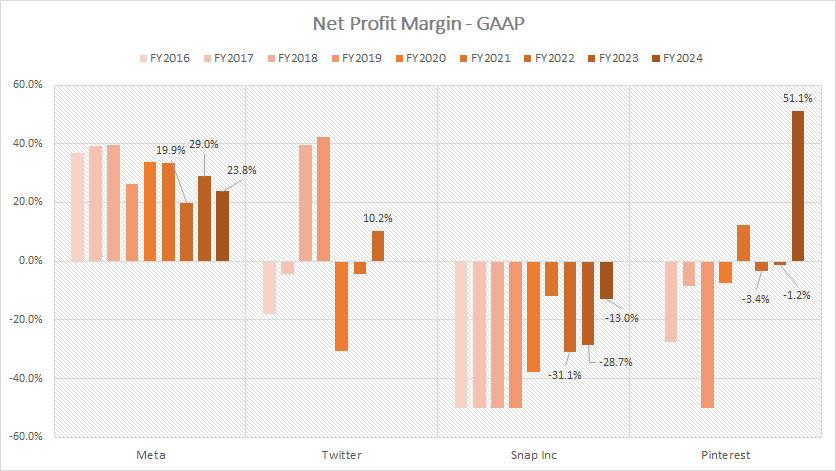
The definition of net profit margin is available here: net profit margin. Similar to the operating margin, Meta Platforms appears to be the only profitable social media company from the perspective of the net profit margin.
As shown in the chart above, Meta Platforms generated an average of 24% of net profit margin between fiscal year 2022 and 2024, while other social media companies such as Twitter, Snapchat, and Pinterest generated mostly negative net profit margins.
Pinterest’s remarkable net profit margin of 51% in 2024 was primarily attributed to a one-time income tax benefit, a non-recurring event.
In fiscal year 2024, Meta’s net profit margin was down to 24% from 29% in 2023, but represented a considerable rise from the 20% in 2022.
Although Meta’s profitability leads all social media companies presented, its net profit margin has significantly declined since 2016, from close to 40% in 2016 to 24% as of 2024.
Pinterest’s net profit margin fell to -1% in 2023, while Snap’s result tumbled to -29% in the same period, and it incurred a smaller loss in 2024 at a net profit margin of -13%.
Surprisingly, Twitter recorded a positive net profit margin of 10.2% in fiscal 2022, fueled by a gain on the sale of asset group totaling nearly US$1 billion.
Despite being unprofitable in most fiscal years, Pinterest looked promising when its net profit margin surged to 12.3% in fiscal 2021. However, Pinterest’s net profit margin declined to -3.4% in fiscal year 2022 and -1.2% in 2023, causing the company to become unprofitable 2 years in a row.
Adjusted EBITDA Margin
Twitter, Snap and Pinterest’s EBITDA margin comparison
(click image to expand)
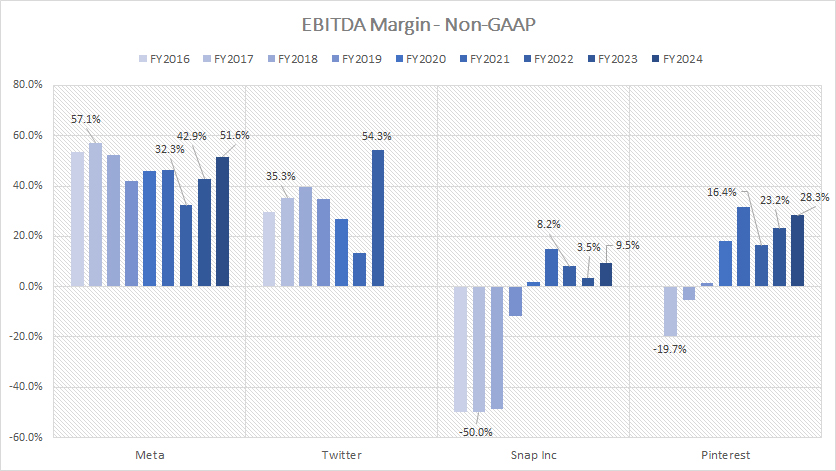
The definition of EBITDA margin is available here: EBITDA margin. Meta Platforms generates one of the highest EBITDA margin among all social media companies, averaging 42% over the last 3 years.
On the other hand, Snap’s EBITDA margin lags significantly behind that of Meta, coming in at just 9.5% in fiscal year 2024, and averaged around 7% from fiscal year 2022 to 2024.
Twitter logged a significantly higher adjusted EBITDA margin in fiscal year 2022, reaching 54%, while Pinterest’s figure reached 28% in fiscal year 2024.
Twitter produced positive EBITDA results in all fiscal years between 2016 and 2022, illustrating the company’s solid cash earnings generation. On the other hand, Snapchat and Pinterest have only produced positive adjusted EBITDA margin over recent periods.
The continuous positive EBITDA margins demonstrate notable improvements in the cash earnings of Snap and Pinterest, highlighting the strong potential of these social media companies, especially Pinterest, to sustain positive cash earnings in the future.
Among all social media companies compared, Pinterest looks the most promising, as its adjusted EBITDA margin has been the most consistent and rising over the past three years.
Insight
Together, these examples reflect both the complexities and opportunities inherent in the social media industry. Companies must balance high operational costs while leveraging unique financial advantages to achieve sustainable growth. Meta and Pinterest’s performance could serve as a benchmark for other players navigating these challenges.
References and Credits
1. All financial figures presented were obtained and referenced from the quarterly and annual reports published on the companies respective investor relations pages:
a) Meta Investor Relations
b) Pinterest Investor Relations
c) Twitter Investor Relations
d) Snap Investor Relations
2. Pixabay Images.
Disclosure
We may use artificial intelligence (AI) tools to assist us in writing some of the text in this article. However, the data is directly obtained from original sources and meticulously cross-checked by our editors multiple times to ensure its accuracy and reliability.
If you find the information in this article helpful, please consider sharing it on social media. Additionally, providing a link back to this article from any website can help us create more content like this in the future.
Thank you for your support and engagement! Your involvement helps us continue to provide high-quality, reliable content.


