Grilling plant-based meat. Flickr Image.
This article presents Beyond Meat’s revenue and profit margin. In addition, we also cover Beyond Meat’s revenue breakdown by segment.
Beyond Meat’s business segments consist of two channels: Retail and Foodservice.
Let’s look at the numbers!
For other key statistics of Beyond Meat, you may find more information on these pages:
Sales
Revenue
- Revenue by region: U.S. and International,
Profit & Margin
Debt & Cash
- Financial health: total debt, payment due, and liquidity,
- Cash flow and cash on hand analysis,
- Liquidity check,
R&D & Advertising
Other Statistics
Please use the table of contents to navigate this page.
Table Of Contents
Overview And Definitions
- Net Revenues
- Adjusted EBITDA
- U.S. Retail
- U.S. Foodservice
- International Retail
- International Foodservice
O2. How does Beyond Meat earn revenue?
O3. Beyond Meat Business Model
Consolidated Results
A1. Net Revenue
Profit And Margins
C1. Gross Profit, Operating Profit, and Adjusted EBITDA
C2. Gross Margin, Operating Margin, and Adjusted EBITDA Margin
Revenue By Segment
D1. Retail and Foodservice Revenue
D2. Retail and Foodservice Revenue In Percentage
D3. Retail and Foodservice Revenue YoY Growth Rates
Conclusion And Reference
S1. Insight
S2. References and Credits
S3. Disclosure
Definitions
To help readers understand the content better, the following terms and glossaries have been provided.
Net Revenues: According to Beyond Meat, it routinely offers sales discounts and promotions through various programs to customers and consumers. These programs include rebates, temporary on-shelf price reductions, off-invoice discounts, retailer advertisements, product coupons and other trade activities.
It anticipates that over time it will need to continue to offer more trade and promotion discounts to both retail and foodservice customers, to drive increased consumer trials and in response to changing consumer and customer behavior and increased competition and pressure on the plant-based meat category.
The expense associated with these discounts and promotions is estimated and recorded as a reduction in total gross revenues in order to arrive at reported net revenues.
Adjusted EBITDA: Beyond Meat defines the adjusted EBITDA as net loss/income adjusted to exclude, when applicable, income tax expense, interest expense, depreciation and amortization expense, restructuring expenses, share-based compensation expense, and Other, net, including interest income and foreign currency transaction gains and losses, according to its earnings releases.
EBITDA stands for Earnings Before Interest, Taxes, Depreciation, and Amortization. It is a financial metric commonly used to evaluate a company’s operating profitability by calculating its earnings before accounting for non-operating expenses such as interest payments, taxes, depreciation, and amortization.
EBITDA is often used to measure a company’s overall financial performance because it provides a clearer picture of its ability to generate cash flow from its core operations.
U.S. Retail: Beyond Meat defines its U.S. retail sales as net revenues from retail sales to the U.S. market and, sales to TPP, its joint venture with PepsiCo, Inc.
U.S. Foodservice: Beyond Meat defines its U.S. foodservice sales as net revenues from restaurant and foodservice sales to the U.S. market.
International Retail: Beyond Meat defines its international retail sales as net revenues from retail sales to international markets, including Canada.
International Foodservice: Beyond Meat defines its international foodservice sales as net revenues from restaurant and foodservice sales to international markets, including Canada.
How does Beyond Meat earn revenue?
Beyond Meat generates revenue through several streams focusing on selling its diverse product lineup. These revenue streams include:
-
Retail Sales: Beyond Meat sells its products in supermarkets, grocery stores, and other retail outlets. This category includes frozen and refrigerated plant-based meat products, such as burgers, sausages, and ground meat alternatives. Retail sales constitute a significant portion of the company’s revenue, making its products accessible to consumers who want to cook at home.
-
Food Service Sales: Beyond Meat partners with restaurants, fast food chains, and other food service establishments to offer plant-based meat products on their menus. This stream includes sales to both large national chains and independent local operators. The company’s ability to penetrate the food service sector allows it to tap into the dining-out market, potentially increasing its product adoption and brand recognition.
-
International Sales: Beyond Meat has expanded its presence in international markets, including Europe, Asia, and Canada. International sales contribute to the company’s revenue streams by offering its products through retail and food service channels in these regions. The expansion into global markets is a strategic move to capitalize on the growing international demand for plant-based foods.
-
Product Diversification: Beyond Meat continuously innovates and expands its product range to include new plant-based meat alternatives. By diversifying its product lineup, the company can cater to a broader range of consumer preferences and dietary requirements, potentially opening up new revenue streams. New product launches and updates to existing products can drive sales growth both in existing markets and as the company enters new markets.
Overall, Beyond Meat’s revenue streams are primarily driven by the sale of its plant-based meat products across various channels and markets. The company focuses on expanding its presence in the retail and food service sectors globally. The company’s product innovation and international expansion strategy plays a crucial role in its ability to generate revenue and achieve growth.
Beyond Meat Business Model
Beyond Meat’s business model is a prime example of innovation and sustainability in the food industry. The company has successfully disrupted the traditional meat market by creating plant-based meat products that look, cook, and taste like their animal-based counterparts.
Beyond Meat’s flagship product, the Beyond Burger, has become a household name and has helped the company establish a strong foothold in the industry.
The company’s business model is centered around producing and selling its plant-based meat products at a premium price, typically higher than traditional meat-based products. This pricing strategy has allowed the company to generate high margins and reinvest in research and development to improve its products continually.
Beyond Meat’s proprietary technology and advanced ingredient sourcing have helped the company create plant-based meat products that are indistinguishable from traditional meat products. The company’s innovative marketing campaigns have also played a crucial role in creating awareness and driving product demand.
Beyond Meat’s partnerships with restaurants like Dunkin’ and McDonald’s, which offer Beyond Meat products on their menus, have helped the company expand its reach and generate additional revenue streams.
The company’s licensing agreements with various food service providers have also enabled it to penetrate new markets and increase its market share.
Overall, Beyond Meat’s business model is an excellent example of how a company can disrupt a traditional market by using innovation, technology, and sustainability.
The company’s mission to create delicious, nutritious, and sustainable plant-based meat products has resonated well with consumers. It has helped the company become one of the fastest-growing food companies in the world.
Net Revenue
Beyond-Meat-revenue-by-year
(click image to expand)
The definition of Beyond Meat’s net revenue is available here: net revenues. In simple terms, Beyond Meat’s net revenues are sales net of discounts, promotions, and rebates.
Beyond Meat’s net revenue declined to $326.5 million in fiscal year 2024, down slightly from $343.4 million reported in 2023.
The net revenue peaked at $464.7 million in fiscal year 2021 before experiencing a persistent decline in subsequent periods.
Compared to the peaked figure of $464.7 million, Beyond Meat’s 2024 result represents a decrease of 30% in three years.
Gross Profit, Operating Profit, And Adjusted EBITDA
Beyond Meat Profitability
(click image to expand)
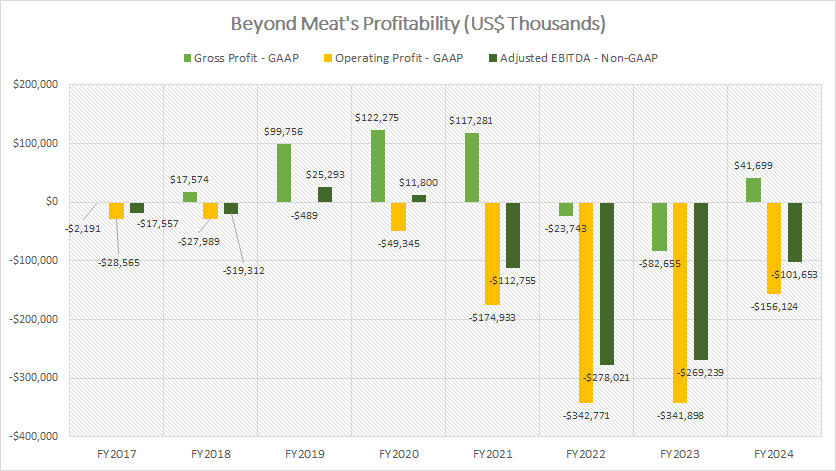
The definition of Beyond Meat’s adjusted EBITDA is available here: adjusted EBITDA.
Beyond Meat successfully returned to profitability in fiscal year 2024, reporting a gross profit of $41.7 million.
However, operating income and adjusted EBITDA remained negative, reflecting ongoing financial challenges.
These profitability metrics have been in the red since fiscal year 2021.
Gross Margin, Operating Margin, And Adjusted EBITDA Margin
Beyond Meat Margins
(click image to expand)
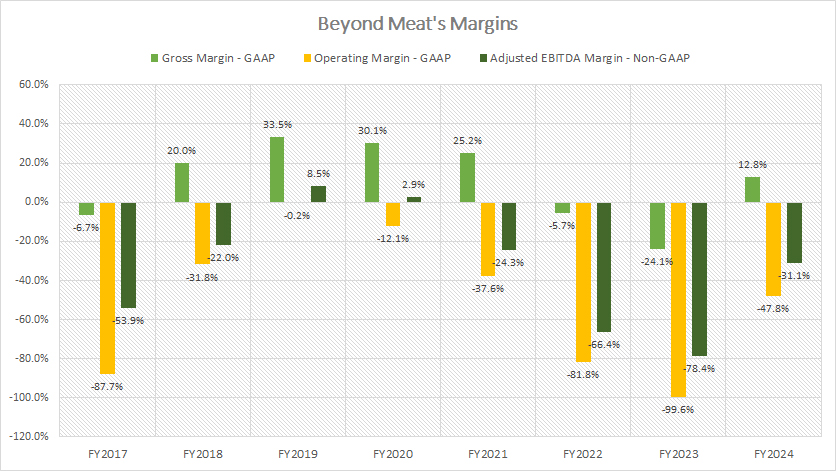
The definition of Beyond Meat’s adjusted EBITDA is available here: adjusted EBITDA.
Beyond Meat achieved profitability in fiscal year 2024, with its gross margin improving to 12.8%, a significant rebound from the -24% recorded in 2023.
However, other key profitability metrics, including operating and EBITDA margins, remained negative, underscoring the ongoing challenges in sustaining profitable operations.
Retail And Foodservice Revenue
Beyond-Meat-revenue-by-segment
(click image to expand)
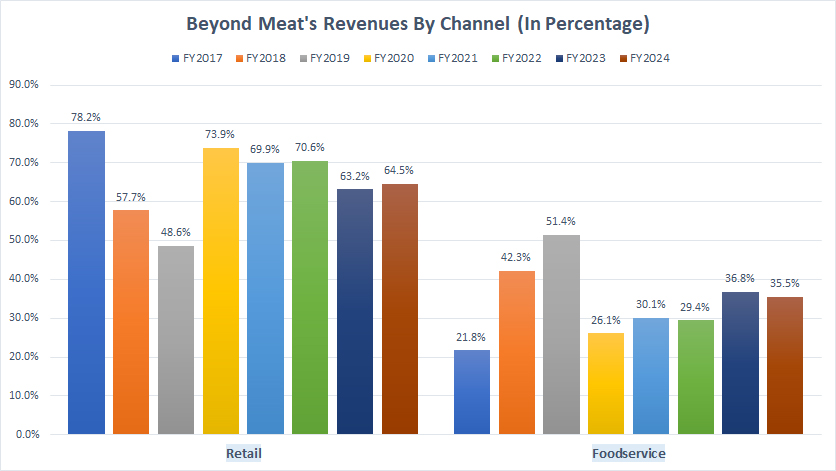
Beyond Meat operates in two distribution channels: retail and foodservice.
The definitions of Beyond Meat’s retail and foodservice distribution channels are available here: U.S. Retail, U.S. Foodservice, International Retail, and International Foodservice.
Revenue By Channel in FY2024:
| Segment | Revenue |
|---|---|
| (US$ Millions) | |
| Retail | $210.6 |
| Foodservice | $115.9 |
3-Year Revenue Trend from FY2021 to FY2024:
| Segment | Revenue | % Changes |
|---|---|---|
| (US$ Millions) | ||
| Retail | $324.8 to $210.6 | -35.2% |
| Foodservice | $139.9 to $115.9 | -17.2% |
5-Year Revenue Trend from FY2019 to FY2024:
| Segment | Revenue | % Changes |
|---|---|---|
| (US$ Millions) | ||
| Retail | $144.8 to $210.6 | +45.4% |
| Foodservice | $153.1 to $115.9 | -24.3% |
Retail And Foodservice Revenue In Percentage
Beyond-Meat-revenue-by-segment-in-percentage
(click image to expand)
Beyond Meat operates in two distribution channels: retail and foodservice.
The definitions of Beyond Meat’s retail and foodservice distribution channels are available here: U.S. Retail, U.S. Foodservice, International Retail, and International Foodservice.
Revenue Share in FY2024:
| Segment | Revenue Share (%) |
|---|---|
| Retail | 64.5% |
| Foodservice | 35.5% |
3-Year Trend from FY2021 to FY2024:
| Segment | Revenue Share (%) |
|---|---|
| Retail | 69.9% to 64.5% |
| Foodservice | 30.1% to 35.5% |
5-Year Trend from FY2019 to FY2024:
| Segment | Revenue Share (%) |
|---|---|
| Retail | 48.6% to 64.5% |
| Foodservice | 51.4% to 35.5% |
Retail And Foodservice Revenue YoY Growth Rates
Beyond-Meat-revenue-by-segment-growth-rates
(click image to expand)
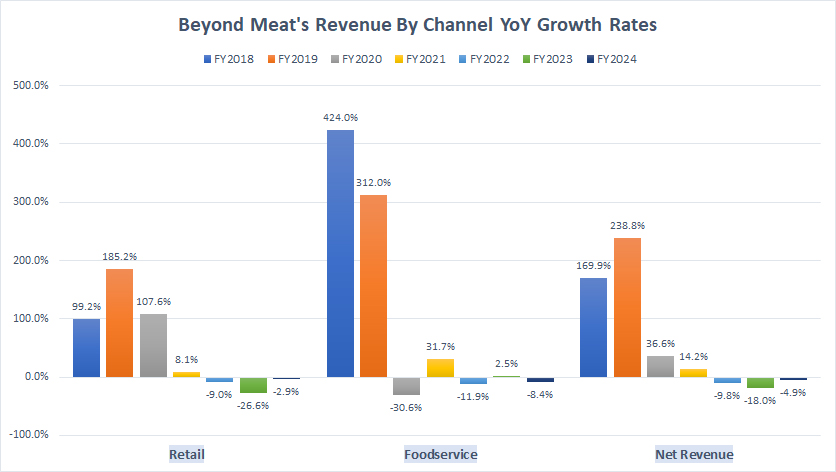
Beyond Meat operates in two distribution channels: retail and foodservice.
The definitions of Beyond Meat’s retail and foodservice distribution channels are available here: U.S. Retail, U.S. Foodservice, International Retail, and International Foodservice.
Revenue Growth in FY2024
| Segment | Growth Rates |
|---|---|
| Retail | -2.9% |
| Foodservice | -8.4% |
| Consolidated | -4.9% |
3-Year Average Revenue Growth from FY2022 to FY2024:
| Segment | Growth Rates |
|---|---|
| Retail | -12.8% |
| Foodservice | -5.9% |
| Consolidated | -10.9% |
5-Year Average Revenue Growth from FY2020 to FY2024:
| Segment | Growth Rates |
|---|---|
| Retail | +15.4% |
| Foodservice | -3.3% |
| Consolidated | +3.6% |
Insight
While Beyond Meat’s gross margin recovery in 2024 is a positive sign, the company remains fundamentally unprofitable at the operating level.
The persistent decline in revenue and profitability metrics indicates structural hurdles that Beyond Meat must address to achieve sustainable financial health.
Without a clear path to reversing revenue declines or significantly improving cost structures, its prospects for lasting profitability remain uncertain.
References and Credits
1. All financial figures presented were obtained and referenced from Beyond Meat’s quarterly and annual reports published on the company’s investor relations page: Beyond Meat SEC filings.
2. Flickr Images.
Disclosure
We may use artificial intelligence (AI) tools to assist us in writing some of the text in this article. However, the data is directly obtained from original sources and meticulously cross-checked by our editors multiple times to ensure its accuracy and reliability.
If you find the information in this article helpful, please consider sharing it on social media. Additionally, providing a link back to this article from any website can help us create more content like this in the future.
Thank you for your support and engagement! Your involvement helps us continue to provide high-quality, reliable content.


Please let me know if you’re looking for a author for your weblog.
You have some really good articles and I think I would be
a good asset. If you ever want to take some of the load off, I’d
love to write some content for your blog in exchange for a
link back to mine. Please shoot me an e-mail if interested.
Kudos!
My web blog … Deloras