Robotics. Pexels Image.
BYD and Tesla are two of the biggest players in the electric vehicle (EV) market, but they have distinct approaches and strengths.
BYD (Build Your Dreams) was founded in 1995 in China, initially as a battery manufacturer before expanding into EVs. Tesla, founded in 2003 in the U.S., revolutionized the EV industry with its high-performance electric cars.
Tesla is known for its premium EVs, focusing on high-end technology and performance. BYD, on the other hand, offers a wider range of affordable EVs, making electric mobility more accessible.
In this article, we will look into the research and development (R&D) spending of Tesla and BYD. Apart from the R&D figures, we also explore several R&D ratios, such as the R&D to revenue, R&D to operating expenses, and more.
Let’s get started!
For other key statistics of Tesla and BYD, you may find more resources on these pages:
Sales
Revenue
Profit Margin
- Tesla profit margin by segment: automotive, energy, and services,
- BYD vehicle margin and profit per car,
Investors interested in the R&D spending of other companies may find more resources on these pages:
R&D Comparison
- Tesla vs General Motors,
- Tesla vs Chinese EV makers,
- TSMC vs Samsung,
- Intel vs TSMC,
- AMD vs Nvidia,
- Meta vs Twitter, Pins, and Snapchat,
Please use the table of contents to navigate this page.
Table Of Contents
Definitions And Overview
- R&D To Revenue Ratio
- R&D To Operating Expenses Ratio
- Stock-Based Payments for R&D
- Currency Conversion: Yuan to USD
O2. How does Tesla allocate its R&D spending?
O3. How does BYD allocate its R&D spending?
R&D Spending
A1. Research And Development Spending
A2. BYD R&D Spending In Chinese Yuan
R&D Growth
R&D Ratios
C1. R&D to Revenue Ratio
C2. R&D to Operating Expenses Ratio
C3. R&D to Gross Profit Ratio
Stock-Based Payments for R&D
D1. R&D Stock-Based Payments to Total R&D Ratio
Summary And Reference
S1. Insight
S2. References and Credits
S3. Disclosure
Definitions
To help readers understand the content better, the following terms and glossaries have been provided.
R&D To Revenue Ratio: The ratio of Research and Development (R&D) to revenue is a financial metric measuring the proportion of a company’s revenue invested in research and development activities. It is calculated by dividing the company’s R&D expenses by its total revenue over a specific period.
This ratio is crucial for understanding how much of a company’s sales are reinvested into developing new products, services, or processes. A higher ratio may indicate a company heavily investing in innovation with the expectation of future growth and competitive advantage. In comparison, a lower ratio could suggest a focus on current operations and profitability.
This metric is particularly relevant in technology, pharmaceuticals, and other industries where ongoing R&D is critical for maintaining a competitive edge.
R&D To Operating Expenses Ratio: The R&D to Operating Expenses Ratio is a financial metric that measures the proportion of a company’s research and development (R&D) expenses to its total operating expenses.
This ratio is significant because it indicates how much of a company’s resources are allocated to R&D activities compared to other operational costs.
A higher ratio suggests that the company is investing more resources in innovation and development, which could indicate a focus on long-term growth and competitiveness.
This metric is particularly relevant in industries where innovation and technological advancement are crucial, such as pharmaceuticals, technology, and biotechnology.
Stock-Based Payments for R&D: Stock-based payments for R&D refer to compensation given in the form of stock options or equity grants to employees, contractors, or partners involved in research and development activities.
These payments are used to incentivize innovation and align the interests of employees with the company’s long-term growth.
Companies account for stock-based compensation under ASC 718, which requires them to recognize the fair value of stock-based payments as an expense in their financial statements.
This expense is typically spread over the vesting period of the stock awards. In the context of R&D, stock-based payments help attract top talent and encourage long-term commitment to technological advancements.
Currency Conversion: Yuan to USD: The exchange rate I used for converting the Chinese Yuan to USD is 1,000 Chinese Yuan to 137.53 USD.
How does Tesla allocate its R&D spending?
Tesla allocates its R&D spending across several key areas to maintain its leadership in electric vehicle innovation:
-
Battery Technology: Tesla invests heavily in improving battery efficiency, range, and safety, including advancements in 4680 battery cells.
-
Autonomous Driving: A significant portion of R&D goes into Full Self-Driving (FSD) technology and AI-powered vehicle automation.
-
Vehicle Design & Engineering: Tesla continuously refines its vehicle architecture, aerodynamics, and manufacturing processes.
-
Energy Solutions: The company develops solar energy products and energy storage solutions like the Powerwall and Megapack.
-
AI & Robotics: Tesla is working on Optimus, a humanoid robot designed for automation and labor assistance.
Tesla’s R&D spending reached $4.54 billion in 2024, marking a 14.39% increase from the previous year. The company continues to push boundaries in EV technology and sustainability.
How does BYD allocate its R&D spending?
BYD allocates its R&D spending across several key areas to drive innovation in electric vehicles and battery technology. Some of the major focuses include:
-
Battery Technology: BYD invests heavily in developing advanced batteries, such as the Blade Battery, which enhances safety and efficiency.
-
Vehicle Architecture: The company is working on Cell To Body technology, integrating battery cells directly into the vehicle structure for improved performance.
-
Connectivity & Smart Features: BYD is advancing DiLink 4.0 (5G), a smart connectivity system that enhances vehicle intelligence and user experience.
-
Autonomous Driving & AI: Research is being conducted into autonomous driving capabilities and AI-powered vehicle systems.
-
Manufacturing & Sustainability: BYD is optimizing production processes to improve efficiency and reduce environmental impact.
With its aggressive R&D investments, BYD is positioning itself as a leader in EV innovation.
Research And Development Spending
Tesla-vs-BYD-research-and-development-spending
(click image to expand)
BYD reports its financial standing in native currency Chinese Yuan. For the exchange rate between the Chinese Yuan and USD, please refer to this section: Chinese Yuan to USD conversion.
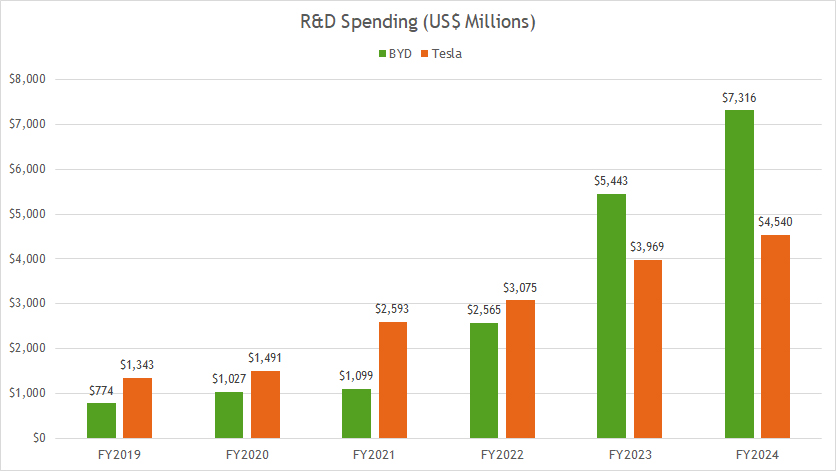
Historically, Tesla allocated a significantly higher budget for research and development (R&D) compared to BYD. Between fiscal years 2019 and 2022, Tesla’s R&D expenditures consistently outpaced those of BYD.
During this period, BYD’s average annual R&D spending amounted to $1.4 billion, whereas Tesla invested an average of $2.1 billion each year in R&D.
However, this trend shifted dramatically from fiscal year 2023 onward. In 2023, BYD’s R&D spending surged to $5.4 billion, surpassing Tesla’s $4.0 billion expenditure for the same year.
The gap widened further in fiscal year 2024, with BYD increasing its R&D investment to $7.3 billion, nearly 40% more than Tesla’s $4.5 billion R&D budget that year.
This marks a significant shift in industry dynamics, with BYD emerging as a leader in innovation-driven investment.
BYD R&D Spending In Chinese Yuan
BYD-research-and-development-spending-chinese-yuan
(click image to expand)
BYD reports its financial standing in native currency Chinese Yuan. For the exchange rate between the Chinese Yuan and USD, please refer to this section: Chinese Yuan to USD conversion.
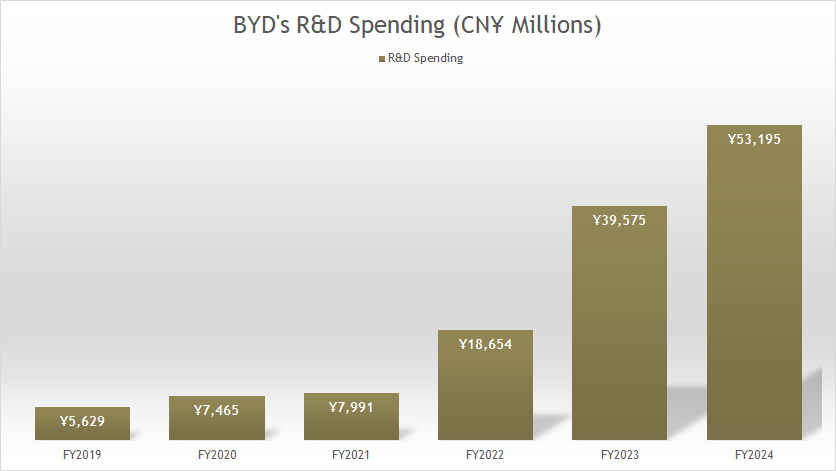
In terms of Chinese Yuan, BYD invested approximately CN¥53.2 billion in research and development (R&D) during fiscal year 2024, marking a 34% increase compared to the CN¥39.6 billion spent in 2023.
In 2022, BYD’s R&D expenditure totaled CN¥18.7 billion, a significant jump from previous years. Prior to 2022, the company’s annual R&D spending remained below CN¥10 billion.
This sharp rise in investment highlights BYD’s commitment to technological advancement and innovation in the electric vehicle industry.
R&D YoY Growth Rates
Tesla-vs-BYD-research-and-development-spending-growth
(click image to expand)
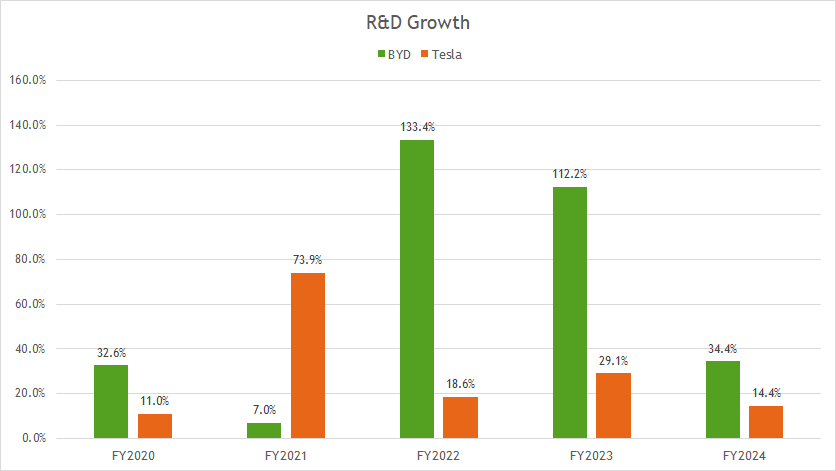
BYD’s research and development (R&D) growth has significantly outpaced Tesla’s in recent years. Over the past three years, BYD’s average annual R&D growth rate reached 93%, whereas Tesla’s stood at 21%.
Taking a broader perspective from fiscal year 2020 to 2024, BYD maintained an average annual R&D growth rate of 64%, nearly double Tesla’s 29% over the same period.
In fiscal year 2024, BYD continued its strong upward trajectory with an R&D growth rate of 34%, while Tesla reported a comparatively modest 14% increase.
This trend highlights BYD’s aggressive investment in innovation, positioning it as a major force in the EV industry’s technological advancements.
R&D To Revenue Ratio
Tesla-vs-BYD-research-and-development-to-revenue-ratio
(click image to expand)
The definition of R&D to revenue ratio is available here: R&D to revenue ratio.
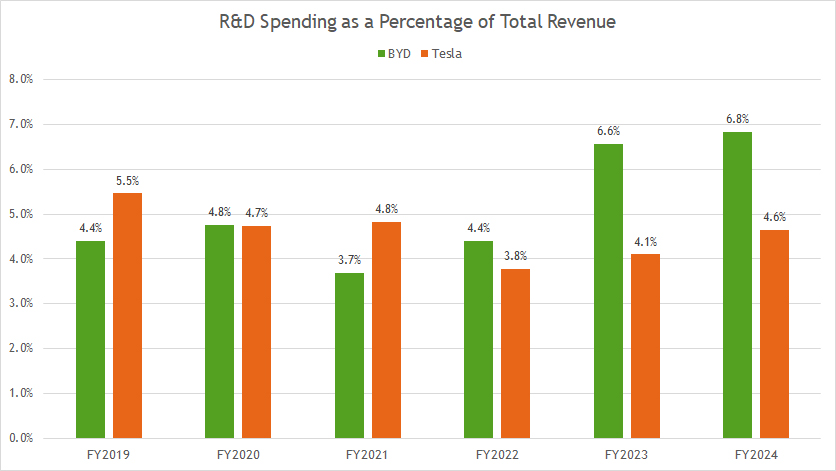
BYD has consistently outperformed Tesla in recent years when comparing R&D to revenue ratio.
In fiscal year 2024, BYD’s R&D to revenue ratio climbed to a record-high 6.8%, up from 6.6% in 2023. In 2022, the ratio was significantly lower at 4.4%, reflecting the company’s rapid growth in investment.
Tesla, on the other hand, reported a more modest increase. Its R&D to revenue ratio reached 4.6% in 2024, up from 4.1% in 2023. In 2022, Tesla’s ratio was 3.8%, showing a more gradual rise.
Looking at multi-year trends, BYD maintained a three-year average R&D to revenue ratio of 5.9%, compared to 4.2% for Tesla. Over the five-year period, BYD’s ratio averaged 5.3%, while Tesla’s stood at 4.4%.
This consistent gap underscores BYD’s aggressive investment in technological innovation relative to its revenue.
R&D To Total Operating Expenses Ratio
Tesla-vs-BYD-research-and-development-to-operating-expense-ratio
(click image to expand)
The definition of R&D to operating expenses ratio is available here: R&D to operating expenses ratio.
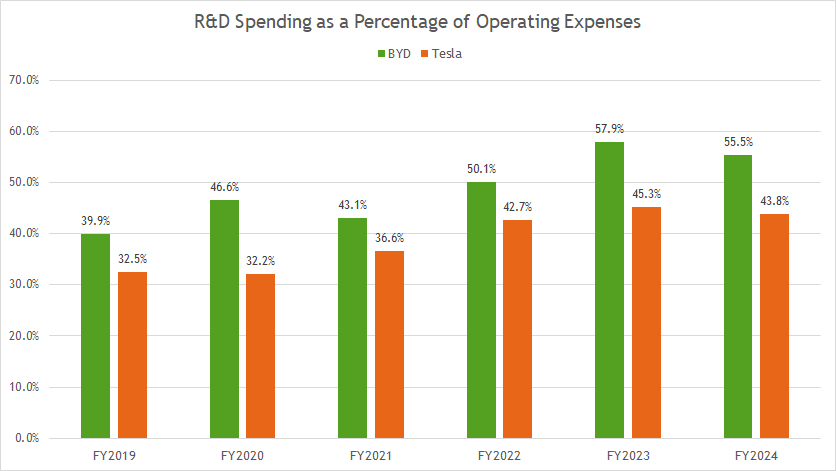
In terms of operating expenses, BYD’s research and development (R&D) investment has consistently surpassed Tesla’s in recent years.
In fiscal year 2024, BYD’s R&D to operating expense ratio soared to 55.5%, meaning over half of the company’s total operating expenses were dedicated to innovation and development.
Tesla, in comparison, reported a lower R&D to operating expense ratio of 43.8% in 2024, reflecting a more conservative allocation relative to BYD.
Looking at multi-year trends, BYD maintained an average R&D to operating expense ratio of 54.5% over the past three years, compared to 43.9% for Tesla. Over a five-year span, BYD’s ratio stood at 50.6%, while Tesla averaged 40.1%.
A key takeaway is BYD’s steady increase in R&D allocation, rising from 40% in 2019 to 55.5% in 2024. Tesla has also seen growth in its ratio, climbing from 32.5% in 2019 to 43.8%, but at a slower pace than BYD.
These figures highlight BYD’s aggressive approach to R&D investment, reinforcing its commitment to technological advancements.
R&D to Gross Profit Ratio
Tesla-vs-BYD-research-and-development-to-gross-profit-ratio
(click image to expand)
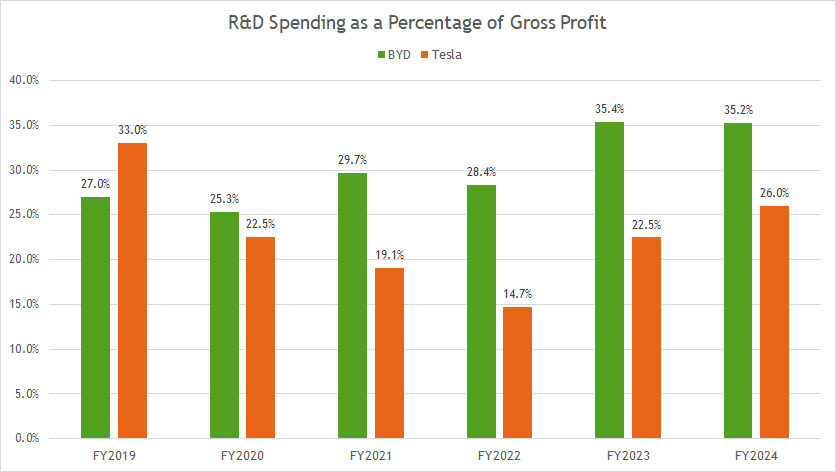
BYD has consistently allocated a larger share of its gross profit to research and development (R&D) compared to Tesla, as shown in the chart above.
In fiscal year 2024, BYD’s R&D expenditures accounted for 35% of its gross profit, whereas Tesla’s figure was notably lower at 26%. A year earlier, in 2023, BYD maintained the same 35% ratio, while Tesla’s ratio stood at 22.5%.
Looking back at 2022, Tesla’s R&D-to-gross profit ratio was only 14.7%, significantly lower than BYD’s 28.4% allocation.
Over a longer timeframe, BYD’s three-year average R&D-to-gross profit ratio was 33%, compared to 21% for Tesla. Similarly, the five-year average stood at 31% for BYD, while Tesla remained at 21%.
These figures highlight BYD’s aggressive approach to reinvesting profits into innovation and technological advancement, outpacing Tesla in terms of R&D commitment relative to gross profit.
R&D Stock-Based Payments to Total R&D Ratio
Tesla-vs-BYD-stock-based-payments-for-research-and-development-spending
(click image to expand)
The definition of stock-based payments for R&D is available here: stock-based payments for R&D.
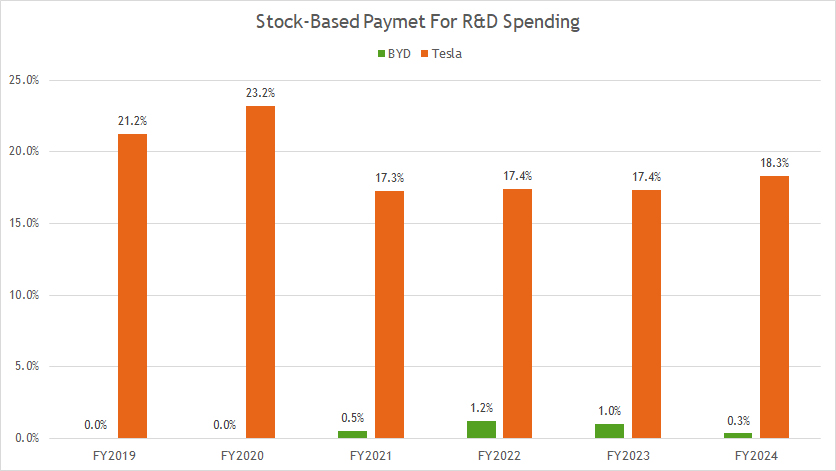
BYD employs stock-based payments for research and development (R&D) at a significantly lower rate than Tesla. Historically, BYD’s stock-based payment to R&D ratio has remained below 1%, reflecting its preference for direct cash investments in innovation rather than equity-based compensation.
Tesla, on the other hand, makes extensive use of stock-based payments as part of its R&D strategy. In fiscal year 2024, Tesla’s ratio of stock-based compensation to R&D stood at 18.3%, marking a continued reliance on equity incentives. This figure was 17.4% in both 2023 and 2022, showing consistency in Tesla’s approach.
Over a multi-year period, Tesla has used stock-based compensation as a key tool to attract and retain top talent in research-driven roles, particularly in fields such as AI, battery technology, and autonomous driving. BYD, in contrast, has focused more on direct financial investments into infrastructure and product development.
This stark difference highlights Tesla’s greater emphasis on stock-based incentives to fund innovation, whereas BYD leans on traditional capital expenditures for its R&D growth.
Insight
BYD’s R&D expansion signals a major shift in EV industry dynamics, positioning it as a frontrunner in innovation.
Tesla remains focused on high-end technology and AI-driven developments, but BYD’s aggressive reinvestment strategy suggests it could gain a long-term competitive edge, particularly in cost-efficient EV production and battery technology.
References and Credits
1. All financial figures presented were obtained and referenced from the companies’ respective annual and quarterly reports published on the following investor relations pages:
– Tesla Investor Relations
– BYD Investor Relations.
2. Pexels Images.
Disclosure
We may use artificial intelligence (AI) tools to assist us in writing some of the text in this article. However, the data is directly obtained from original sources and meticulously cross-checked by our editors multiple times to ensure its accuracy and reliability.
If you find the information in this article helpful, please consider sharing it on social media. Additionally, providing a link back to this article from any website can help us create more content like this in the future.
Thank you for your support and engagement! Your involvement helps us continue to provide high-quality, reliable content.

