Stock chart. Pixabay Image.
This article presents several key statistics of Ford Motor’s (NYSE: F) stock, including the market cap, price target, valuation vs peers, price to revenue, price to earnings, etc.
Let’s get started!
Please use the table of contents to navigate this page.
Table Of Contents
Market Cap
Share Price Vs Fair Value
A1. Share Price Based On Discounted Cash Flow
Historical Valuation
B1. Price To Sales Ratio
B2. Price To Earnings Ratio
B3. Price To Book Ratio
Valuation Vs Peers
C1. PS Ratio Vs Peers
C2. PE Ratio Vs Peers
Valuation Vs Industry
D1. PS Ratio Vs Industry
D2. PE Ratio Vs Industry
Analyst Forecast
E1. Share Price Vs Price Target
Conclusion And Reference
S1. Conclusion
S2. References and Credits
S3. Disclosure
Market Capitalization
Ford-Motor-market-capitalization
(click image to expand)
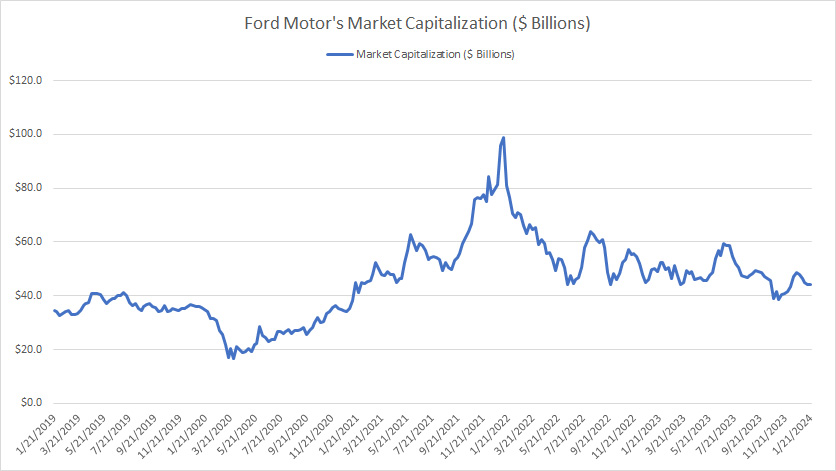
Ford’s market cap has fluctuated significantly in the past several years.
For example, Ford’s market cap plunged below US$20 billion during the onset of the COVID-19 pandemic in 2020.
In post-pandemic periods, Ford was valued at over US$100 billion at the start of the EV revolution in 2022.
On average, Ford Motor’s market valuation hovered around US$45 billion between 2019 and 2024.
Ford’s market cap has steadily decreased after topping US$100 billion in 2022.
As of Jan 2024, Ford’s market capitalization declined to US$44 billion, roughly in line with the historical average of US$45 billion.
Share Price Based On Discounted Cash Flow
Ford-Motor-share-price-based-on-discounted-cash-flow
(click image to expand)
* Data comes from Simpy Wall St.
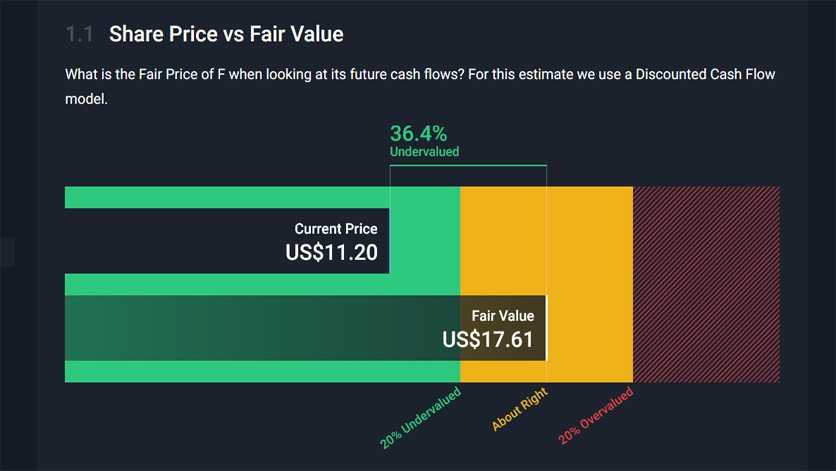
Ford Motor’s stock price was traded at around US$11.00 per share in Jan 2024, roughly 36% below its fair value of US$17.60, according to the discounted cash flow model provided by Simply Wall St.
Price To Sales Ratio
Ford’s price-to-sales ratio as of Jan 2024.
| Date | Trailing Price To Sales Ratio |
|---|---|
| 1/22/2024 | 0.30X |
| 2023 | 0.33X |
| 2022 | 0.35X |
| 2021 | 0.45X |
| 2020 | 0.20X |
| 2019 | 0.23X |
| Average | 0.31X |
Ford has a low price-to-sales ratio, averaging around 0.31X between 2019 and 2024.
Ford’s price-to-sales ratio came in at 0.3X as of Jan 2024, roughly in line with the historical average.
During the onset of the COVID-19 pandemic, Ford’s valuation was at a record low when the price-to-sales ratio declined to 0.20X, giving the company a market cap of US$20 billion.
However, Ford’s market valuation rose to a record level during the start of the EV revolution in 2021, with a price-to-sales ratio of 0.45X, the highest ratio ever measured.
At this period, Ford’s market cap exceeded US$100 billion. Subsequently, Ford’s valuation has significantly declined.
Price To Earnings Ratio
Ford’s price-to-earnings ratio as of Jan 2024.
| Date | Trailing Price To Earnings Ratio |
|---|---|
| 1/22/2024 | 7.3X |
| 2023 | 12.4X |
| 2022 | -2.2X |
| 2021 | 13.5X |
| 2020 | -51.9X |
| 2019 | 209.4X |
| Average | 36.4X |
As of Jan 2024, Ford’s PE ratio reached 7.3X, a much lower figure than the historical average.
Ford’s negative PE ratio in some years indicates negative earnings. In other words, Ford is not always profitable and can suffer losses.
Price To Book Ratio
Ford’s price-to-book ratio as of Jan 2024.
| Date | Trailing Price To Book Ratio |
|---|---|
| 1/22/2024 | 1.0X |
| 2023 | 1.2X |
| 2022 | 1.2X |
| 2021 | 1.6X |
| 2020 | 0.8X |
| 2019 | 1.1X |
| Average | 1.2X |
Ford’s price-to-book ratio totaled only 1.0X as of Jan 2024, slightly below its 5-year average of 1.2X.
Ford’s price-to-book ratio was the highest at 1.6X in 2021 when its market capitalization surged above US$100 billion.
PS Ratio Vs Peers
Ford-Motor-price-to-sales-vs-peers
(click image to expand)
* Data comes from Simpy Wall St.
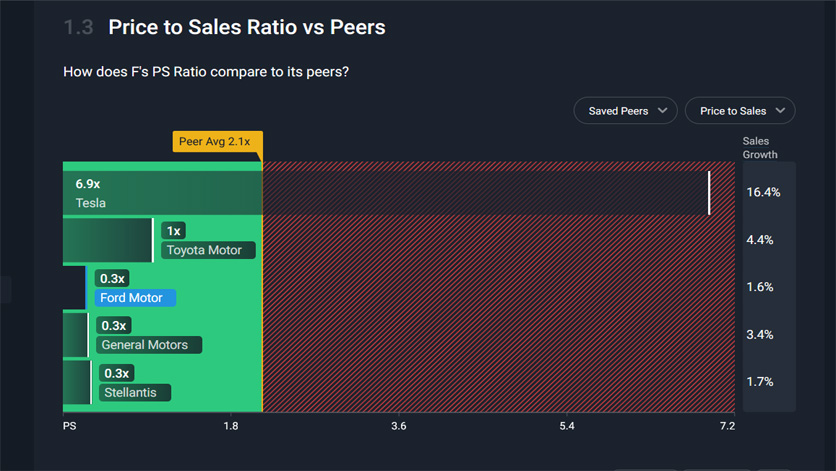
Ford had roughly the same valuation as its peers regarding the price-to-sales ratio.
For example, General Motors and Stellantis were traded at about the same price-to-sales ratio as Ford Motor as of Jan 2024, which was at 0.3X.
On the other hand, Toyota’s PS ratio was much higher at 1.0X, implying a higher valuation of the Japanese company than Ford Motor.
Among the automobile companies in comparison, Tesla commands the highest valuation with a PS ratio of nearly 7.0X as of Jan 2024.
Tesla’s higher valuation is likely justified by its projected sales growth of 16.4%, compared to Ford Motor’s estimated sales growth of only 1.6%.
PE Ratio Vs Peers
Ford-Motor-price-to-earnings-vs-peers
(click image to expand)
* Data comes from Simpy Wall St.
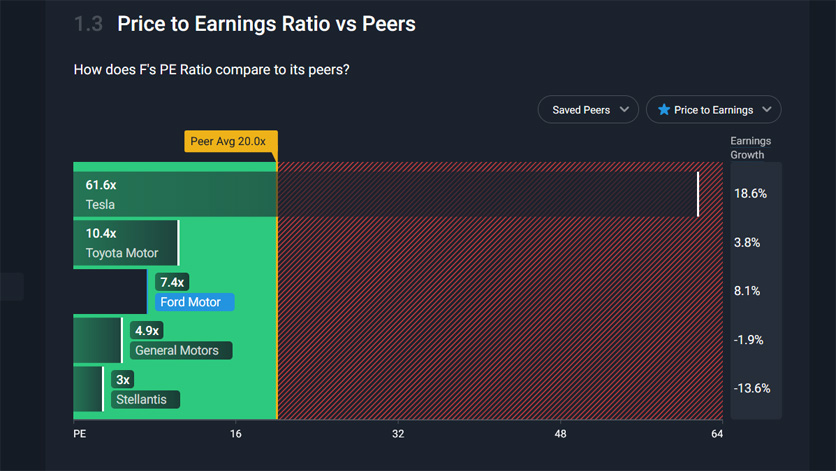
Ford Motor was traded at a much higher valuation than General Motors and Stellantis in earnings.
For example, Ford’s PE ratio of 7.4X was much higher than GM’s PE ratio of 4.9X and Stellantis’ PE ratio of 3X.
However, compared to Tesla and Toyota, Ford’s valuation with respect to earnings was at the lower end.
Ford’s estimated earnings growth peaked at 8%, while Tesla’s figure was much higher at 18.6%. Toyota’s earnings growth of 3.8% was lower than Ford Motor’s.
Both GM and Stellantis’ earnings growth was projected to be negative.
PS Ratio Vs Industry
Ford’s PS ratio vs the auto industry as of Jan 2024.
| Companies | PS Ratio | Sales Growth | Market Cap |
|---|---|---|---|
| Industry Average | 4.1X | 15.4% | – |
| Ford Motor | 0.3X | 1.6% | US$44.8b |
| General Motors | 0.3X | 3.4% | US$48.4b |
| THOR Industries | 0.6X | 6.5% | US$6.2b |
| Harley-Davidson | 0.8X | 1.9% | US$4.7b |
| Nio Inc. | 1.5X | 22.6% | US$10.7b |
| Polestar Automotive Holding UK | 1.6X | 35.7% | US$4.4b |
| Li Auto | 2.0X | 25.3% | US$27.5b |
| XPeng | 2.9X | 30.7% | US$8.8b |
| Rivian Automotive | 4.1X | 32.0% | US$15.4b |
| Ferrari | 9.5X | 42.2% | US$60.8b |
* Data comes from Simpy Wall St.
Ford Motor’s PS ratio of 0.3X is significantly below the automotive industry average of 4.1X. However, Ford’s sales growth of 1.6% is much lower than the automotive industry sales growth of 15.4%.
A visible trend is that Ford’s valuation is relatively in line with all conventional automobile companies such as General Motors, THOR Industries, and Harley-Davidson.
Compared to EV makers such as Nio, Li Auto, Xpeng, Polestar Automotive, and Rivian Automotive, Ford Motor’s valuation with respect to sales is much lower.
Another noteworthy trend is that the projected sales growth of all EV makers is much higher than Ford Motor’s sales growth of only 1.6%.
PE Ratio Vs Industry
Ford’s PE ratio vs the auto industry as of Jan 2024.
| Companies | PE Ratio | Earnings Growth | Market Cap |
|---|---|---|---|
| Industry Average | 12.7X | 17.8% | – |
| Ford Motor | 7.4X | 8.1% | US$44.8b |
| General Motors | 4.9X | -1.9% | US$48.4b |
| THOR Industries | 21.0X | 19.2% | US$6.1b |
| Harley-Davidson | 6.5X | -0.9% | US$4.7b |
| Nio Inc. | – | 55.7% | US$10.7b |
| Polestar Automotive Holding UK | – | 2.0% | US$4.4b |
| Li Auto | 32.3X | 29.2% | US$27.5b |
| XPeng | – | 49.1% | US$8.8b |
| Rivian Automotive | – | 15.5% | US$15.4b |
| Ferrari | 47.0X | 9.8% | US$60.8b |
* Data comes from Simpy Wall St.
Ford Motor’s PE ratio of 7.4X is slightly below the automotive industry average of 12.7X due mainly to Ford’s lower earning growth of 8% compared to the automotive industry earnings growth of 17.8%, according to the data provided by Simply Wall St.
Share Price Vs Price Target
Analyst price target for Ford Motor (F) as of Jan 2024.
| Types Of Share Price | Dates | ||
|---|---|---|---|
| Jan 2025 | Jan 2024 | Jan 2023 | |
| Average 1-Yr Price Target | US$13.6 | US$15.6 | US$20.1 |
| Potential Upside At The Time Of Forecasting | +21.6% | +34.1% | -3.3% |
| Actual Share Price At The Time Of Forecasting | US$11.2 | US$11.6 | US$20.8 |
| 1-Year Actual Share Price | NA | US$12.2 | US$11.6 |
| Number Of Analysts | 22 | 20 | 21 |
| Analysts’ Highs | US$22.0 | US$28.0 | US$25.0 |
| Analysts’ Lows | US$9.5 | US$10.0 | US$12.0 |
* Data comes from Simpy Wall St.
Ford’s share price is projected to hit US$13.6 on average by Jan 2025, representing a potential upside of 21.6%, according to 22 analysts.
A worrying trend is that Ford Motor’s projected price target has significantly declined since Jan 2023, from US$20.1 in Jan 2023 to US$13.6 in Jan 2025, implying a decreasing stock price for the company.
Conclusion
To recap, Ford’s stock valuation has significantly decreased post-2022. For example, Ford’s market cap reached a record low of US$44 billion as of Jan 2024, while other valuation metrics point to a decreasing valuation for the company in the post-pandemic era.
Moreover, the price target provided by analysts of Ford Motor has significantly declined since 2023, indicating a decreasing market valuation for the company.
Overall, conducting thorough research and analysis is important before making any investment decisions related to Ford Motor or any other company’s stock. It’s also important to remember that stock prices and market valuations can be subject to fluctuation and uncertainty.
References and Credits
1. All financial figures presented in this article were obtained and referenced from the following links:
a. Ford Financial Results
b. Ford’s Key Statistic From Yahoo Finance
c. Simply Wall St – Ford Valuation
2. Pixabay Images.
Disclosure
References and examples such as tables, charts, and diagrams are constantly reviewed to avoid errors, but we cannot warrant the total correctness of all content.
The content in this article is for informational purposes only and is neither a recommendation nor a piece of financial advice to purchase a stock.
If you find the information in this article helpful, please consider sharing it on social media and provide a link to this article from any website so that more articles like this can be created.
Thank you!

