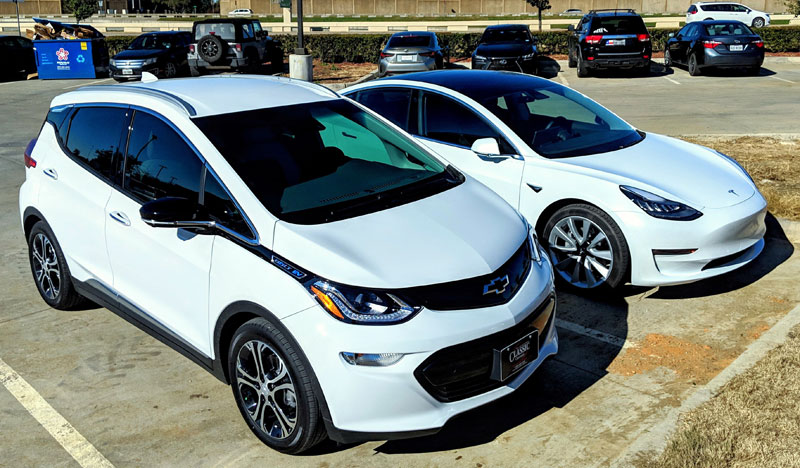
Side by side: Chevrolet Bolt and Tesla Model 3. Source: Flickr Image.
Tesla and General Motors (GM) are two prominent players in the automotive industry, both heavily investing in research and development (R&D) to innovate and lead in the evolving market, especially in electric vehicles (EVs) and autonomous driving technologies.
However, their approaches and scale of R&D investment can differ significantly, reflecting their corporate strategies and market positions.
Tesla’s R&D efforts are more concentrated on EVs and related technologies, reflecting its position as a pure-play electric vehicle company.
In contrast, GM’s R&D is more diversified, reflecting its broader product portfolio, including internal combustion vehicles.
In this article, we will look into the research and development (R&D) numbers of Tesla and General Motors. Apart from the absolute values, we also compare the R&D of both companies with respect to their revenues and expenses.
Let’s get started!
Investors interested in the R&D spending of other companies may find more resources on these pages:
R&D Comparison: Automotive
R&D Comparison: Semiconductor
R&D Comparison: Social Media
Please use the table of contents to navigate this page.
Table Of Contents
Definitions And Overview
O2. Tesla’s R&D Approach
O3. General Motors’ R&D Approach
R&D Spending
A1. Research And Development Spending
R&D Growth
R&D Ratios
C1. R&D To Revenue Ratio
C2. R&D To Total Costs And Expenses Ratio
Summary And Reference
S1. Insight
S2. References and Credits
S3. Disclosure
Definitions
To help readers understand the content better, the following terms and glossaries have been provided.
R&D To Revenue Ratio: The ratio of Research and Development (R&D) to revenue is a financial metric measuring the proportion of a company’s revenue invested in research and development activities. It is calculated by dividing the company’s R&D expenses by its total revenue over a specific period.
This ratio is crucial for understanding how much of a company’s sales are reinvested into developing new products, services, or processes. A higher ratio may indicate a company heavily investing in innovation with the expectation of future growth and competitive advantage. In comparison, a lower ratio could suggest a focus on current operations and profitability.
This metric is particularly relevant in technology, pharmaceuticals, and other industries where ongoing R&D is critical for maintaining a competitive edge.
R&D To Costs And Expenses Ratio: The R&D to Costs and Expenses Ratio is a financial metric that measures the proportion of a company’s research and development (R&D) expenses to its total costs and expenses.
This ratio is significant because it indicates how much of a company’s resources are allocated to R&D activities compared to other operational costs. A higher ratio suggests that the company is investing more resources in innovation and development, which could indicate a focus on long-term growth and competitiveness.
This metric is particularly relevant in industries where innovation and technological advancement are crucial, such as pharmaceuticals, technology, and biotechnology.
Tesla’s R&D Approach
Tesla, founded in 2003, has always positioned itself as a technology and innovation leader in the electric vehicle market.
The company invests heavily in R&D to support its mission of accelerating the world’s transition to sustainable energy.
Tesla’s R&D efforts are focused on improving battery technology, powertrain efficiency, software, and autonomous driving capabilities.
The company’s vertical integration strategy, which includes developing and manufacturing its own battery cells, software, and hardware for its vehicles, necessitates a significant and continuous investment in R&D.
Tesla’s R&D expenditures are also aimed at improving manufacturing processes and reducing production costs, which are critical for the company’s long-term goal of making EVs affordable for the mass market.
General Motors’ R&D Approach
General Motors, an established global automaker with a history dating back to 1908, has been adapting to the shift towards electrification and autonomous vehicles.
GM’s R&D efforts are broad, covering traditional internal combustion engines, electric vehicles, battery technology, and autonomous driving through its Cruise subsidiary.
GM has announced significant investments in EV and battery technology, aiming to launch a variety of electric vehicles across its brands.
The company’s R&D strategy also includes partnerships and collaborations with other companies to accelerate development and reduce costs.
GM’s size and diversified portfolio allow it to spread its R&D investments across a range of technologies and platforms.
Research And Development Spending
GM vs Tesla in R&D spending
(click image to expand)
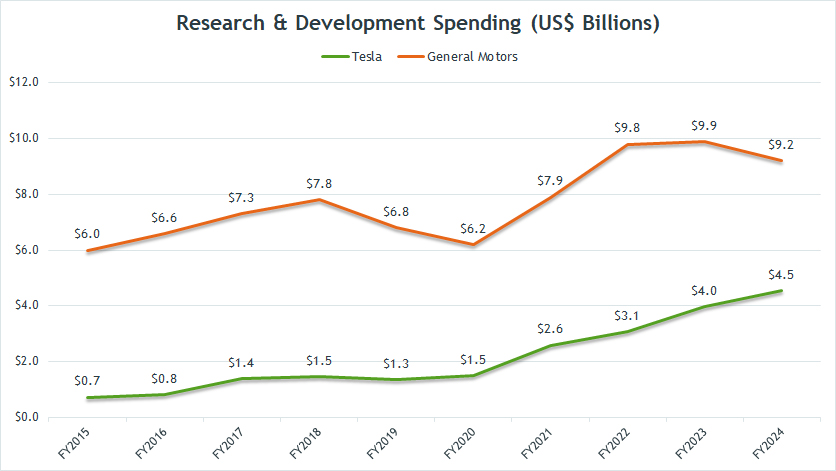
As shown in the chart above, GM’s research and development spending is much larger than Tesla’s. In fact, GM has spent roughly twice the amount that Tesla has spent on research and development.
Between 2022 and 2024, GM has poured an average of $9.6 billion on research and development. The latest figure reached a staggering figure of $9.2 billion.
In the same period, Tesla’s R&D spending has averaged just $3.9 billion, only one-third the amount GM has spent. Tesla’s latest figure increased to $4.5 billion, up 12.5% from 2023 and an increase of 45% from the amount in 2022.
Although GM’s R&D expense is much higher, Tesla is on track to close the gap. For example, the gap was much bigger historically, about 9X difference in 2015. However, the difference narrowed to only 2X as of 2024.
R&D YoY Growth Rates
GM vs Tesla in R&D spending growth rates
(click image to expand)
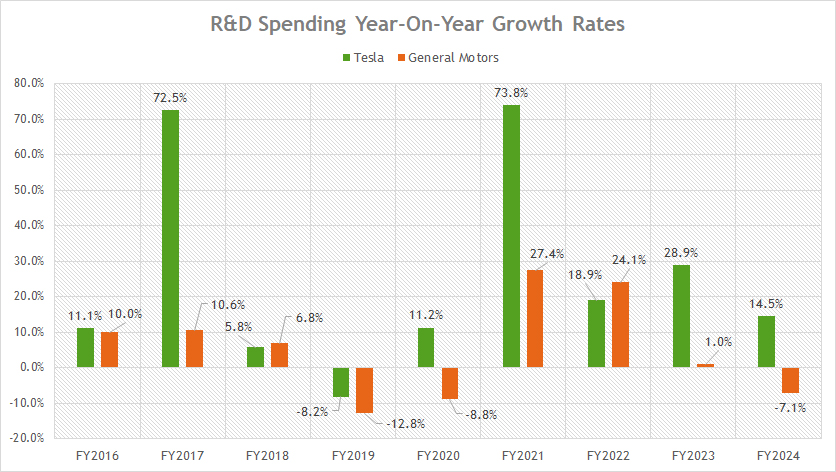
Tesla’s R&D spending growth has averaged over 20% annually since 2022, while GM’s figure has come to only 6%. The latest growth rate was 14.5% for Tesla and -7.1% for GM.
Therefore, Tesla’s R&D expense has grown much faster than GM’s. In fact, the growth of Tesla’s R&D is more than triple the growth of GM’s over the past three years
R&D To Revenue Ratio
GM vs Tesla in R&D spending to revenue ratio
(click image to expand)
The definition of R&D to revenue ratio is available here: R&D to revenue ratio.
Tesla’s ratio of R&D to revenue has significantly declined over the years. As of 2024, Tesla’s ratio of R&D to total revenue measured just 4.7%, one of the new lows ever seen.
On the other hand, GM’s ratio of R&D to automotive revenue was slightly better in fiscal year 2024, totaling 5.4%.
Contrary to the decrease in Tesla’s ratio, GM’s R&D to revenue ratio has actually been increasing, topping several record figures over the last few years.
Therefore, General Motors allocates a much bigger R&D budget than Tesla does from the perspective of revenue. In addition, GM’s rising R&D budget may have been due to its recent entry into the electric vehicle space.
GM is determined to maintain a solid competitive advantages and core competency by signficantly raising its R&D spending.
R&D To Total Costs And Expenses Ratio
R&D spending to total costs and expenses ratio
(click image to expand)
The definition of R&D to total costs and expenses ratio is available here: R&D to costs and expenses ratio.
The costs and expenses include the costs of revenue and operating expenses for both companies.
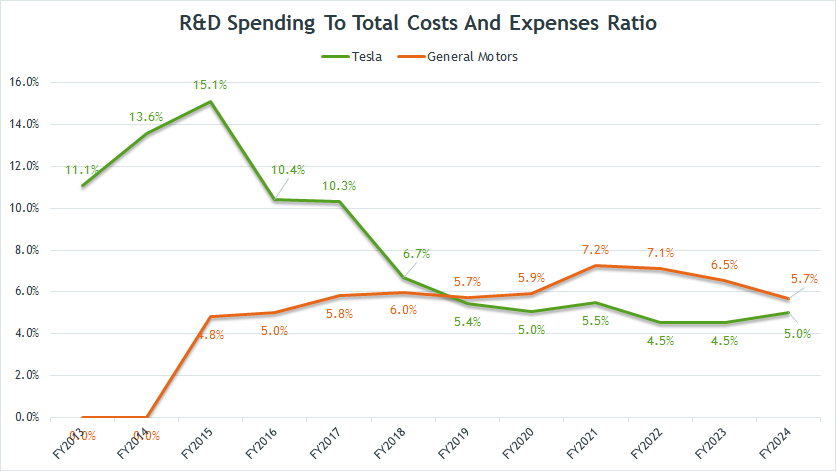
With respec to total costs and expenses, General Motors has allocated a much higher R&D budget compared to Tesla. GM’s R&D budget reached 5.7% of the total costs and expenses in fiscal year 2024, while Tesla’s ratio was only 5.0% in the same period.
A noticeable trend is GM’s rising ratio compared to Tesla’s decreasing ratio. Tesla used to allocate a much bigger R&D budget than General Motors.
However, Tesla’s R&D with respect to total costs and expenses has slowly declined over the years, reaching several lows in recent periods.
General Motors’ rising R&D budget may have been due to its recent entry into the EV space, driven by its ambitious plan to go all-electric for its entire fleets by 2035, according to several sources.
In addition, GM aims to offer 30 new electric models globally by the middle of the decade and is investing heavily in EV technology and infrastructure, such as Ultium batteries and EV charging networks, to support this transition, according to the company’s news release.
For your information, GM’s EV delivery has significantly risen in recent years: GM’s EV sales and market share.
Insight
Essentially, GM outspends Tesla in absolute R&D dollars, but Tesla’s growth rate is accelerating, progressively closing the gap.
GM’s increasing R&D-to-revenue ratio suggests aggressive EV expansion, while Tesla’s declining ratio signals higher efficiency in leveraging past investments.
Given Tesla’s historical trend of rapid R&D growth, it could outpace GM in total R&D expenditure in the long run, despite GM’s current dominance.
References and Credits
1. All financial figures presented were obtained and referenced from the companies’ respective annual and quarterly reports published on the following investor relations pages:
– Tesla Investor Relations
– GM Sec Filings.
2. Flickr Images.
Disclosure
We may use artificial intelligence (AI) tools to assist us in writing some of the text in this article. However, the data is directly obtained from original sources and meticulously cross-checked by our editors multiple times to ensure its accuracy and reliability.
If you find the information in this article helpful, please consider sharing it on social media. Additionally, providing a link back to this article from any website can help us create more content like this in the future.
Thank you for your support and engagement! Your involvement helps us continue to provide high-quality, reliable content.


Hi,I have an invention that will help electric vehicles self charge while moving i will like to work with research and development to bring this about 346 374 9400,