A mining excavator. Pixabay Image.
This article presents the revenue and profitability of Arch Resources, previously known as Arch Coal.
We will go over Arch Resources’ total revenue and revenue breakdown by segment and region.
In the context of revenue by segment, we will look at Arch Resources’ revenue produced from the metallurgical and thermal segments.
On the other hand, Arch Resources’ revenue by region refers to revenue generated from North America and export sales.
Arch Resouces’ export sales or seaborne revenue comes from the sales of coal to countries located primarily in Asia, Europe, and South and Central America.
Apart from revenue, we will also look at the profitability of the company and the profit as well as the margin breakdown by segment.
Investors who are interested in Arch Resources’ coal reserves and production volumes may visit this page – Arch Resources Coal Reserves And Production Numbers.
Let’s get started.
Table Of Contents
Consolidated Revenue
A1. Total Revenue By Year
A2. Total Revenue By TTM
Consolidated Profit And Margin
B1. Profitability
B2. Margins
Revenue By Region
C1. North America And Seaborne Revenue
C2. North America And Seaborne Revenue By Percentage
C3. North America And Seaborne Revenue Growth Rates
Revenue By Segment
D1. Metallurgical And Thermal Revenue
D2. Metallurgical And Thermal Revenue By Percentage
D3. Metallurgical And Thermal Revenue Growth Rates
Profitability And Margin By Segment
E1. Metallurgical And Thermal Adjusted EBITDA
E2. Metallurgical And Thermal Adjusted EBITDA By Percentage
E3. Metallurgical And Thermal Adjusted EBITDA Margin
Revenue By Region Further Breakdown
F1. North America And Seaborne Revenue Further Breakdown
F2. North America And Seaborne Revenue Further Breakdown By Percentage
Revenue By Segment Further Breakdown
G1. Metallurgical And Thermal Revenue Further Breakdown
G2. Metallurgical And Thermal Revenue Further Breakdown By Percentage
Conclusion And Reference
S1. Conclusion
S2. References and Credits
S3. Disclosure
Arch Resources’ Total Revenue By Year
Arch Resources total revenuye by year
(click image to enlarge)
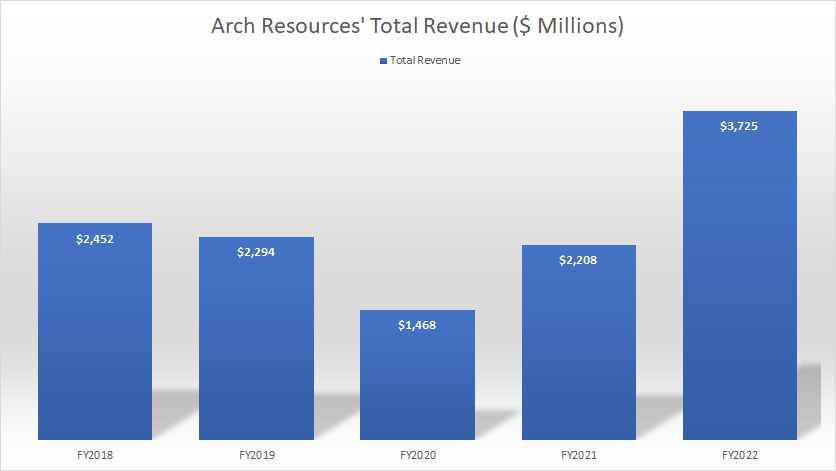
On a consolidated basis, Arch Resources boasted total revenue of $3.7 billion in fiscal 2022, a record high over the past 5 years and a rise of nearly 70% year-over-year.
Fiscal 2022 has been the best year for the company since 2018 in terms of sales revenue.
Notice how Arch Resources’ revenue dived considerably in fiscal 2020 when the COVID-19 pandemic hit and quickly recovered in post-pandemic periods.
Arch Resources’ Total Revenue By TTM
Arch Resources total revenuye by ttm
(click image to enlarge)
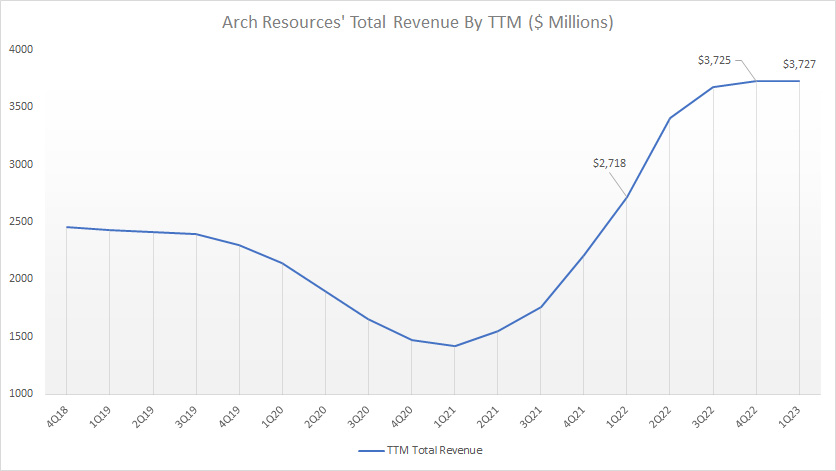
On a TTM basis, Arch Resources’ total revenue hit $3.7 billion as of 1Q 2023, roughly in line with the figure reported in the prior quarter.
However, year over year, Arch Resources’ TTM revenue reported in 1Q 2023 represents a rise of 37%.
Notice how Arch Resouces’ TTM revenue ramped up so rapidly between fiscal 2021 and 2022 when the world was only starting to recover from the COVID-19 crisis.
Arch Resources’ Profitability
Arch Resources profitability
(click image to enlarge)
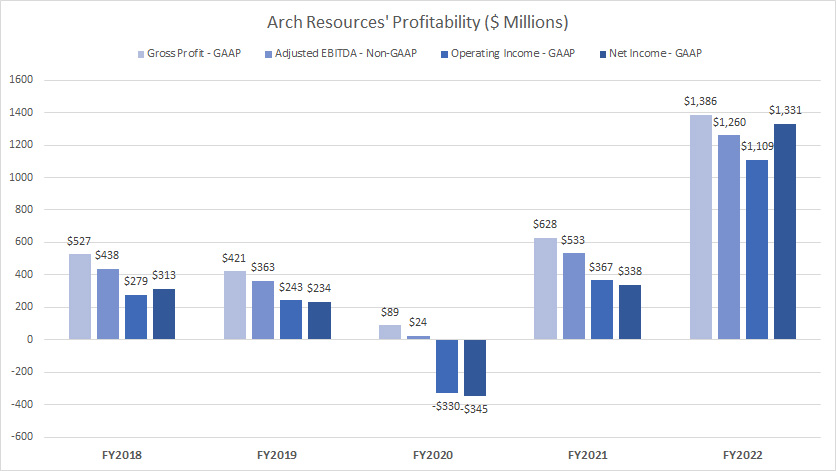
In terms of profitability, Arch Resources had the best results in fiscal 2022, with all profit figures topping record highs.
As seen in the chart above, Arch Resources’ gross and operating profit in fiscal 2022 soared beyond $1 billion for the first time while net profit hit more than $1.3 billion USD, blowing all prior records out of the door.
Between 2018 and 2022, Arch Resources had only incurred a loss once and that was in fiscal 2020 when the COVID-19 pandemic hit North America and globally.
Notice how quickly Arch Resources’ profitability recovered in the following year.
Arch Resources’ Margins
Arch Resources margins
(click image to enlarge)
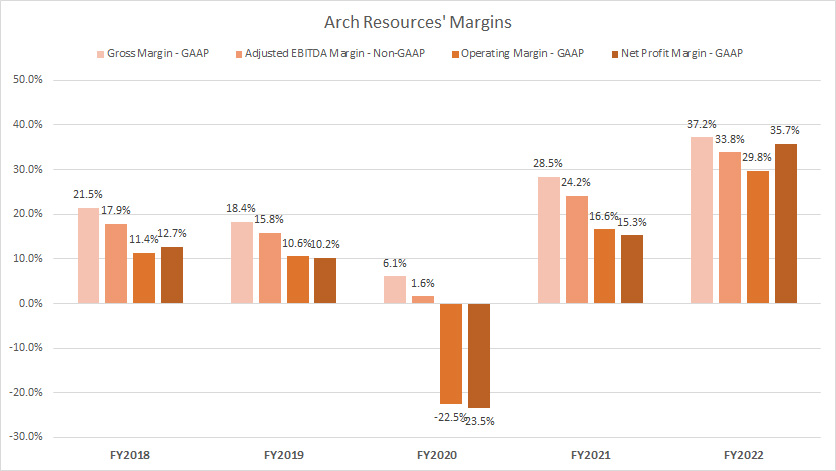
Similarly, Arch Resources’ had the best results in fiscal 2022 from the perspective of margins.
As seen in the chart above, Arch Resources’ gross profit margin topped nearly 40% in fiscal 2022 while its operating profit margin came in at 30% in the same period, nearly double the number reported in 2021.
Moreover, Arch Resources’ net profit margin totaled 15% in fiscal 2021 and climbed to 36% the following year, illustrating the huge profit margin the company enjoyed in post-pandemic periods when the demand for coal surged.
Arch Resources’ North America And Seaborne Revenue
Arch Resources North America and seaborne revenue
(click image to enlarge)
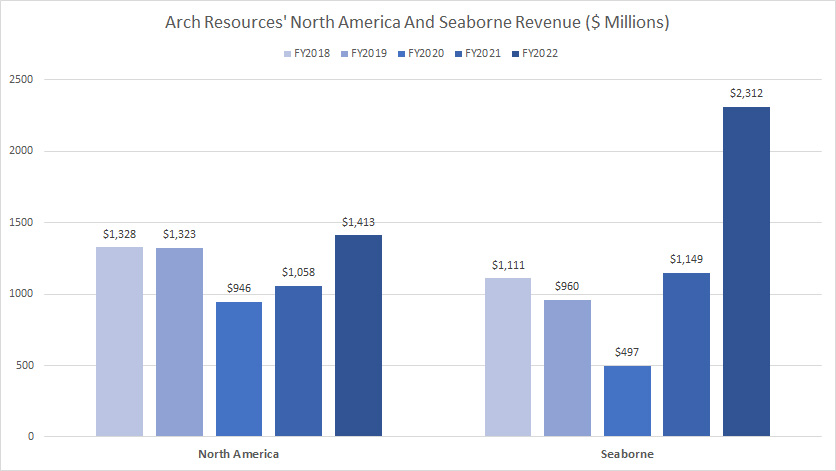
Arch Resources derives its sales from only 2 sources from the perspective of regions, namely North America and seaborne.
Seaborne revenue comes from export sales to countries located primarily in Asia, Europe, and South and Central America, according to the company’s 2022 annual report.
On the other hand, revenue from North America is sales performed in the domestic market, primarily in the U.S.
As seen in the chart above, Arch Resources’ seaborne revenue used to be much smaller than its North American counterpart but was blowing all prior results out of the water in fiscal 2022.
In fiscal 2022, Arch Resources’ seaborne revenue soared to $2.3 billion, a record high, and even surpassed the pre-pandemic results by a huge margin.
While North American revenue climbed significantly in post-pandemic times, it is only in line with those reported before the COVID-19 crisis.
The following table shows the disaggregation of Arch Resources’ seaborne revenue by countries.
Arch Resources’ seaborne revenue by coal shipment destination
| Fiscal Year | Revenue In Millions | ||
|---|---|---|---|
| Asia | Europe | Central And South America | |
| 2020 | $138 | $289 | $57 |
| 2021 | $447 | $593 | $110 |
| 2022 | $1,211 | $940 | $161 |
Arch Resources’ export revenue to Asia and Europe, in particular, has grown by nearly 10- and 3-fold, respectively, since 2020.
As of 2022, Arch Resources’ seaborne revenue to Asia totaled more than $1.2 billion while the figure for Europe clocked $940 million USD.
Arch Resources’ North America And Seaborne Revenue By Percentage
Arch Resources North America and seaborne revenue by percentage
(click image to enlarge)
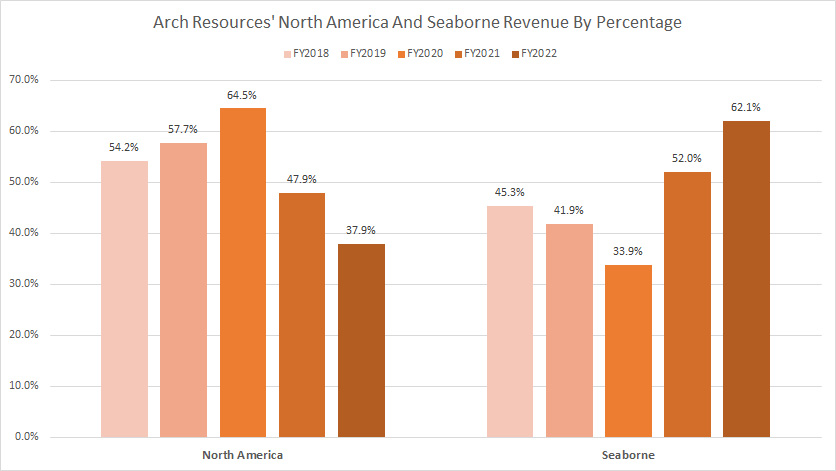
From the perspective of percentage, Arch Resources’ seaborne revenue accounted for 62% of the company’s total revenue as of 2022, the highest figure that has ever been measured.
More importantly, the percentage also has been on the rise since 2020, illustrating the growing importance of the export segment to the company.
In contrast, Arch Resources’ revenue percentage from the North American region seems to have peaked in fiscal 2020 and has since been going downhill.
As of 2022, the North American revenue accounted for only 38% of the company’s total sales, the lowest ratio that has ever been measured.
Arch Resources’ North America And Seaborne Revenue Growth Rates
Arch Resources North America and seaborne revenue growth rates
(click image to enlarge)
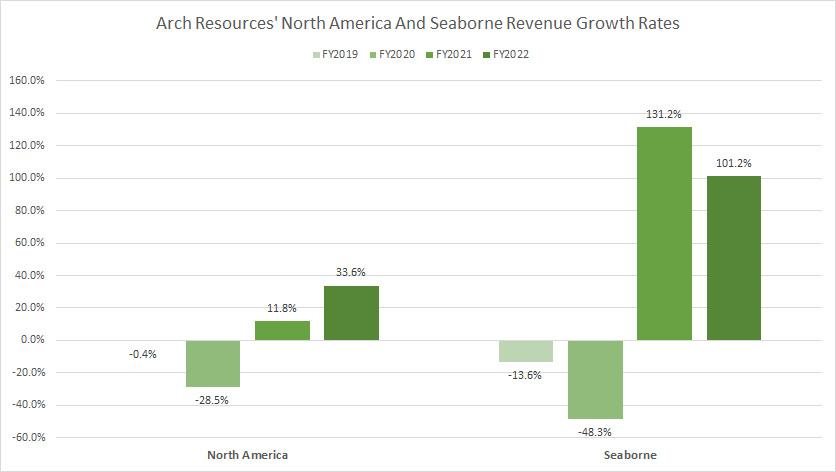
You can see that Arch Resources’ seaborne revenue grew the fastest since 2021, notably at more than 100% every year.
In contrast, Arch Resources’ revenue growth rates for North America came in at only 12% and 34% in fiscal 2021 and 2022, respectively, which are far lower than those reported in the seaborne segment.
Arch Resources’ Metallurgical And Thermal Revenue
Arch Resources metallurgical and thermal revenue
(click image to enlarge)
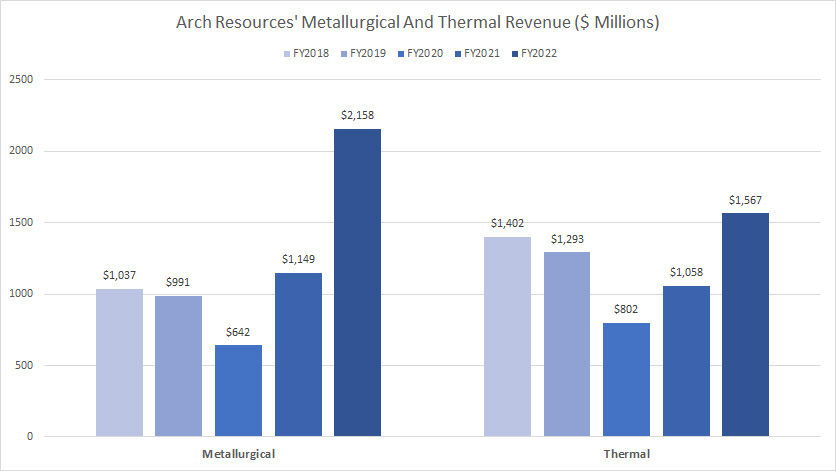
Arch Resources’ metallurgical segment revenue soared in fiscal 2022 and reached a record high of $2.2 billion USD, which was roughly double the figure reported in the prior year.
Arch Resources’ metallurgical segment revenue used to be lower than its thermal counterpart prior to the pandemic.
However, in post-pandemic periods, the metallurgical segment revenue has grown much faster since 2020 and led the thermal segment result by a wide margin as of fiscal 2022.
In contrast, Arch Resources’ thermal segment revenue clocked $1.6 billion as of fiscal 2022, still a significantly higher figure compared to prior results.
Arch Resources’ Metallurgical And Thermal Revenue By Percentage
Arch Resources metallurgical and thermal revenue by percentage
(click image to enlarge)
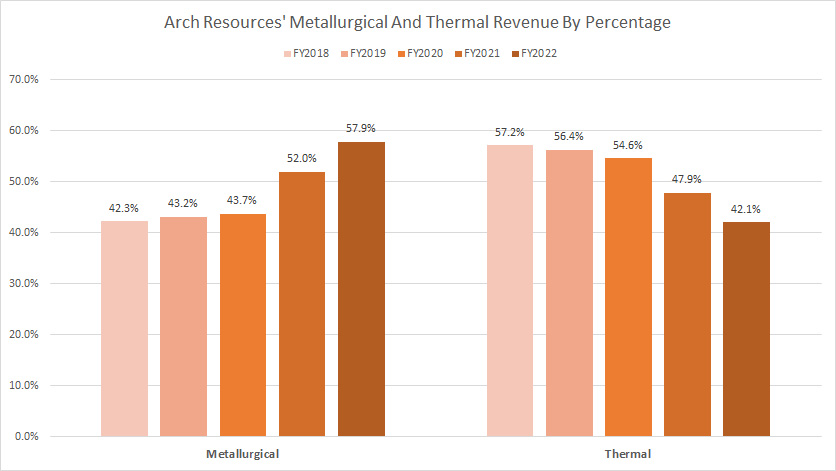
Arch Resources’ metallurgical revenue made up about 58% of the company’s total revenue in fiscal 2022 while thermal revenue contributed 42% in the same period.
The percentage of the metallurgical segment has risen dramatically since 2020 while that of the thermal segment has declined in the same period.
The rising revenue contribution from the metallurgical segment is expected as Arch Resources has been working to grow its metallurgical mining operations while slowly winding down its legacy thermal segment.
This article – Arch Resources coal sales volume – illustrates the growing sales volume of the metallurgical segment and the decreasing sales volume of the thermal segment.
Arch Resources’ Metallurgical And Thermal Revenue Growth Rates
Arch Resources metallurgical and thermal revenue growth rates
(click image to enlarge)
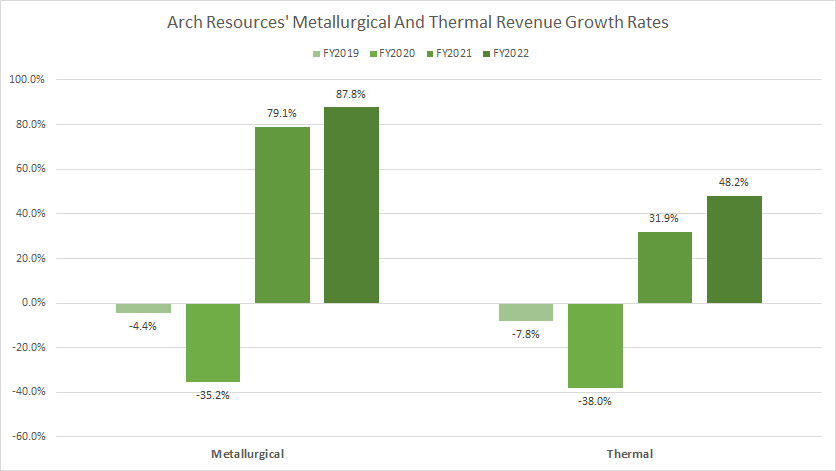
In terms of growth rates, Arch Resources’ metallurgical revenue grew the fastest between fiscal 2020 and 2022, notably at 79% and 88% year-on-year in fiscal 2021 and 2022, respectively.
On the other hand, Arch Resources’ thermal segment reported much lower growth rates, but also quite remarkable by any standard.
In this context, Arch Resources’ thermal revenue grew 32% and 48% in fiscal 2021 and 2022, respectively, which was much better than the growth rates reported before the pandemic.
Arch Resources’ Metallurgical And Thermal Adjusted EBITDA
Arch Resources metallurgical and thermal profitability
(click image to enlarge)
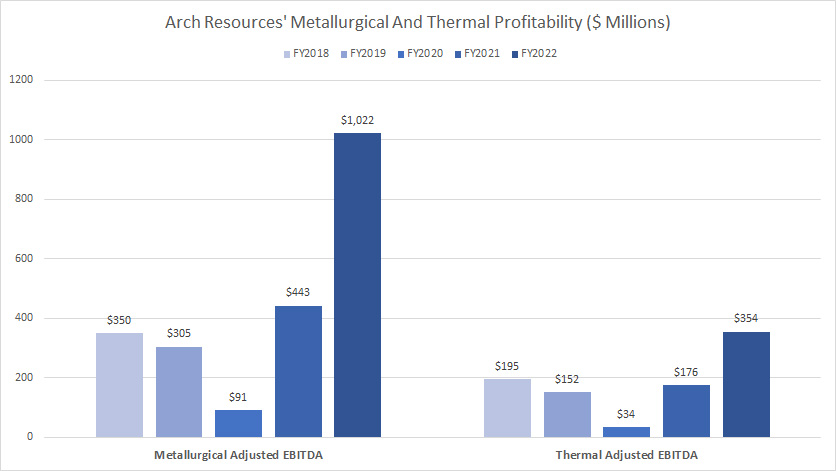
For profitability, we look at Arch Resources’ adjusted EBITDA which is provided by the company in every earnings release.
From the chart, it is very obvious that Arch Resources has much better profitability in the metallurgical segment compared to the thermal segment.
In this context, Arch Resources’ adjusted EBITDA in the metallurgical segment is much higher than those reported in the thermal segment in all fiscal years.
As of 2022, Arch Resouces’ adjusted EBITDA in the metallurgical segment totaled more than $1 billion USD, roughly triple the number generated in the thermal segment.
Arch Resources’ Metallurgical And Thermal Adjusted EBITDA By Percentage
Arch Resources metallurgical and thermal profitability by percentage
(click image to enlarge)
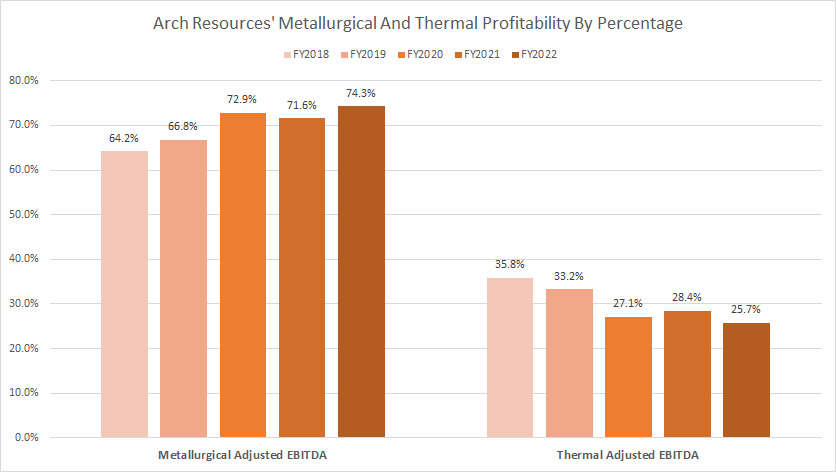
In all fiscal years between 2018 and 2022, Arch Resources’ profit from the metallurgical segment dominated the company’s overall profitability.
This trend applies not only to post-pandemic periods but also to pre-pandemic periods, suggesting that metallurgical mining operations have always contributed the most profit irrespective of the economic conditions.
Also, in all fiscal years, the metallurgical segment accounts for at least 60% of the company’s total adjusted EBITDA and this ratio has been on the rise since 2018.
As of 2022, Arch Resources’ metallurgical segment contributed a whopping 74% of the company’s total adjusted EBITDA, the highest figure that has ever been measured.
Arch Resources’ Metallurgical And Thermal Adjusted EBITDA Margin
Arch Resources metallurgical and thermal margins
(click image to enlarge)
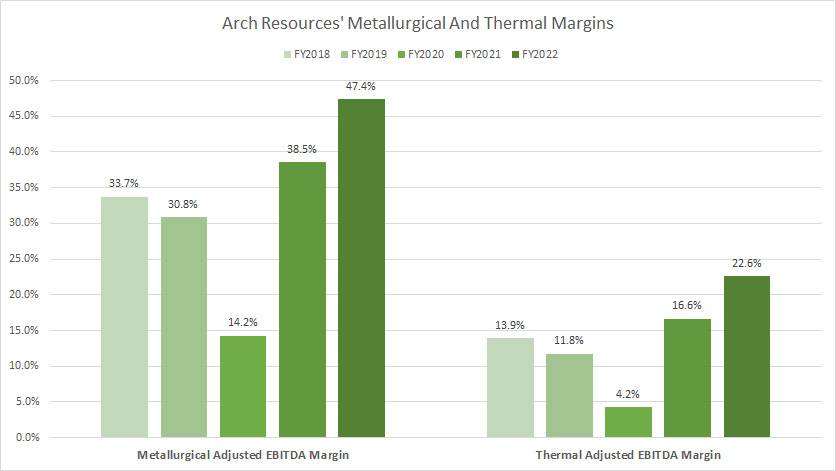
Again, Arch Resources generates much better margins in the metallurgical segment than in the thermal segment, illustrating the much better profitability of the metallurgical mining operations compared to the thermal segment.
As seen in the chart above, Arch Resources’ adjusted EBITDA margin in the metallurgical segment was twice as much as that produced in the thermal segment in most fiscal years.
For example, Arch Resources produced an adjusted EBITDA margin of 47% as of 2022 in the metallurgical segment compared to only 23% produced in the thermal segment.
In short, Arch Resources produces not only higher profits but also higher margins in the metallurgical segment.
Arch Resources’ North America And Seaborne Revenue Further Breakdown
Arch Resources North America and seaborne revenue further breakdown
(click image to enlarge)
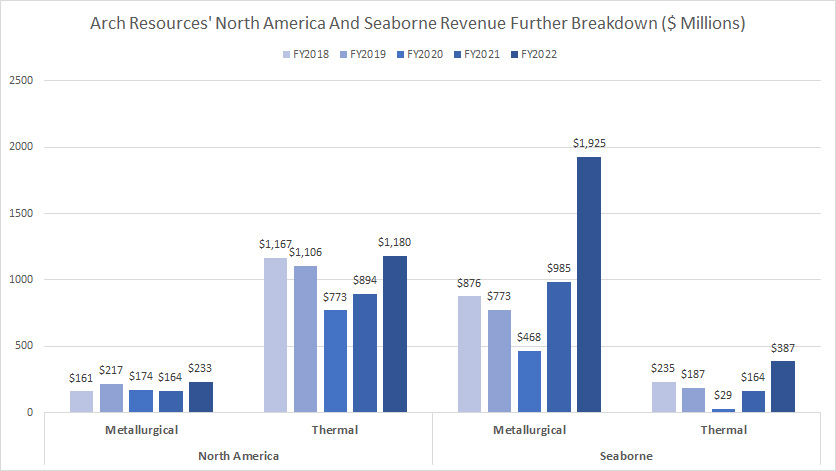
Within the regional revenue, Arch Resources’ North America segment produces much higher thermal revenue than metallurgical revenue.
On the other hand, Arch Resources’ seaborne segment produces much higher metallurgical revenue than thermal revenue.
In other words, Arch Resources exports only a fraction of thermal coal to overseas markets while selling the majority of thermal coal to the domestic market.
On the other hand, Arch Resources consumes only a fraction of metallurgical coal in the domestic market while exporting most of the metallurgical coal to overseas markets.
Arch Resources’ North America And Seaborne Revenue Further Breakdown By Percentage
Arch Resources North America and seaborne revenue further breakdown by percentage
(click image to enlarge)
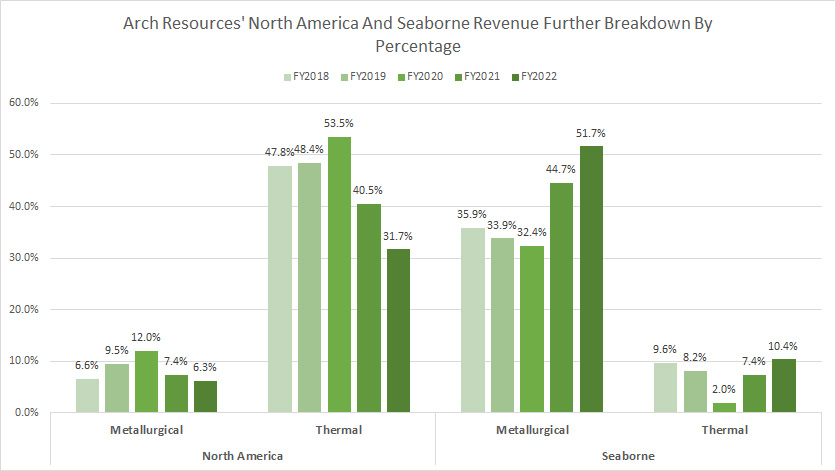
In terms of domestic sales, Arch Resources’ thermal revenue contributes the majority of sales to the North American segment, with the percentage coming in at 32% in fiscal 2022.
For export sales, Arch Resources’ metallurgical revenue accounts for 52% of the segment’s total revenue in fiscal 2022, the largest among all revenue streams.
Arch Resources’ Metallurgical And Thermal Revenue Further Breakdown
Arch Resources metallurgical and thermal revenue further breakdown
(click image to enlarge)
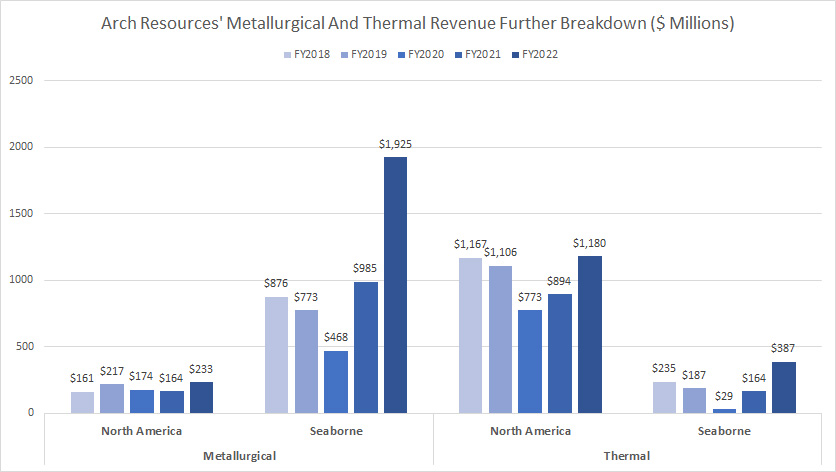
Arch Resources makes the most money from export sales under the metallurgical segment, with revenue figures topping $1.9 billion USD in fiscal 2022.
On the other hand, under the thermal segment, Arch Resources makes the most money from domestic sales, with revenue figures topping $1.2 billion as of fiscal 2022.
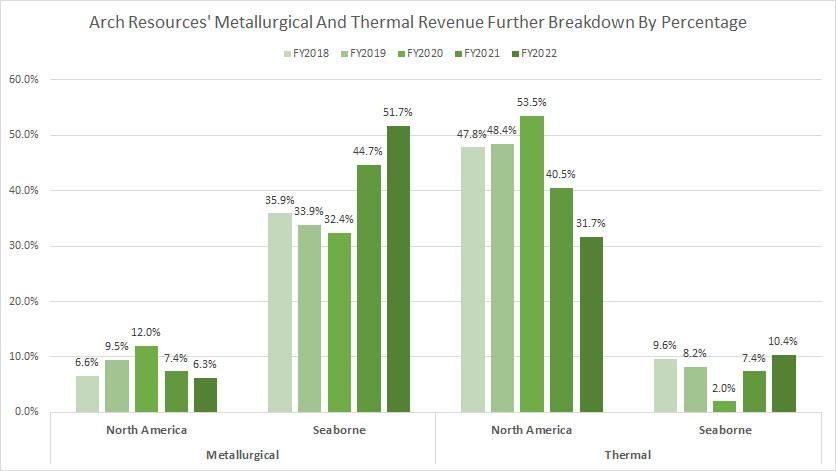
Arch Resources’ Metallurgical And Thermal Revenue Further Breakdown By Percentage
Arch Resources metallurgical and thermal revenue further breakdown by percentage
(click image to enlarge)
Within the metallurgical segment, Arch Resoruces’ seaborne revenue accounts for the majority of sales in this segment, with the percentage figure topping a massive 52% as of 2022.
Under the thermal segment, Arch Resources’ revenue from the North American region accounts for the majority of sales in this segment, contributing 32% of total sales in fiscal 2022.
Summary
To recap, Arch Resources was in a tear in fiscal 2022 as revenue and profitability reached record highs.
Among the thermal and metallurgical segments, Arch Resources makes a lot more money in the metallurgical segment than in the thermal segment.
In this context, Arch Resources derives significantly higher adjusted EBITDA and margin within the metallurgical segment and therefore, has much better profitability in the metallurgical segment.
Again, not only is Arch Resources’ metallurgical segment having higher revenue but also larger profit as well as margin.
References and Credits
1. All financial figures presented in this article were obtained and referenced from Arch Resources’ earnings reports, financial statements, SEC filings, presentations, etc, which are available in the following link:
2. Featured images in this article are obtained from Pixabay.
Disclosure
References and examples such as tables, charts, and diagrams are constantly reviewed to avoid errors, but we cannot warrant the full correctness of all content.
The content in this article is for informational purposes only and is neither a recommendation nor a piece of financial advice to purchase a stock.
If you find the information in this article helpful, please consider sharing it on social media and also provide a link back to this article from any website so that more articles like this one can be created in the future.
Thank you!

