
Ford dealership. Source: Flickr
Ford Motor Company (NYSE:F) is a dividend payer and has been paying cash dividends since 2012. Ford Motor’s shareholders receive quarterly cash dividends on the company’s common stocks.
This article delves into Ford Motor’s dividends and explores several factors that may affect the company’s dividend payout.
That said, we will look at factors that favor Ford’s dividend policy, including those that have enabled the company to pay and raise its dividends consistently.
Apart from the favorable factors, we also look at unfavorable ones that may harm the dividends and make the dividends unsafe.
Let’s dive in!
Please use the table of contents to navigate this page.
Table Of Contents
Definitions And Overview
Favorable Factors
F1. Supplemental Dividends
F2. Growing Vehicle Sale Price
F3. Increasing Sales Of Truck And SUV
F4. A Profitable Company
F5. Expanding Retained Earnings
F6. Cash Flow Rich
F7. Manageable Debt Levels
Unfavorable Factors
U1. An Unreliable Dividend History
U2. Ford Profit And FCF Is Susceptible To Black Swan Events
U3. Deteriorating Vehicle Sales
U4. Declining Market Share In China
Summary And References
S1. Summary
S2. References and Credits
S3. Disclosure
Definitions
To help readers understand the content better, the following terms and glossaries have been provided.
Revenue Per Car: Revenue per car is a financial metric that represents the amount of money a dealership or auto manufacturer earns for each vehicle it sells. It is calculated by dividing the total revenue generated from vehicle sales by the total number of vehicles sold during a specific period.
Companies often use this metric to assess their profitability and make decisions related to pricing, inventory management, and sales strategies. A high revenue per vehicle sold indicates that a company generates more revenue from each sale and is more profitable.
Unsecured Debt: Unsecured debt refers to any debt that is not backed by collateral or assets of the company, such as buildings, land, or equipment. This type of debt is typically issued based on the company’s creditworthiness and ability to make payments rather than on the value of specific assets.
Examples of unsecured debt by corporations include bonds, commercial paper, and unsecured bank loans. In the event of a default, the lender cannot seize any specific company assets to recover the money owed but may take legal action to collect the debt.
Retained Earnings: Retained earnings are the portion of a company’s profits kept by the company instead of being distributed as dividends to shareholders. These earnings can be used to reinvest in the company, pay off debts, or save for future use.
Retained earnings represent the cumulative net income of a company since its inception minus any dividends paid out. They are an important indicator of a company’s financial health and can be found on its balance sheet.
Adjusted EBIT: Ford’s adjusted EBIT refers to earnings before interest and taxes (EBIT) excluding interest on debt (excl. Ford Credit Debt), taxes and pre-tax special items.
This non-GAAP measure is useful to management and investors because it focuses on underlying operating results and trends and improves the comparability of period-over-period results. Ford’s management ordinarily excludes special items from its review of the results of the operating segments for purposes of measuring segment profitability and allocating resources.
Pre-tax special items consist of (i) pension and OPEB remeasurement gains and losses, (ii) gains and losses on investments in equity securities, (iii) significant personnel expenses, supplier- and dealer-related costs, and facility-related charges stemming from efforts to match production capacity and cost structure to market demand and changing model mix, and (iv) other items that they do not necessarily consider to be indicative of earnings from ongoing operating activities.
Adjusted Free Cash Flow: Ford’s adjusted free cash flow is a measure of Ford Total Company’s operating cash flow excluding Ford Credit’s operating cash flows. The measure contains elements management considers operating activities, including Ford Total Company excluding Ford Credit capital spending, Ford Credit distributions to its parent, and settlement of derivatives.
The measure excludes cash outflows for funded pension contributions, restructuring actions, and other items that are considered operating cash flows under GAAP. This measure is useful to management and investors because it is consistent with management’s assessment of Ford Total Company’s operating cash flow performance.
Supplemental Dividends
Ford regular and special dividend
One thing I like about Ford Motor being a dividend payer is the supplemental dividends. Ford Motor has no qualms about declaring a special dividend when business is good.
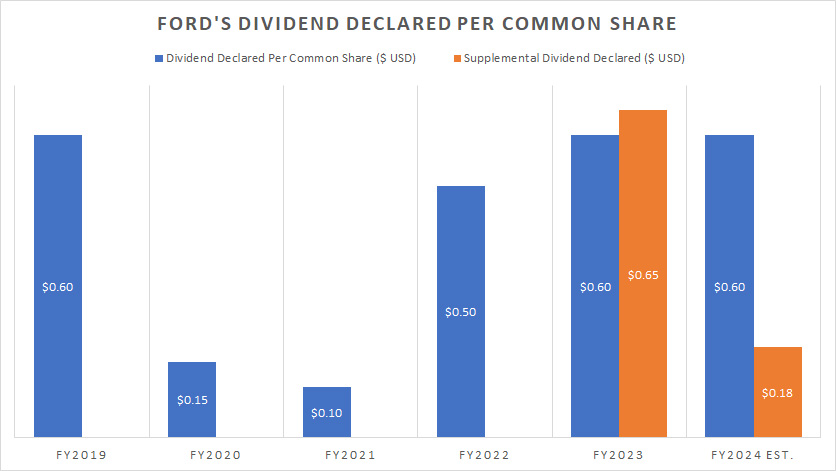
For example, Ford Motor declared a supplemental dividend in Feb 2023, totalling as much as $0.65 per share, as shown in the chart above, possibly the company’s largest dividend ever declared in the past 30 years.
I suppose this special dividend is to compensate for the loss of dividends in 2020 and 2021. For your information, Ford Motor suspended several quarters of cash dividends between 2020 and 2021. It only reinstated the cash dividends by the end of 2021, when business prospects improved.
Subsequently, Ford Motor made massive profits and generated tonnes of cash. As a result, Ford Motor rewarded patient shareholders with a special dividend in 2023. The total cash dividends paid in 2023 totaled as much as US$1.25 per share.
Far from over, Ford declared a special dividend again as of 1Q 2024, totaling US$0.18 per share. The estimated total dividend for 2024 may arrive at US$0.78 per share, assuming Ford’s regular dividend for 2024 is the same as 2023.
The projected dividend yield may reach 6.5% if you own Ford’s stock at $12 per share.
It is worth noting that although Ford has only announced a special dividend in the past five years, it has done so on several occasions. For your information, Ford declared multiple supplemental dividends in 2018, 2017, and 2016, respectively.
Again, Ford Motor is willing to reward its shareholders with supplemental dividends whenever the company earns profits. As a shareholder, you can expect to receive unexpected special dividends from Ford Motor in addition to the regular cash dividend declared on a quarterly basis.
Growing Vehicle Sale Price
Ford vehicle average sale price
The next most important factor impacting Ford Motor being a dividend payer is the growing vehicle sale price. The definition of vehicle sale price or revenue per vehicle is available here: revenue per car.
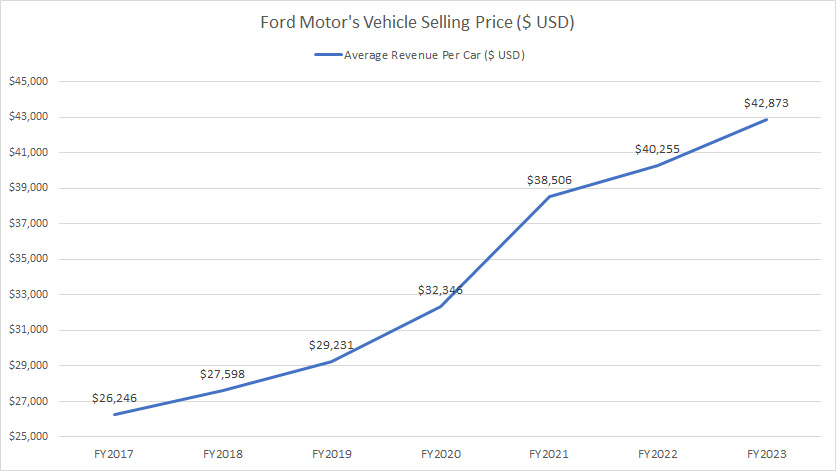
As shown in the chart above, Ford Motor’s revenue per car sold (calculated based on the wholesale volume) has significantly risen since 2017, reaching nearly US$43,000 per vehicle as of 2023. Ford Motor has increased its revenue per car by over 65% in just six years since 2017.
Ford’s ability to raise prices is important because it shows the company has a competitive advantage. Instead of keeping prices down, Ford can increase its vehicle sale price to compete with other automakers while maintaining its market share.
As Ford’s revenue per car rises, its margin and profit also remain firm, if not rises.
Besides generating higher margins and profits, Ford’s increasing revenue per vehicle demonstrates its strong brand power and competitive advantage in the automotive industry. More importantly, consumers are willing to stick with Ford’s products despite the growing sale price.
As a result, Ford’s shareholders should be able to sleep well knowing that the company can maintain a competitive sales price to remain relevant in the automotive industry. Ford’s competitive sale price rewards shareholders with stock price appreciation, cash dividends, and share buybacks.
In short, as Ford Motor raises its revenue per vehicle, the dividends should also increase.
Increasing Sales Of Truck And SUV
Ford truck and SUV sales ratio
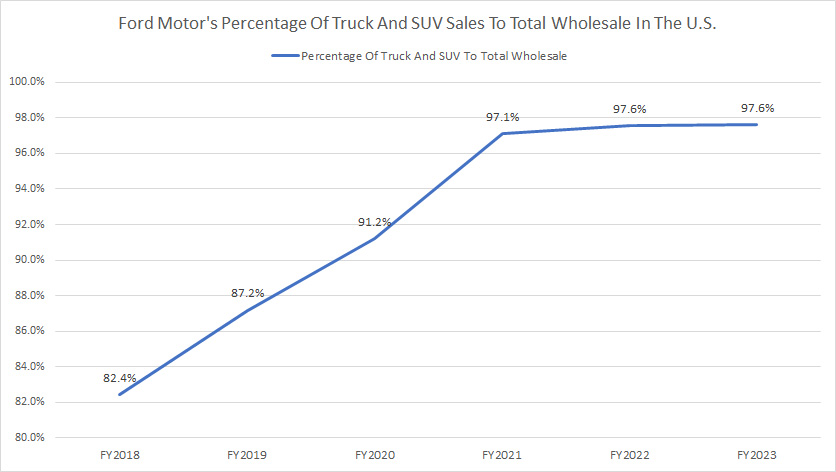
Another factor that makes Ford Motor a safe dividend payer is the company’s increasing truck and SUV sales in the U.S. automotive market. As shown in the chart above, Ford Motor has significantly increased its truck and SUV sales percentage in the U.S. since 2018.
For example, Ford’s percentage of truck and SUV sales to total wholesale has risen to nearly 98% as of 2023 from 82% in 2018. At the same time, Ford Motor has been able to maintain its market share in the U.S. at relatively the same figure all these years, as shown in this article: Ford U.S. market share.
Why is this important for dividend investors? The reason is that trucks and SUVs are the most profitable products for Ford Motor. Here is a quote extracted from Ford Motor’s 2022 annual report regarding truck and SUV profitability:
-
Ford’s results depend on sales of larger, more profitable vehicles, particularly in the United States.
A shift in consumer preferences away from larger, more profitable vehicles with internal combustion engines (including trucks and utilities) to electric or other vehicles in our portfolio that may be less profitable could adversely affect our financial condition or the results of operations.
Ford must prioritize trucks and SUVs since they are its most profitable products, rather than competing in the sedan market. Ford has given up the U.S. sedan market completely.
By doing so, Ford Motor can maximize its profit in trucks and SUVs and maintain its streams of cash dividends for shareholders.
Ford Is Profitable
Ford adjusted EBIT
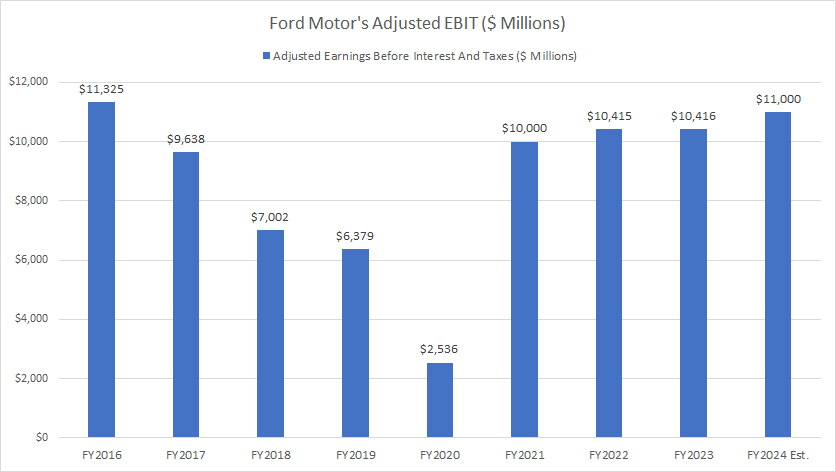
Ford Motor is a profitable company and makes serious money during good times. Ford can definitely afford a dividend payout. As shown in the chart above, Ford has been able to maintain its adjusted EBIT even during the COVID-19 crisis in 2020.
Ford’s definition of adjusted EBIT is available here: adjusted EBIT.
Although profit dived during the pandemic, it quickly recovered the following year and surged to over US$10 billion, even beating pre-pandemic levels.
More importantly, Ford guided for a rising profitability in 2024, at US$11 billion midpoint in adjusted EBIT. This level of profitability should easily cover Ford’s dividends in 2024.
Again, Ford Motor is a profitable company and can comfortably cover the cash dividends in 2024, which should arrive at a minimum of US$0.78 per share, as presented in this section: Ford 2024 dividend.
Expanding Retained Earnings
Ford-Motor-retained-earnings
(click image to expand)
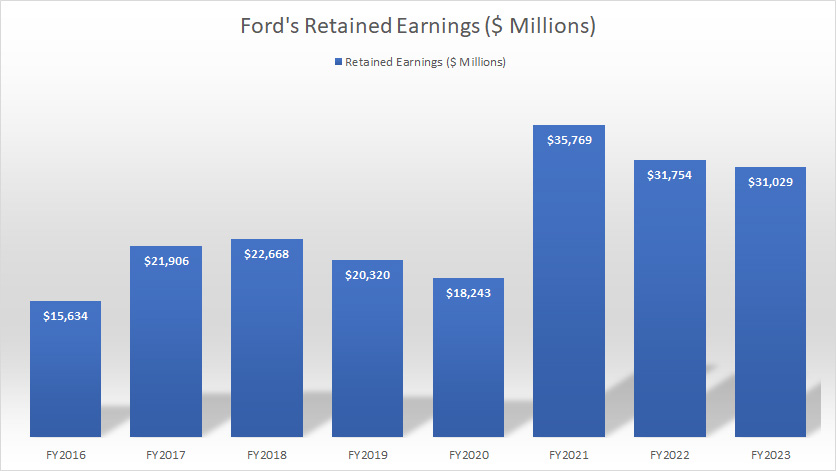
Ford’s retained earnings have significantly increased over the past eight years, from only US$15.6 billion in 2016 to US$31.0 billion in 2023, as shown in the chart above. The definition of retained earnings is available here: retained earnings.
As Ford is profitable and generates tonnes of money, it has been able to retain its earnings or profits, even after accounting for the dividend payments.
Ford’s growing retained earnings are important because they show that the company can afford the dividends while still being able to keep a portion of its profit for re-investment, pay off debt, or for future use in the form of cash or any other type of asset.
Therefore, the case for a safe and stable dividend by Ford Motor looks much stronger when the company can consistently grow its retained earnings over time.
Ford Is Cash Flow Rich
Ford adjusted FCF
Aside from being profitable, Ford Motor is cash flow rich. The definition of Ford’s adjusted free cash flow is available here: adjusted free cash flow.
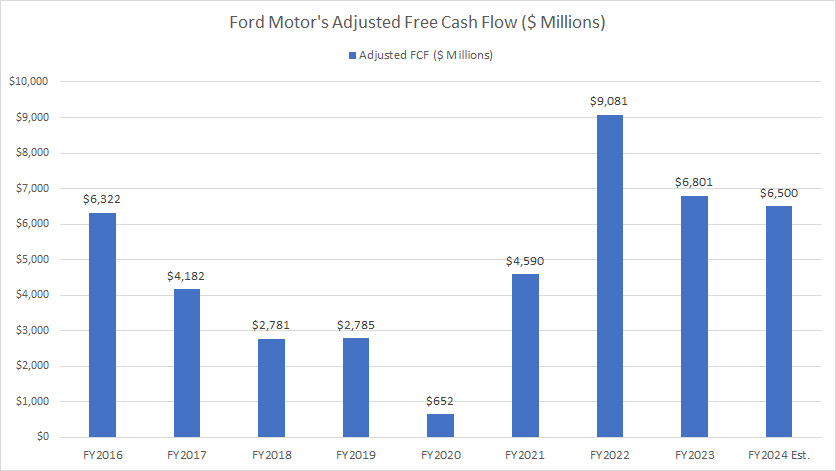
As shown in the chart above, Ford generates solid free cash flow, even during the COVID crisis.
Although free cash flow dived during the COVID period, it quickly recovered in the following years and surged to over US$9 billion in 2022.
Ford’s surging free cash flow in post-pandemic time shows that the company can produce solid cash flow when business prospects are good. Ford’s massive free cash flow of US$6.5 billion in 2024 (guided by the company) should easily cover the 2024 cash dividends, which are estimated to cost the company US$3 billion.
Manageable Debt Levels
Ford unsecured debt leverage
Ford Motor was US$142.7 billion in debt as of 3Q 2023, according to this article: Ford’s debt concern. While the amount is huge, it has significantly declined in the past several years, according to the same article.
Of this amount, only US$92 billion, or 64% of the total, was unsecured debt. The definition of unsecured debt is available here: unsecured debt.
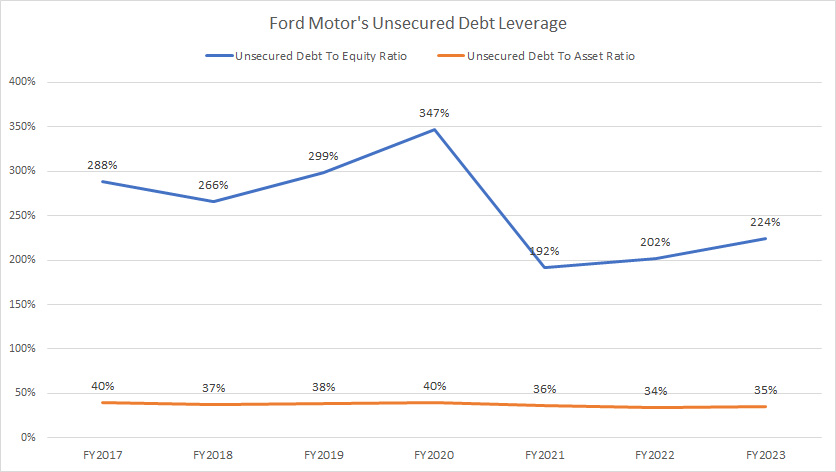
If you look at Ford’s debt leverage, as presented in the chart above, its unsecured debt leverage has steadily decreased since 2017, demonstrating that the company relies less on debt and more on equity to finance its operations. From the asset perspective, Ford’s unsecured debt also has steadily declined.
The decreasing ratios may suggest less financial leverage being used to fund the business, which can lead to greater stability and resilience in the face of economic challenges.
In addition, Ford’s total liquidity in 2023 is sufficient to service its indebtedness until 2025, according to the same article: Ford’s debt concern.
Therefore, Ford Motor’s shareholders should be glad to know that Ford’s massive debt does not threaten its generous dividend policy.
An Unreliable Dividend History
Ford dividend history
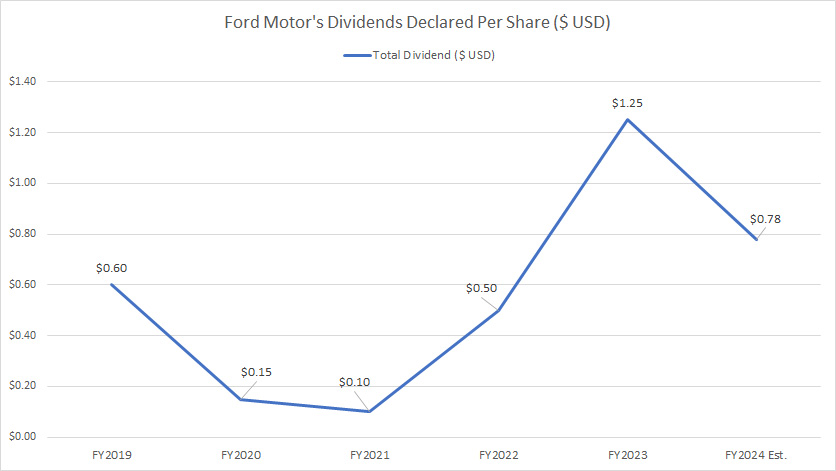
One thing I don’t like about Ford’s dividend is the inconsistent dividend history. As shown in the chart above, Ford suspended its dividends several times during the height of the COVID crisis between 2019 and 2023.
That said, Ford’s dividends were down to only $0.10 and $0.15 per share in 2021 and 2020, respectively, after several suspensions in the same period.
Ford reinstated its dividend to pre-pandemic levels only in 2023. The good news is that Ford more than doubled its dividends in 2023 to $1.25 per share, essentially making up for the dividend loss in 2021 and 2020. Shareholders who waited out the crisis would reap the massive capital returns.
Although Ford prioritizes boosting dividends when business is good, it will not hesitate to suspend it in a crisis. The message is that Ford Motor’s dividends are vulnerable to external factors and are not immune to an economic downturn or any event that disrupts economic activities.
Unlike Altria Group and Philip Morris International, whose dividends were probably immune and even increased during the COVID-19 crisis, Ford Motor may not be as resilient as expected.
Therefore, dividend investors should note that Ford’s dividends can be broken and totally disrupted.
Ford Profit And FCF Is Susceptible To Black Swan Events
Ford profit and cash flow
The definitions of Ford’s adjusted EBIT and adjusted FCF are available here: adjusted EBIT and adjusted FCF.
Although Ford Motor is profitable and generates massive free cash flow, it is susceptible to any black swan event, including economic downturns, pandemics, and wars.
As seen in the chart above, Ford’s profit and free cash flow were seriously disrupted during the COVID-19 pandemic in 2020. In 2020, Ford Motor’s adjusted EBIT and FCF decreased to US$2.5 billion and US$652 million, respectively, a record low since 2016. As a result of the decrease in profit and free cash flow, Ford suspended its dividends for several quarters.
In the future, Ford can be impacted by similar events or any other event that can disrupt economic activities. Again, dividend investors must know that Ford Motor’s business may not be as tough and solid as expected.
Ford’s Deteriorating Vehicle Sales
Ford-Motor-global-and-regional-vehicle-sales
(click image to expand)
Investors interested in Ford’s vehicle wholesale may find more information on this page: Ford’s vehicle wholesale by type and powertrain.
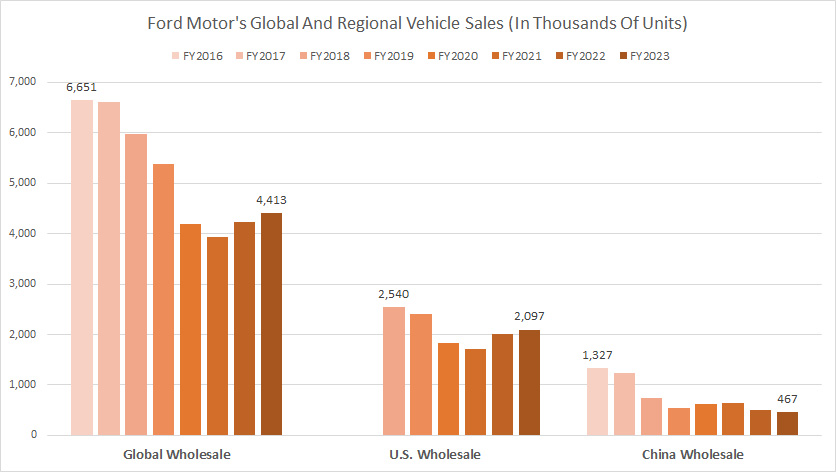
Ford’s vehicle wholesales globally have significantly deteriorated since 2016, reaching one of the record lows as of 2023. Although sales have recovered in recent years, they are far from the historical highs, as shown in the chart above. The bad news is that they may never return to their previous highs.
Moreover, Ford’s most important market, the U.S., has also experienced a significant decrease in sales. The chart shows that Ford’s U.S. sales have decreased from 2.5 million in 2018 to 2.1 million in 2023, down 16% over five years.
In addition, Ford performed even worse in its second most important market, China. As seen, Ford’s vehicle wholesales in China have reduced by more than half since 2016. As of 2023, Ford delivered only 467,000 vehicles in China, a pathetic figure compared to 1.3 million vehicles in 2016.
Ford’s deteriorating vehicle sales globally, in the U.S. and in China, do not bode well for the company’s generous dividend policy. If sales keep decreasing, the dividends may follow suit.
Ford’s Declining Market Share In China
Ford-Motor-China-market-share
(click image to expand)
Investors interested in Ford’s market share may find more information on this page: Ford’s worldwide market share.
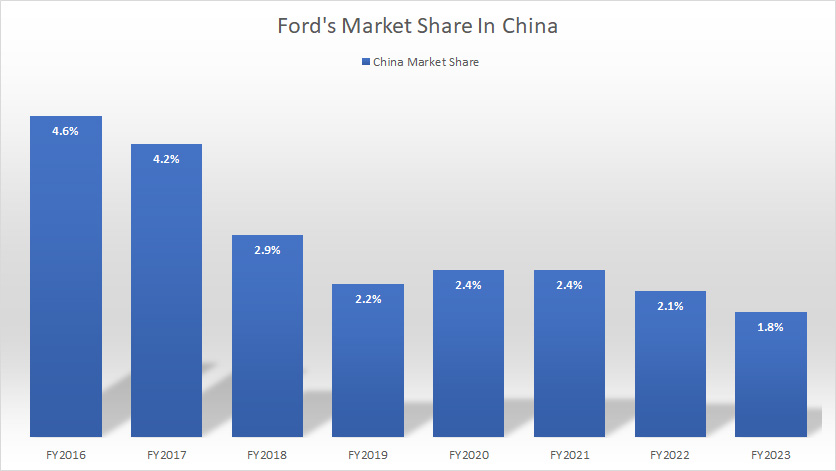
Ford has experienced a significant decline in market share in its second most important market, China. Although Ford’s vehicle sales in China are far smaller than in the U.S., China is the world’s largest automobile market, with new vehicle sales arriving at nearly 27 million vehicles in 2022, according to Car Logos. According to the same article, the U.S. trailed China by a massive 13 million vehicles, with sales topping 14 million units as of 2022.
If Ford aims to boost its dividends, it has to increase its profit and free cash flow. The easiest way to do this is to increase the market share in the world’s largest automobile market. The bad news is that Ford’s market share in this region has significantly declined and reached only 1.8% as of 2023, down considerably from 4.6% in 2016.
If Ford can’t even maintain its market share in China, let alone grow, it will be difficult for the company to boost its profit and free cash flow. Although Ford can rely on the U.S. market, the U.S. automobile market has reached saturation and been on the decline, according to CNBC.
Therefore, Ford must work on its performance in China and try to gain market share. Ford may have to exit the Chinese market if its market share declines further.
Whether Ford can maintain and increase its dividends ultimately depends on its performance in China.
Summary
Overall, while Ford has had some ups and downs when it comes to dividend payments, it remains a company with a long history of paying dividends and a commitment to returning capital to shareholders.
References and Credits
1. All financial figures presented in this article were obtained and referenced from Ford Motor’s quarterly and annual reports, investor presentations, press releases, earnings reports, news, etc., which are available in the following link: Ford’s Financials and Filings.
2. Featured images in this article are used under the Creative Commons license and sourced from the following websites: Mike Mozart and Francis Bijl
Disclosure
References and examples such as tables, charts, and diagrams are constantly reviewed to avoid errors, but we cannot warrant the total correctness of all content.
The content in this article is for informational purposes only and is neither a recommendation nor a piece of financial advice to purchase a stock.
If you find the information in this article helpful, please consider sharing it on social media and provide a link to this article from any website so that more articles like this can be created.
Thank you!


I stuck with Ford, but share dilution, a treading water stock price, and now no dividend has been a body blow. Very, very disappointed in Ford. Compared to Tesla, a company Ford wishes to challenge, one share of Ford is 13.90 compared to 722 for Tesla, a paltry 1.925 percent of Tesla’s stock price. Lots of talk, betrayal of investors.