
Edmonton Motor Show 2017. Source: Flickr Image
The debt portion of a company is often a hot topic. The reason is that debt is usually the leading cause of bankruptcy for most companies.
It’s no exception for Ford Motor Company (NYSE: F). Ford could go bankrupt if it is unable to repay its debts.
This article explore several statistics related to Ford’s debt, including the total debt, debt breakdown, cash, net debt, leverage ratios, capital structure, liquidity, etc.
Notably, we will drill into Ford’s $150 billion debt to find out if this debt level concerns shareholders.
Let’s get started!
Please use the table of contents to navigate this page.
Table Of Contents
Definitions And Overview
O2. How Does Ford Use Its Debt?
Debt
A1. Total Debt
A2. Debt Breakdown
A3. Ford Credit Debt
A4. Total Debt Adjusted For Unsecured Portions
Cash
B1. Available Cash
Net Debt
Leverage
D1. Debt To Equity And Asset Ratio
Debt Vs Revenue
E1. Adjusted Debt Vs Revenue
E2. Debt Margin
Debt Schedules, Liquidity And Credit Rating
G1. Debt Due
G2. Sources Of Liquidity
G3. Credit Rating
Summary And Reference
S1. Conclusion
S2. References and Credits
S3. Disclosure
Definitions
To help readers understand the content better, the following terms and glossaries have been provided.
Unsecured Debt: Unsecured debt for companies like Ford is similar in principle to unsecured debt for individuals, but it involves a larger scale and different implications due to the nature of the companies being publicly traded. Here’s what it entails:
1. Nature of Unsecured Debt: Just like with personal unsecured debt, unsecured corporate debt does not require the company to provide collateral. This means the debt is based on the company’s creditworthiness and financial health rather than specific assets.
2. Instruments: Common forms of unsecured debt for publicly listed companies include corporate bonds, debentures, and commercial paper. These instruments are used to raise capital without pledging company assets.
3. Interest Rates and Credit Ratings: Since unsecured debt poses a higher risk to lenders, it typically comes with higher interest rates compared to secured debt. The interest rate a company can obtain is influenced by its credit rating, which is assessed by rating agencies like Moody’s, S&P, and Fitch. A higher credit rating indicates lower risk and therefore can result in lower interest rates for the company.
4. Use of Funds: Companies use unsecured debt to finance various activities, including expansion projects, research and development, acquisitions, and general corporate purposes. It provides flexibility without the risk of losing specific assets.
5. Investor Considerations: For investors, unsecured debt offers the potential for higher returns, but also comes with higher risk compared to secured debt. In the event of bankruptcy, unsecured creditors are paid after secured creditors, which means they might recover less of their investment.
Unsecured debt plays a crucial role in a company’s capital structure, offering flexibility and opportunities for growth while balancing the risk and cost of borrowing.
Asset-Backed Debt: Asset-backed debt, or asset-backed securities (ABS), for a corporation is a type of debt obligation secured by a pool of assets. These assets are typically financial instruments like loans, leases, credit card receivables, or other forms of debt owed to the corporation. Here’s a breakdown of what this entails:
1. Collateralization: The primary feature of asset-backed debt is that it is collateralized by a pool of underlying assets. This means that if the corporation defaults on the debt, the lenders have a claim on these assets.
2. Asset Pools: The assets that back this type of debt can vary widely. Common examples include:
– Auto Loans: Loans made to consumers for the purchase of vehicles.
– Credit Card Receivables: Outstanding credit card balances owed by consumers.
– Mortgages: Residential or commercial mortgage loans.
– Student Loans: Loans made to students to finance their education.
3. Securitization: The process of creating asset-backed debt involves securitization. The corporation pools together its receivables or other assets, packages them into securities, and sells these securities to investors. This process allows the corporation to convert its assets into cash, which can be used for further investment or operational needs.
4. Risk and Return: Asset-backed debt typically offers a higher level of security to investors compared to unsecured debt because it is backed by tangible assets. However, the quality and risk of the underlying assets can vary, affecting the interest rate and attractiveness to investors.
5. Liquidity: For the issuing corporation, asset-backed debt can be an attractive way to raise capital because it often provides a relatively low-cost financing option and can improve liquidity by converting illiquid assets into cash.
6. Regulation and Compliance: Issuing asset-backed securities requires adherence to specific regulations and accounting standards to ensure transparency and protect investors.
Asset-backed debt is a crucial tool for corporations to manage their balance sheets and finance their operations efficiently. It allows companies to unlock the value of their assets, providing a more flexible and diversified funding option.
How Does Ford Use Its Debt?
Ford uses its debt strategically to support its business operations and growth initiatives. Here are some key ways Ford manages and utilizes its debt:
1. Debt Reduction: Ford actively works on reducing its debt. For example, in 2021, Ford announced a debt reduction of $7.6 billion through cash tender offers and planned redemptions of its outstanding notes. This helps lower interest expenses and improve financial stability.
2. Capital Investments: Ford uses debt to finance capital investments, such as new manufacturing facilities, research and development, and technology upgrades. This is crucial for staying competitive in the automotive industry, especially with the shift towards electric vehicles (EVs) and autonomous driving technologies.
3. Working Capital: Debt is used to manage working capital needs, ensuring that Ford has sufficient liquidity to meet its short-term obligations, such as paying suppliers and covering operational expenses.
4. Strategic Acquisitions: Ford may use debt to fund acquisitions or partnerships that can enhance its product offerings, expand its market presence, or provide access to new technologies.
5. Refinancing: Ford periodically refinances its existing debt to take advantage of lower interest rates or more favorable terms. This can help reduce overall borrowing costs and extend the maturity of its debt.
6. Maintaining Credit Ratings: By managing its debt effectively, Ford aims to maintain strong credit ratings, which can lower borrowing costs and provide access to capital markets on favorable terms.
Ford’s debt management strategy is part of its broader plan to improve business resilience, efficiency, and growth. The company is focused on generating strong free cash flow and achieving profitable growth across its various business segments.
Total Debt
Ford total debt
(click image to expand)
Ford’s total debt consists of debt from Ford Credit and debt from Company Excluding Ford Credit.
Ford Credit is the captive finance arm of Ford Motor, while Company Excluding Ford Credit refers to subsidiaries excluding Ford Credit but primarily refers to Automotive.
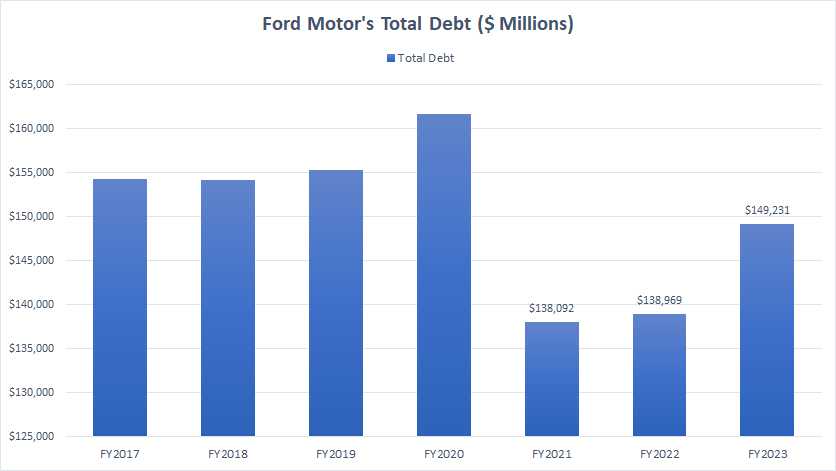
As of the end of fiscal year 2023, Ford’s total debt reached $149 billion, up $10 billion or 7% over a year ago. Of this amount, $49 billion was payable within a year, while US$100 billion was long-term debt.
Between 2017 and 2023, Ford’s total debt has peaked at over $$160 billion in 2020. Since 2020, Ford’s debt has been on the decline. However, it significantly increased by the end of 2023.
Debt Breakdown
Ford debt breakdown
(click image to expand)
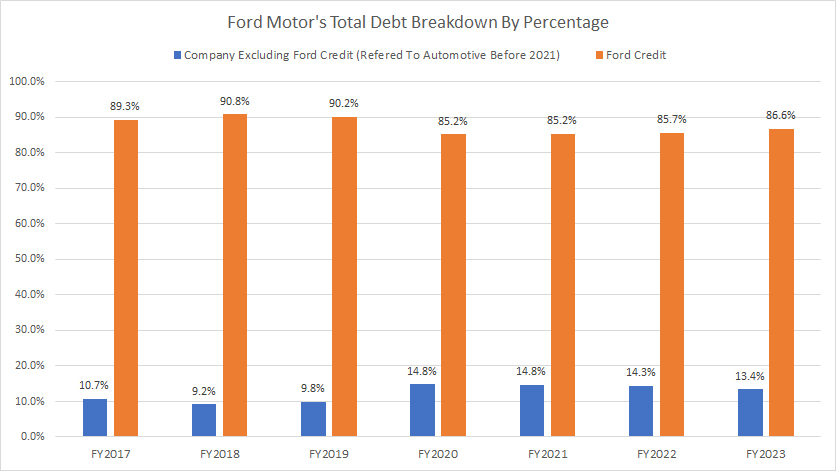
The chart above shows the debt breakdown of Ford Motor Company.
Ford’s debt was divided into two segments: Ford Credit and Company Excluding Ford Credit.
Ford Credit is the subsidiary that provides financial services. Company Excluding Ford Credit refers to subsidiaries excluding Ford Credit but relates primarily to Automotive that manufactures and markets cars and vehicles.
Accordingly, Ford Credit’s debt forms the biggest portion of the company’s debt, at $129 billion or 86% as of the end of fiscal year 2023. On the other hand, Company Excluding Ford Credit’s debt made up only $20 billion or 13% of the total debt in the same period.
Compared to the debt level a year ago, Ford Credit’s debt portion rose slightly higher, from 85.7% to 86.6%. On the other hand, Company Excluding Ford Credit’s debt was slightly lower in 2023 over 2022.
Compared to the debt levels in 2017, Ford Credit’s portion was significantly lower while the portion from Company Excluding Ford Credit was much higher.
Ford Credit Debt
Ford Credit’s debt
(click image to expand)
The definitions of unsecured debt and asset-backed debt are available here: unsecured debt and asset-backed debt.
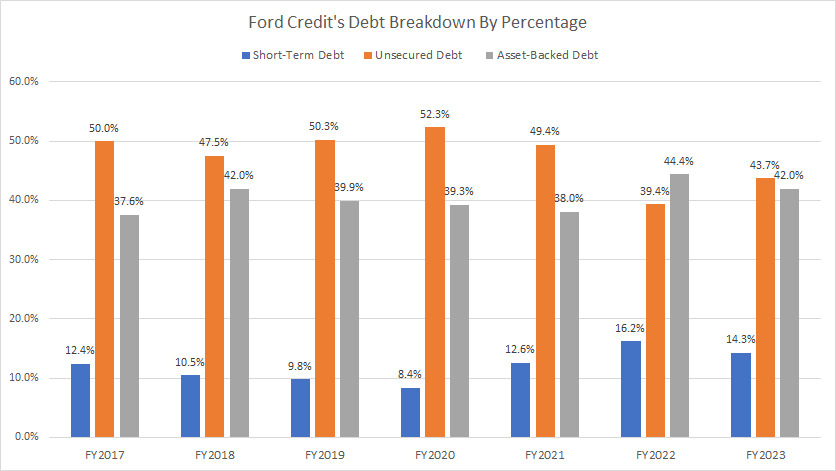
Unsecured debt forms the majority of Ford Credit’s debt, as shown in the chart above. However, in recent years, Ford Credit’s unsecured debt portion has steadily declined while asset-backed debt portion has steadily increased.
In 2023, Ford Credit’s unsecured debt and asset-back debt accounted for nearly the same portion, as shown in the chart above, while short-term debt made up about 14% of its total debt.
According to Ford Credit, asset-backed debt is defined as:
- Term Asset-Backed Securities (as shown in the Funding Structure table) – Obligations issued in securitization transactions that are payable only out of collections on the underlying securitized assets and related enhancements.
The following snapshot shows the assets and liabilities portions of Ford Credit’s asset-backed loans.
Ford Credit’s asset-backed debt
(click image to expand)
As shown in the snapshot above, Ford Credit’s asset-backed debt was secured by tonnes of assets, and the asset portions were much greater than the liability portions.
As a result, Ford Credit’s asset-backed debt is relatively safe because the assets backing these loans are readily available.
Unlike unsecured debt, Ford Credit’s asset-backed debt is repaid by cash generated from the respective assets, i.e., finance receivables and operating leases.
On the other hand, Ford Credit’s unsecured loans are repaid by cash generated from its business operations. Therefore, we should only be concerned with Ford Credit’s unsecured and short-term debt.
Total Debt Adjusted For Unsecured Portions
Ford-Motor-adjusted-debt
(click image to expand)
The definitions of unsecured debt and asset-backed debt are available here: unsecured debt and asset-backed debt.
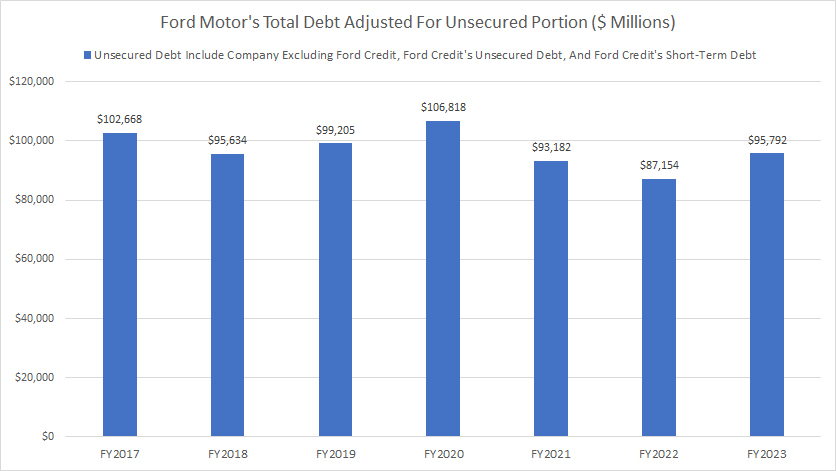
Adjusted for unsecured portions, Company Excluding Ford Credit, and short-term portion, Ford Motor’s debt (risky portion) came in at just $96 billion as of the end of fiscal year 2023, a far lower figure than the original debt figure of $149 billion which we saw in earlier discussions, as shown in the chart above.
Therefore, as outlined in the earlier discussion, we should only be concerned with Ford Motor’s unsecured debt portion of $96 billion, not $149 billion.
The good news is that Ford Motor’s unsecured debt has remained relatively stable over the last several years, as depicted in the chart above. In fact, the unsecured portion has sligtly come lower in recent years.
Available Cash
Ford-Motor-available-cash
(click image to expand)
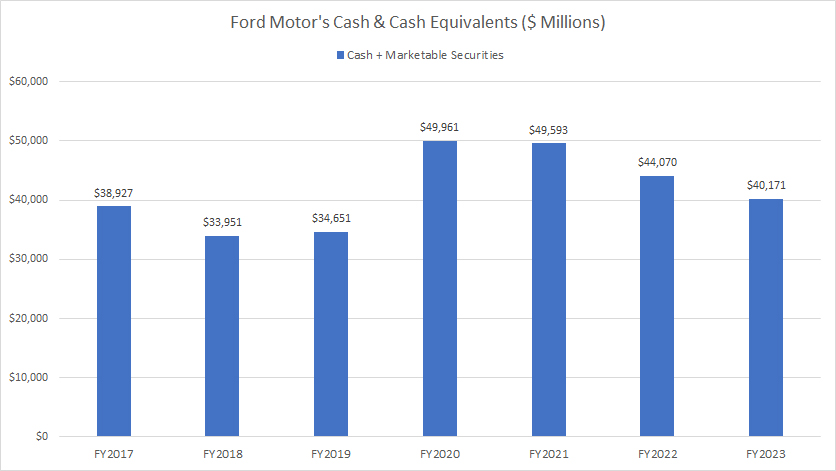
As of the end of 2023, Ford Motor has $40 billion cash & cash equivalents, down 10% over the prior year.
Of this amount, $25 billion was cash while $15 billion was marketable securities.
Investors interested in the statistics of Ford’s cash flow and cash on hand may visit this page: Ford Cash Flow And Cash On Hand.
Adjusted Debt Less Cash
Ford net debt
(click image to expand)
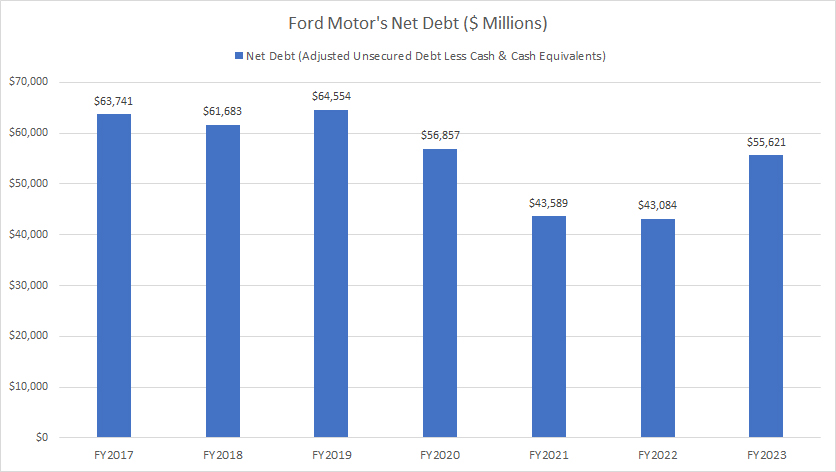
Ford’s net debt equals adjusted unsecured debt less available cash & cash equivalents, as shown in the following equation:
Ford’s Net Debt = Adjusted Unsecured Debt – Cash & Cash Equivalents
Ford’s adjusted unsecured debt is the total debt adjusted to exclude secured debt, as presented in prior discussions.
That said, Ford’s net debt came in at $55.6 billion as of the end of 2023 after adjusting for cash & cash equivalents, up 30% year-over-year
Therefore, Ford’s net debt has significantly risen in the last several years.
Debt To Equity And Asset Ratio
Ford debt to equity ratio
(click image to expand)
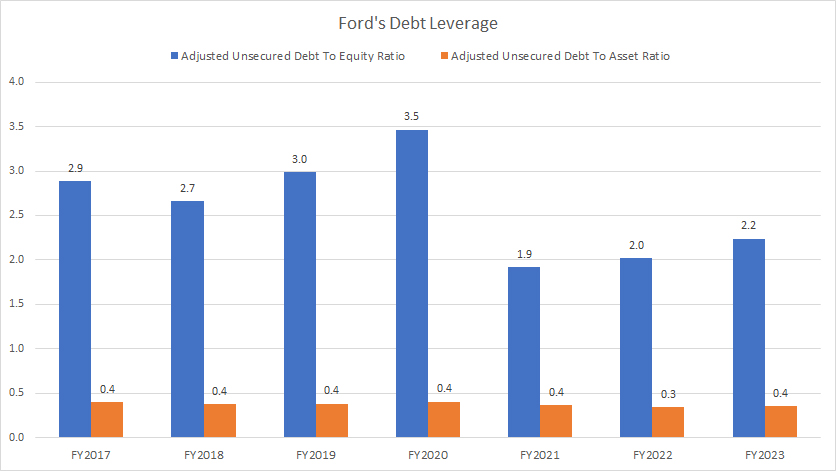
Ford’s adjusted unsecured debt made up 2.2X of equity and 0.4X of assets in fiscal year 2023, as shown in the formula below:
Particularly, Ford’s latest debt-to-equity ratio was much lower than the results recorded in pre-pandemic periods.
In short, Ford’s debt leverage was considered modest, with a ratio of only 2.2X.
Adjusted Debt Vs Revenue
Ford-Motor-debt-vs-revenue
(click image to expand)
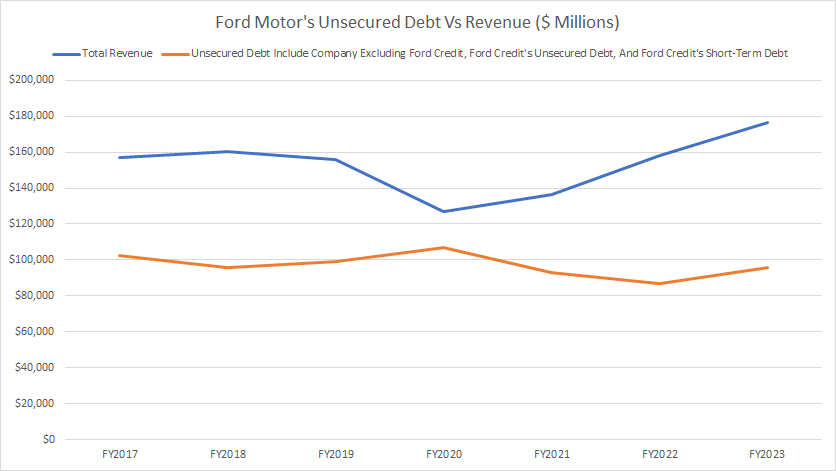
Ford’s revenue has considerably grown in post-pandemic periods since fiscal 2021.
In contrast, Ford’s adjusted debt has slightly decreased during post-pandemic periods, suggesting manageable and moderating debt levels.
Therefore, the trends are favorable for Ford Motor Company and its shareholders, as they indicate improving fundamentals and business prospects.
Debt Margin
Ford-Motor-debt-margin
(click image to expand)
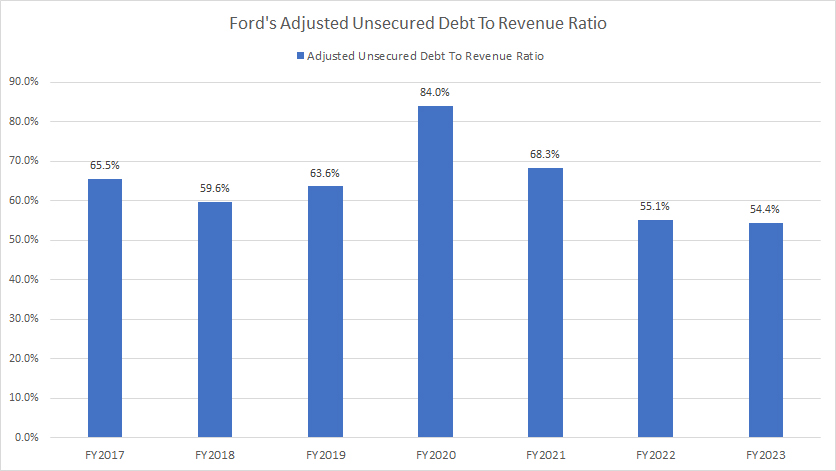
Ford’s debt margin equals adjusted total debt divided by revenue.
As of the end of 2023, Ford’s debt margin was 54%, the lowest ratio ever recorded since 2017.
In addition, Ford’s debt margin also has significantly declined since 2020, implying an improving financial health in the post-pandemic periods.
Debt Due
Ford’s payments due data are obtained from the 2023 annual report dated 31 Dec 2023.
| Fiscal Year | Payments Due (US$ Millions) | ||
|---|---|---|---|
| Company Excluding Ford Credit | Ford Credit | Total Company | |
| 2024 | $3,431 | $35,342 | $38,773 |
| 2025 – 2026 | $10,618 | $58,878 | $69,496 |
| 2027 – 2028 | $4,880 | $20,958 | $25,838 |
| Thereafter | $23,701 | $10,095 | $33,796 |
The table above depicts Ford’s payments due between fiscal 2024 and 2028.
Keep in mind that the payments due shown in the table above are consolidated figures. They include various types of payments, including debt, interest expenses, leases, pension funding, and off-balance sheet items such as purchase obligations.
That said, Ford’s payments due are separated into two categories: Company Excluding Ford Credit and Ford Credit.
Ford Credit’s payments appears to account for the majority of the total due.
That said, Ford’s total payments due in 2024 totaled $39 billion, while that between fiscal 2025 and 2026 totaled $69 billion.
Therefore, the total amount due between fiscal 2024 and 2026 is $110 billion, and it averages about $37 billion per annum from 2024 to 2026.
Can Ford Motor afford the payments due? We will find out in the next discussion.
Sources Of Liquidity
Ford’s liquidity data are obtained from the 2023 annual report dated 31 Dec 2023.
| Sources Of Liquidity | US$ Billions | |
|---|---|---|
| Committed Capacity | Available Capacity | |
| Company Excluding Ford Credit | ||
| Company Cash | – | $28.8 |
| Total Borrowing Capacity | – | $46.4 |
| Total Company Excluding Ford Credit | – | $75.2 |
| Ford Credit | ||
| Cash | $10.9 | $8.1 |
| Total Borrowing Capacity | $45.3 | $17.4 |
| Total Ford Credit | $56.2 | $25.5 |
| Cash Flow | ||
| Consolidated Operating Cash Flow | – | $12.7 (estimated) |
| Total Liquidity | ||
| Total | – | $113.4 |
Ford Company Excluding Ford Credit’s sources of liquidity include cash, borrowing capacity, and cash provided by operating activities.
Similarly, Ford Credit’s sources of liquidity include cash, borrowing capacity, and cash provided by operating activities.
On a consolidated basis, Ford’s liquidity totaled U$113 billion as of fiscal year 2023.
With this level of liquidity, Ford can easily cover its payments, which average only $37 billion per year between fiscal year 2024 and 2026, as seen in the previous section.
Even without including operating cash flow, Ford’s liquidity is over $100 billion and can cover upcoming payments for the next three years.
In short, Ford Motor has sufficient liquidity to meet all payment obligations through at least fiscal 2026.
Credit Rating
Ford’s credit rating as of 31 Dec 2023.
| Ratings For Ford Motor Company | ||||
|---|---|---|---|---|
| Rating Agencies | Types Of Debt | Outlook | ||
| Issuer Default/Corporate | Long-Term Senior Unsecured | |||
| DBRS | BBB (Low) | BBB (Low) | Stable | |
| Fitch | BBB- | BBB- | Stable | |
| Moody’s | – | Ba1 | Stable | |
| Standard & Poor’s | BBB- | BBB- | Stable | |
| Ratings For Ford Credit | ||||
|---|---|---|---|---|
| Rating Agencies | Types Of Debt | Outlook | ||
| Long-Term Senior Unsecured | Short-Term Unsecured | |||
| DBRS | BBB (Low) | R-2 (Low) | Stable | |
| Fitch | BBB- | F3 | Stable | |
| Moody’s | Ba1 | NP | Stable | |
| Standard & Poor’s | BBB- | A-3 | Stable | |
On October 30, 2023, S&P upgraded the credit ratings for Ford and Ford Credit to BBB- from BB+ and revised the outlook to stable from positive.
Ford Motor Company and Ford Credit obtained investment-grade ratings for its long-term senior unsecured debt from DBRS, Fitch, and Standard & Poor’s while getting non-investment-grade ratings from Moody.
DBRS credit rating definitions can be found here – DBRS.
Fitch credit rating definitions can be found here – Fitch.
Moody’s credit rating definitions can be found here – Moody’s.
Standard & Poor’s credit rating definitions can be found here – Understanding Credit Ratings.
Summary
Although Ford’s debt reached $149B as of 2023, the unsecured portion totaled only $96B, a far lower number than the total debt.
Moreover, Ford’s debt-to-equity ratio remains relatively low at 2.2X when looking solely at the unsecured debt. After adjusting for cash, Ford’s net debt came in at only $56 billion, a much smaller figure than the total debt. Therefore, Ford’s debt leverage is relatively low when considering only the unsecured portions.
Besides that, Ford’s business prospects also has improved during the post-pandemic periods, as seen in the rising revenue and decreasing debt margin.
In addition, Ford’s latest liquidity is far higher than the debt amount due. For example, Ford’s total liquidity of $113 billion, measured as of 31 Dec 2023, is sufficient to cover all payments due through 2026.
Additionally, Ford and Ford Credit obtained investment-grade ratings from three major credit agencies for its senior unsecured debt as of 31 Dec 2023.
Is Ford Motor’s $149 billion debt a cause for concern? In my opinion, Ford’s $149 billion debt as of 31 Dec 2023 should not be a concern based on the factors discussed.
References and Credits
1. All financial figures presented in this article were obtained and referenced from Ford Motor’s earning releases, shareholders letters, investor presentations, quarterly and annual reports, etc., which are available in Ford Earnings Releases and Presentations.
2. Featured images in this article are used under a Creative Commons license and sourced from the following websites: IQRemix and Alan Cleaver.
Disclosure
References and examples such as tables, charts, and diagrams are constantly reviewed to avoid errors, but we cannot warrant the total correctness of all content.
The content in this article is for informational purposes only and is neither a recommendation nor a piece of financial advice to purchase a stock.
If you find the information in this article helpful, please consider sharing it on social media and provide a link back to this article from any website so that more articles like this can be created in the future.
Thank you!


This post raises some important points about Ford’s debt situation. While $149 billion is a significant figure, I’m curious about how the company’s cash flow and assets stack up against this debt. Are they managing to stay profitable despite these obligations? It would be interesting to explore the long-term implications of their debt strategy. Thank you for the insightful analysis!