GM Cruise autonomous vehicle. Source: Flickr
Liquidity is the lifeblood of any business. Without sufficient liquidity or cash flow, even a profitable company can face the threat of bankruptcy.
This holds particularly true for General Motors (NYSE:GM), an assets-heavy auto manufacturer that demands substantial working capital to operate efficiently
To highlight the importance of liquidity, GM took decisive measures during the COVID-19 crisis in 2020. The company indefinitely halted its share buyback program and dividend payouts, prioritizing cash preservation to maintain its financial stability.
Let’s dive into GM’s liquidity ratios!
It’s important to note that these ratios are designed to evaluate a company’s short-term liquidity, typically covering a period of up to one year from the reporting date of its financial statements
For other key statistics of General Motors, you may find more information on these pages:
Global Sales & Market Share
Wholesale
U.S. Sales & Market Share
- EV sales by model and EV market share,
- Sales of truck, car, and crossover,
- Market share of truck, sedan, and crossover,
Revenue
Profit Margin
Debt
GM China Statistics
Other Statistics
- GM vs Tesla: vehicle profit and margin analysis,
- GM inventory levels, inventory days and turnover ratio,
- GM cash reserves and cash flow analysis
Please use the table of contents to navigate this page.
Table Of Contents
Definitions And Overview
Liquidity Ratios
A1. Current Ratio
Working Capital
B1. Working Capital
Liquidity Under Stressed Test
C1. Quick Ratio (Acid Test Ratio)
Extra Liquidity
Summary And Reference
S1. Insight
S2. References and Credits
S3. Disclosure
Definitions
To help readers understand the content better, the following terms and glossaries have been provided.
Current Ratio: The current ratio is a financial metric that measures a company’s ability to pay off its short-term liabilities with its short-term assets. It provides insight into the liquidity position of a business. Here’s the formula for calculating the current ratio:
Current Ratio = Current Assets / Current Liabilities
Current Assets: These are assets that are expected to be converted into cash or used up within one year. They include cash and cash equivalents, accounts receivable, inventory, and other short-term investments.
Current Liabilities: These are obligations that the company needs to settle within one year. They include accounts payable, short-term debt, accrued liabilities, and other short-term financial obligations.
A current ratio greater than 1 indicates that the company has more current assets than current liabilities, suggesting it is in a good position to cover its short-term obligations.
A current ratio less than 1 indicates that the company may have difficulty meeting its short-term liabilities, which could signal potential liquidity issues.
A current ratio that is too high may also suggest inefficiency, as it could indicate that the company is not effectively utilizing its assets.
Working Capital: Working capital is a financial metric that represents the difference between a company’s current assets and current liabilities. It indicates the company’s ability to cover its short-term obligations with its short-term assets. Here’s the formula for calculating working capital:
Working Capital = Current Assets − Current Liabilities
Positive Working Capital: Indicates that the company has more current assets than current liabilities, suggesting a strong liquidity position and the ability to meet short-term obligations.
Negative Working Capital: Indicates that the company has more current liabilities than current assets, which could signal potential liquidity issues and difficulties in meeting short-term obligations.
Quick Ratio: The quick ratio, also known as the acid-test ratio, is a financial metric that measures a company’s ability to meet its short-term liabilities using its most liquid assets.
This ratio is more stringent than the current ratio because it excludes inventory and other non-liquid assets from current assets, focusing only on assets that can be quickly converted to cash, including cash, investment, and receivables. Here’s the formula for calculating the quick ratio:
Quick Ratio = (High Liquidity Assets Such As Cash, Investment & Receivables) / Current Liabilities
A quick ratio greater than 1 indicates that the company has more quick assets than short-term liabilities, suggesting a strong liquidity position.
A quick ratio less than 1 indicates that the company may struggle to meet its short-term obligations without selling inventory, which could signal potential liquidity issues.
General Motors Current Ratio
GM current ratio
(click image to enlarge)
The definition of current ratio is available here: current ratio.
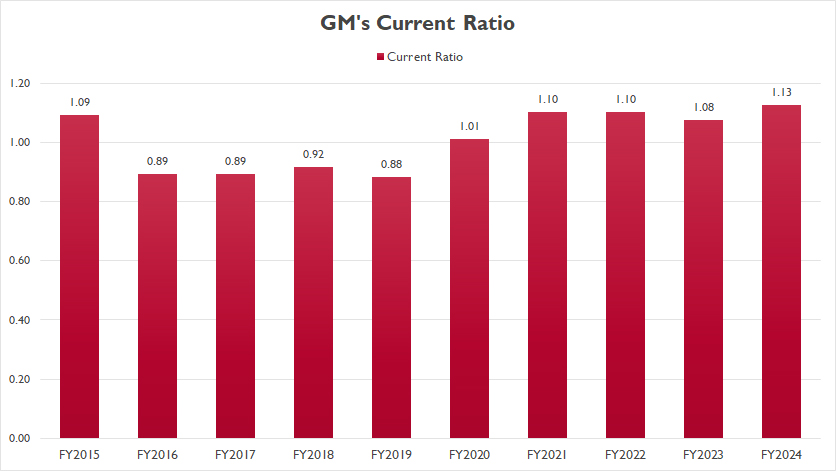
GM’s current ratio has shown remarkable improvement in recent years, consistently surpassing 1.0X since 2020. By the end of 2024, it reached 1.13X, marking the highest level in the past decade.
Before 2020, however, GM’s current ratio remained below 1.0X, indicating that its current liabilities exceeded its current assets during those years.
That said, a current ratio below 1.0X did not necessarily imply an imminent risk of bankruptcy or insolvency for the automaker. Instead, it signified a potential risk of default, emphasizing the importance of managing liquidity effectively.
General Motors Working Capital
GM working capital
(click image to enlarge)
The definition of working capital is available here: working capital.
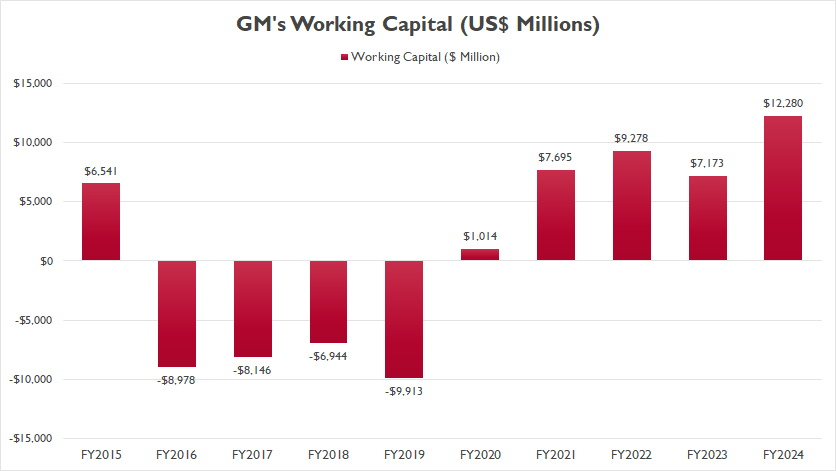
Before 2020, GM faced negative working capital. However, the situation has improved significantly in recent years, as reflected in the chart above.
In the post-pandemic period, GM consistently achieved impressive working capital levels, with figures exceeding $5 billion in most instances. By the close of fiscal year 2024, the automaker’s working capital had soared to an impressive $12 billion.
This surge in working capital during the post-COVID era underscores GM’s enhanced ability to access cash swiftly when needed, ensuring operational flexibility and financial resilience
General Motors Quick Ratio
GM quick ratio
(click image to enlarge)
The definition of quick ratio is available here: quick ratio. The quick ratio or acid test ratio measures GM’s liquidity during a stress test.
The quick ratio excludes specific current assets, such as inventory and prepaid expenses, as these are considered less liquid compared to cash and receivables.
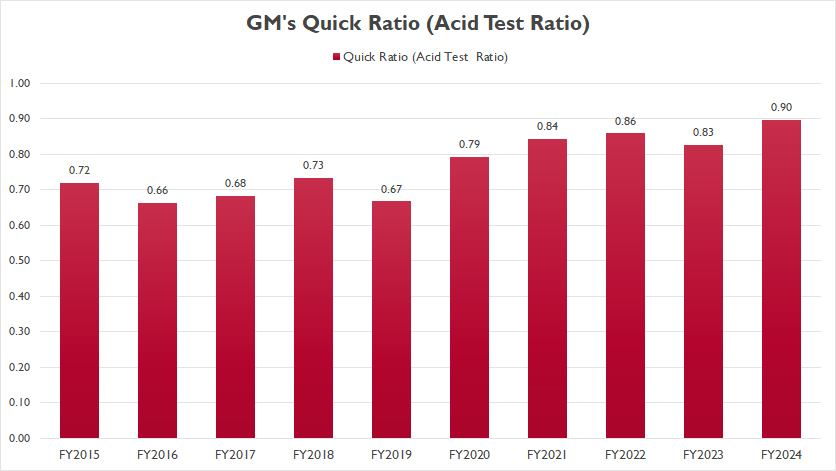
Historically, GM’s quick ratio has remained below 1.0X in most fiscal years, indicating that its cash and near-cash assets were insufficient to fully cover short-term liabilities.
By the end of fiscal year 2024, however, GM’s quick ratio (acid test ratio) improved to 0.90X, up from 0.83X the previous year — its highest level in a decade.
Given that GM’s cash and receivables alone have not been enough to meet its near-term obligations, the company has had to rely on other short-term assets, such as inventory, to address any cash shortfalls effectively.
General Motors Extra Liquidity
GM automotive liquidity
(click image to enlarge)
Apart from its own cash, GM also uses short and long-term financing such as credit facilities to boost its liquidity when necessary.
Here is a quote extracted from GM’s 2024 annual report regarding the company’s credit facilities:
-
We use credit facilities as a mechanism to provide additional flexibility in managing our global liquidity.
Our Automotive borrowing capacity under credit facilities totaled $14.3 billion at December 31, 2024, which consisted primarily of two credit facilities, and $17.1 billion at December 31, 2023, which consisted primarily of three credit facilities.
Total Automotive borrowing capacity under our credit facilities does not include our 364-day, $2.0 billion facility allocated for exclusive use of GM Financial.
We did not have any borrowings against our primary facilities, but had letters of credit outstanding under our sub-facility of $0.5 billion and $0.7 billion at December 31, 2024 and 2023.
Therefore, GM Automotive had nearly $14 billion borrowing capacity under its credit facilities as of 2024.
Of course, these are debt that needs to be paid off if GM ever needs to use the credit facilities. However, the credit facilities can come in handy and provides financial flexibility to the company.
Insight
General Motors (GM) has demonstrated significant improvements in its liquidity metrics since 2020.
Key ratios, including the current ratio, working capital, and quick ratio, have consistently surpassed critical benchmarks, showcasing the company’s ability to meet short-term liabilities effectively.
For instance, GM’s current ratio exceeded 1.0X, and its working capital surged to $12 billion by the end of fiscal year 2024, reflecting robust liquidity management in the post-pandemic era.
Moreover, GM’s reliance on additional mechanisms like credit facilities further enhances its financial flexibility. With nearly $14 billion of borrowing capacity available as of 2024, GM is positioned to address cash flow challenges swiftly, ensuring operational resilience.
These metrics collectively highlight GM’s strengthened liquidity and its proactive measures to navigate economic uncertainties.
References and Credits
1. All financial numbers presented were obtained and referenced from GM’s annual reports published on the company’s investor relations page: GM Investor Relations.
2. Flickr.
Disclosure
We may use artificial intelligence (AI) tools to assist us in writing some of the text in this article. However, the data is directly obtained from original sources and meticulously cross-checked by our editors multiple times to ensure its accuracy and reliability.
If you find the information in this article helpful, please consider sharing it on social media. Additionally, providing a link back to this article from any website can help us create more content like this in the future.
Thank you for your support and engagement! Your involvement helps us continue to provide high-quality, reliable content.


