Euro. Pixabay image.
This article covers Stellantis’ revenue distribution across various countries and regions. The company generates revenue in key markets such as North America, France, Brazil, the U.K., Turkey, and others.
In addition to analyzing Stellantis’ current revenue, the article delves into its pre-merger performance by exploring revenue contributions from Peugeot S.A. (PSA) and Fiat Chrysler Automobiles (FCA) across countries and regions.
Let’s take a look!
For other key statistics of Stellantis, you may find more resources on these pages:
Revenue
- Stellantis wholesale, revenue breakdown, and profit margin,
- Stellantis revenue segments and profit margin by division
Sales & Market Share
Other Statistics
Please use the table of contents to navigate this page.
Table Of Contents
Definitions And Overview
O2. How Does Stellantis Make Money
Stellantis Revenue By Country – 1st Tier
A1. North America, France, Brazil, Italy, Germany, And The U.K.
A2. North America, France, Brazil, Italy, Germany, And The U.K. In Percentage
Stellantis Revenue By Country – 2nd Tier
A3. Turkey, Spain, Belgium, Netherlands, Argentina, And Japan
A4. Turkey, Spain, Belgium, Netherlands, Argentina, And Japan In Percentage
Stellantis Revenue By Country – 3rd Tier
A5. Portugal, Poland, China, Algeria, Switzerland, And Austria
A6. Portugal, Poland, China, Algeria, Switzerland, And Austria In Percentage
PSA Revenue By Country – 1st Tier
B1. North America, France, Brazil, Italy, Germany, And The U.K.
B2. North America, France, Brazil, Italy, Germany, And The U.K. In Percentage
PSA Revenue By Country – 2nd Tier
B3. Turkey, Spain, Belgium, Netherlands, Argentina, And Japan
B4. Turkey, Spain, Belgium, Netherlands, Argentina, And Japan In Percentage
PSA Revenue By Country – 3rd Tier
B5. Portugal, Poland, China, Algeria, Switzerland, And Austria
B6. Portugal, Poland, China, Algeria, Switzerland, And Austria In Percentage
FCA Revenue By Country – 1st Tier
C1. North America, Brazil, Italy, France, Germany, And China
C2. North America, Brazil, Italy, France, Germany, And China In Percentage
FCA Revenue By Country – 2nd Tier
C3. Spain, United Kingdom, Argentina, Japan, Turkey, And Australia
C4. Spain, United Kingdom, Argentina, Japan, Turkey, And Australia In Percentage
Conclusion And Reference
S1. Insight
S2. References and Credits
S3. Disclosure
Definitions
To help readers understand the content better, the following terms and glossaries have been provided.
FCA-PSA Merger: The FCA-PSA merger refers to the combination of Fiat Chrysler Automobiles (FCA) and Peugeot S.A. (PSA) to form a new entity called Stellantis.
Announced in 2019 and completed in January 2021, the merger created the fourth-largest automaker in the world by volume. The move was aimed at leveraging the strengths of both companies to compete more effectively in a rapidly evolving automotive industry, particularly with the shift towards electric vehicles and autonomous driving technologies.
The merger brought together a broad portfolio of brands, including Fiat, Jeep, Dodge, Ram, Peugeot, Citroën, and Opel. Stellantis aims to utilize economies of scale, share technology and platforms, and optimize its global manufacturing footprint to improve efficiency and competitiveness.
Under accounting standards, Groupe PSA (“PSA”) was identified as the acquirer in the FCA-PSA merger, which was accounted for as a reverse acquisition, under IFRS 3 – Business Combinations, and, as such, it contributed to the results of Stellantis beginning January 1, 2021. FCA was consolidated into Stellantis effective January 17, 2021, the day after the merger became effective.
How Does Stellantis Make Money
Stellantis makes money through several key revenue streams, primarily focusing on the automotive industry. As a global automaker formed by merging Fiat Chrysler Automobiles (FCA) and the PSA Group, Stellantis operates in various automotive markets, including North America, Europe, and other regions. The main ways Stellantis generates income include:
1. **Vehicle Sales**: The most significant source of revenue for Stellantis comes from selling vehicles. This consists of a wide variety of brands under its umbrella, such as Jeep, Ram, Peugeot, Citroën, Fiat, Chrysler, Dodge, and Alfa Romeo, among others. Stellantis sells passenger cars, trucks, and commercial vehicles.
2. **Parts and Accessories**: Another revenue stream is selling automotive parts and accessories. This includes original equipment manufacturer (OEM) parts used for vehicle repairs and maintenance and aftermarket parts and accessories for customization and enhancement.
3. **Financial Services**: Stellantis also profits from financial services offered to dealers and customers. This encompasses financing for vehicle purchases or leases and dealer financing. These services help facilitate the sale of vehicles and generate additional income through interest payments and financing fees.
4. **Other Ventures**: Beyond its core automotive operations, Stellantis is involved in several other ventures contributing to its revenue. This includes mobility services, such as car sharing and subscription services, and potentially revenue from technological advancements like electric vehicles (EVs) and autonomous driving technologies.
Stellantis’s diversification across different brands, markets, and services allows it to cater to a wide range of customer preferences and adapt to changing market trends, all of which are crucial for its financial success.
North America, France, Brazil, Italy, Germany, And The U.K.
Stellantis-revenue-by-country-tier-1
(click image to expand)
A definition of the FCA-PSA merger is available here: FCA-PSA Merger.
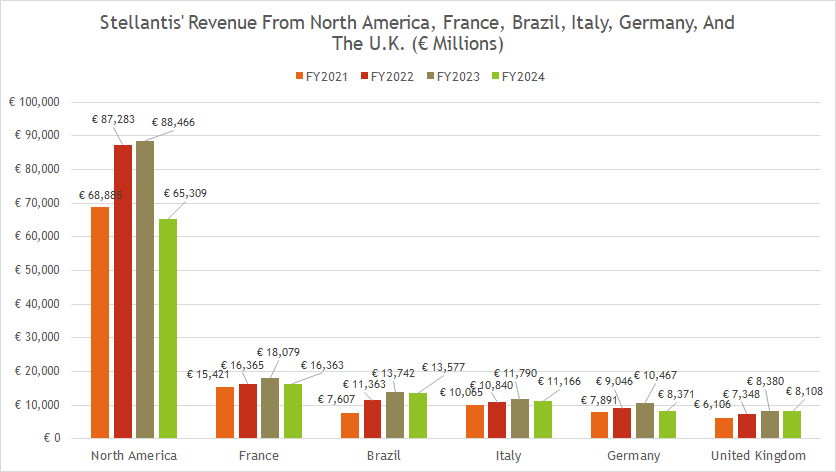
Stellantis generates the highest revenue from select countries and regions, with North America taking the lead. Between fiscal years 2022 and 2024, Stellantis achieved an annual average revenue of €80 billion from North America, while France contributed an annual average of €17 billion over the same period.
Brazil ranks as Stellantis’ third-largest revenue contributor, averaging €13 billion annually from fiscal years 2022 to 2024. Italy and Germany follow closely, producing €11 billion and €9 billion in annual average revenue, respectively, since 2022.
In the United Kingdom, Stellantis earned €7.3 billion in fiscal year 2022, €8.4 billion in 2023, and €8.1 billion in 2024, showing a consistent revenue stream with slight fluctuations over the years.
A key observation is Stellantis’ significant rise in revenue across these countries and regions following its merger in 2021. Brazil, in particular, stands out as one of the fastest-growing markets, with revenue nearly doubling since 2021. This growth is especially noteworthy in fiscal year 2024, despite declining results in other regions.
However, fiscal year 2024 witnessed a downturn in revenue for most countries, particularly in North America. Revenue in this region plummeted from €88.5 billion in 2023 to €65.3 billion in 2024, marking a substantial decline.
North America, France, Brazil, Italy, Germany, And The U.K. In Percentage
Stellantis-revenue-by-country-tier-1-in-percentage
(click image to expand)
A definition of the FCA-PSA merger is available here: FCA-PSA Merger.
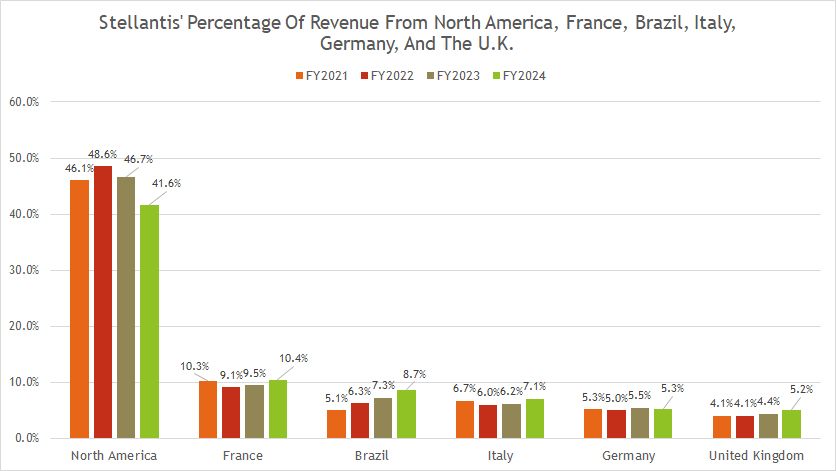
North America accounts for nearly half of Stellantis’ total revenue, solidifying its position as the company’s largest revenue contributor. However, this share declined to 42% in fiscal year 2024. Over the past three years, from fiscal year 2022 to 2024, Stellantis derived an average of 46% of its total revenue from this region.
France follows as the second-largest revenue source for Stellantis, contributing an annual average of 10% to the company’s revenue during the same three-year period.
Other countries, including Brazil, Italy, Germany, and the United Kingdom, generated smaller shares of revenue on average between fiscal years 2022 and 2024 — at 7%, 6.5%, 5%, and 4.6%, respectively.
Turkey, Spain, Belgium, Netherlands, Argentina, And Japan
Stellantis-revenue-by-country-tier-2
(click image to expand)
A definition of the FCA-PSA merger is available here: FCA-PSA Merger.
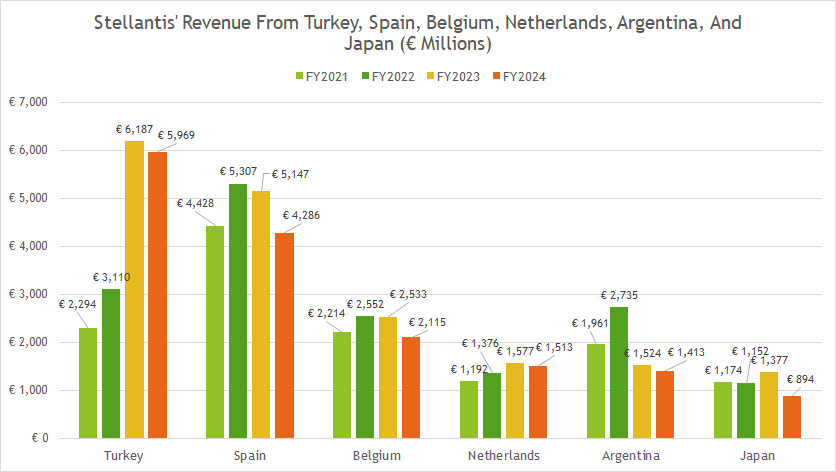
These countries contribute substantial revenue to Stellantis, but their figures remain significantly lower than those of first-tier markets previously discussed.
Since 2021, Stellantis’ revenue from Turkey has shown remarkable growth, reaching a record €6.0 billion in fiscal year 2024.
For Spain, Belgium, and the Netherlands, Stellantis earned average annual revenue of €5.0 billion, €2.4 billion, and €1.5 billion, respectively, over the past three years.
Meanwhile, Argentina and Japan provided modest contributions, with annual average revenue of €1.9 billion and €1.1 billion, respectively, between fiscal years 2022 and 2024.
Turkey, Spain, Belgium, Netherlands, Argentina, And Japan In Percentage
Stellantis-revenue-by-country-tier-2-in-percentage
(click image to expand)
A definition of the FCA-PSA merger is available here: FCA-PSA Merger.
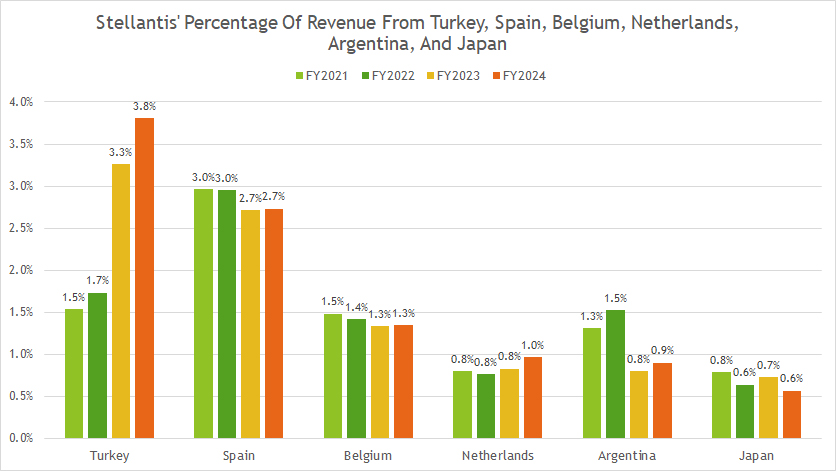
The revenue contribution from these countries is significantly lower compared to the first-tier markets.
For instance, Turkey accounted for only 3.3% of Stellantis’ total revenue in fiscal year 2024, while Spain contributed 2.8% during the same period. Over the past three years, Belgium’s revenue share averaged just 1.4%.
Additionally, Stellantis derived less than 1% of its revenue from the Netherlands, Argentina, and Japan.
Portugal, Poland, China, Algeria, Switzerland, And Austria
Stellantis-revenue-by-country-tier-3
(click image to expand)
A definition of the FCA-PSA merger is available here: FCA-PSA Merger.
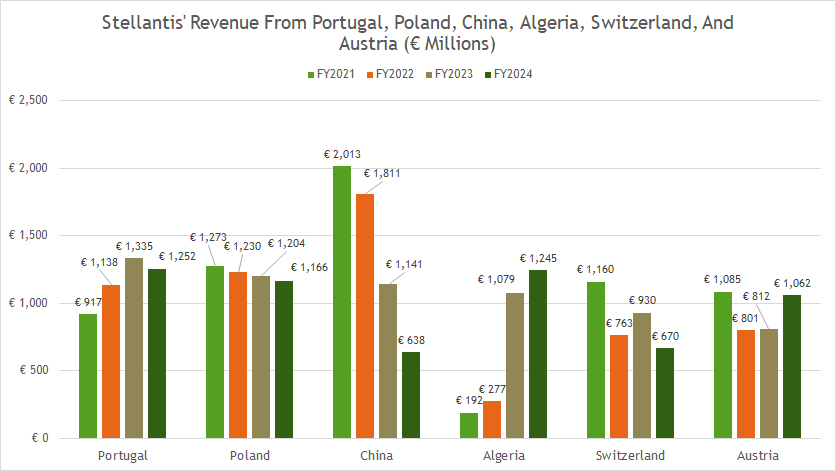
Stellantis generates significantly less revenue from these countries compared to its top-performing markets. However, China previously played a substantial role, with revenue exceeding €2.0 billion in fiscal year 2021. Since then, the company’s revenue in China has declined sharply, dropping to just €638 million by fiscal year 2024.
In contrast, revenue from Portugal, Poland, and Algeria averaged €1.2 billion, €1.2 billion, and €0.9 billion annually, respectively, over the last three years. Meanwhile, Switzerland and Austria contributed more modestly, with average annual revenues of €788 million and €892 million, respectively.
Notably, Algeria has emerged as a bright spot, with Stellantis’ revenue in the country experiencing a significant fivefold increase since 2021. While these countries contribute smaller shares to Stellantis’ overall revenue, the growth in Algeria highlights its potential as an increasingly important market for the company.
Portugal, Poland, China, Algeria, Switzerland, And Austria In Percentage
Stellantis-revenue-by-country-tier-3-in-percentage
(click image to expand)
A definition of the FCA-PSA merger is available here: FCA-PSA Merger.
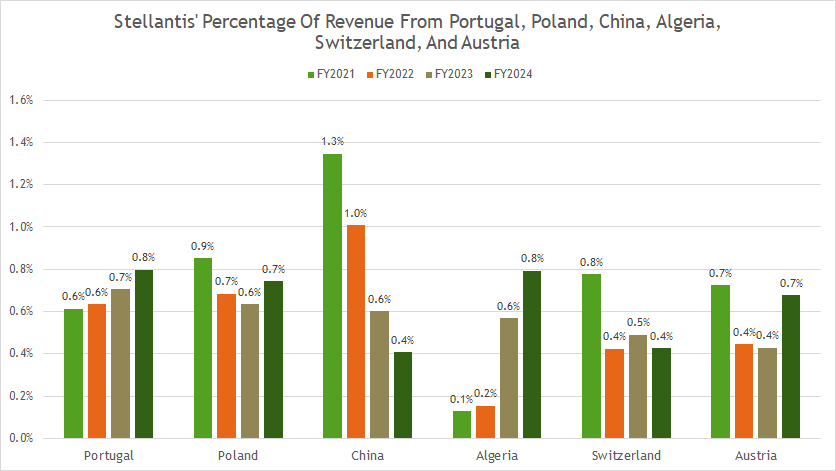
The revenue contribution from these countries has averaged less than 1% over the past three years, spanning fiscal years 2022 to 2024.
One notable exception is China, which contributed approximately 1.3% to Stellantis’ total revenue in fiscal year 2021. However, this share declined significantly to just 0.4% by fiscal year 2024.
As of 2024, the revenue contributions from Portugal, Poland, Algeria, Switzerland, and Austria matched the same level as that of China, emphasizing their relatively modest impact on Stellantis’ overall revenue.
North America, France, Brazil, Italy, Germany, And The U.K.
Peugeot-revenue-by-country-tier-1
(click image to expand)
A definition of the FCA-PSA merger is available here: FCA-PSA Merger.
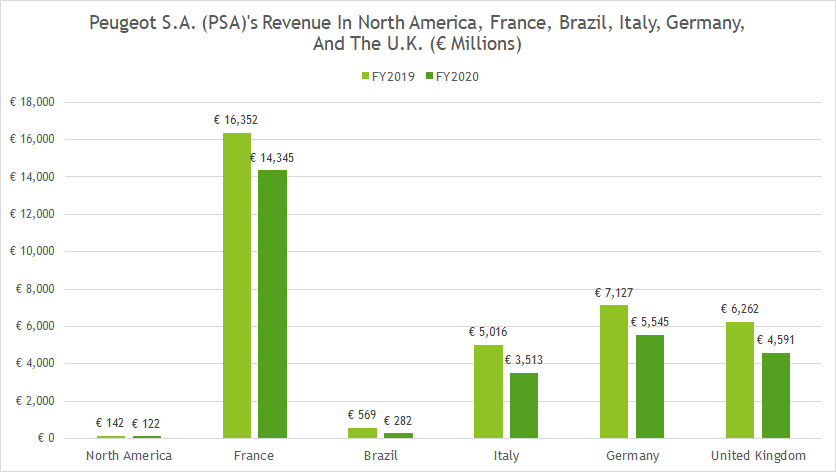
Before the merger, Peugeot S.A. (PSA) literally had no sales in North America. As seen, PSA’s revenue in North America totaled only around €100 million.
PSA’s revenue was mostly concentrated in Europe and the majority of sales were from France, as shown in the chart above. PSA earned about €16.4 billion and €14.3 billion in revenue in fiscal years 2019 and 2020, respectively, in France.
PSA’s revenue in South America, particularly in Brazil, totaled about €569 million in 2019. This figure decreased to €282 million in 2020.
PSA earned substantial revenue in Italy, Germany, and the United Kingdom, averaging €4.3 billion, €6.3 billion, and €5.4 billion, respectively, between 2019 and 2020.
A significant trend is PSA’s significant revenue decrease in some of the European countries. For example, PSA’s revenue in France and Italy has decreased by 13% and 43%, respectively, between 2019 and 2020. In Germany and the United Kingdom, PSA’s revenue has decreased by 22% and 27%, respectively, between 2019 and 2020.
North America, France, Brazil, Italy, Germany, And The U.K. In Percentage
Peugeot-revenue-by-country-tier-1-in-percentage
(click image to expand)
A definition of the FCA-PSA merger is available here: FCA-PSA Merger.
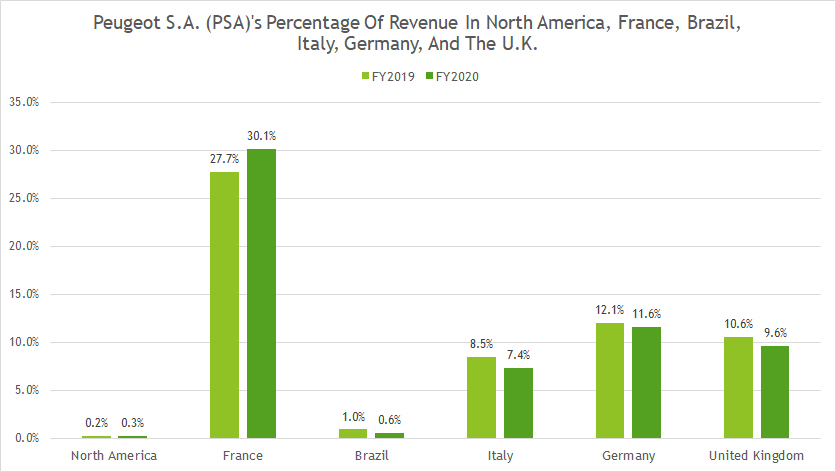
Peugeot S.A. (PSA) had very little presence in North America. It derived only 0.2% and 0.3% of revenue in North America in fiscal years 2019 and 2020, respectively.
On the other hand, PSA earned substantial revenue in Europe. In France, PSA’s revenue share reached 30.1% in fiscal 2020 and over 10% in Germany and the United Kingdom.
The revenue contribution from Italy was in high single digits in fiscal year 2019 and 2020.
Turkey, Spain, Belgium, Netherlands, Argentina, And Japan
Peugeot-revenue-by-country-tier-2
(click image to expand)
A definition of the FCA-PSA merger is available here: FCA-PSA Merger.
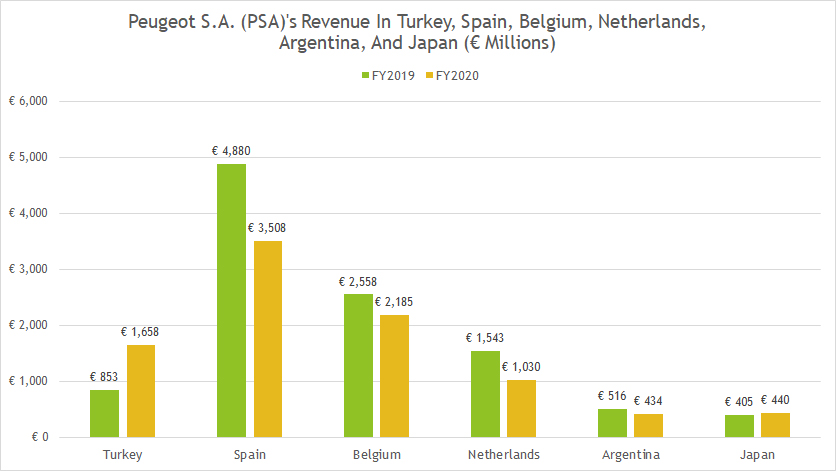
Again, Peugeot S.A. (PSA)’s revenue is mostly concentrated in European countries such as Spain, Belgium, and Netherlands. As seen, PSA’s revenue in Spain, Belgium, and Netherlands totaled a minimum of €1.0 billion per year.
PSA’s sales in South America and Asia were only about half of the numbers in European countries. For example, PSA earned revenue of just €434 million in Argentina in 2020, while the figure was only €440 million in Japan.
Turkey, Spain, Belgium, Netherlands, Argentina, And Japan In Percentage
Peugeot-revenue-by-country-tier-2-in-percentage
(click image to expand)
A definition of the FCA-PSA merger is available here: FCA-PSA Merger.
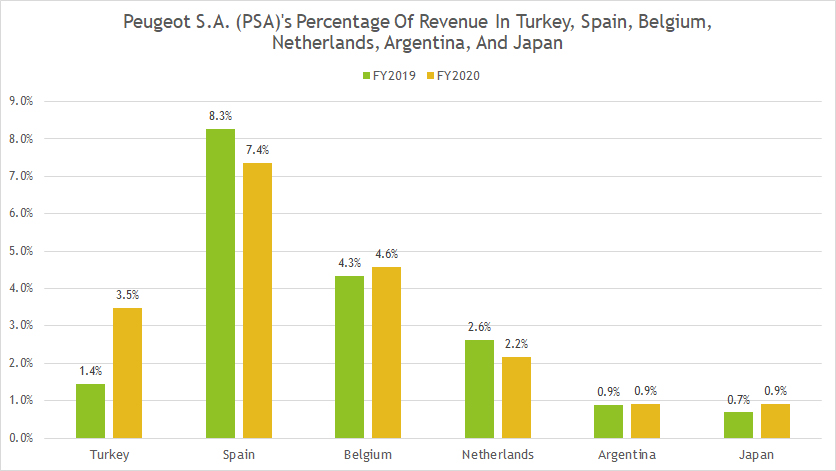
As depicted in the chart above, Peugeot S.A. (PSA) derived the majority of its revenue in European countries such as Spain, Belgium, and the Netherlands. The revenue contribution from Spain, Belgium, and the Netherlands reached 7.4%, 4.6%, and 2.2%, respectively, in fiscal years 2020.
Similarly, Turkey contributed significantly to PSA’s revenue streams, totaling 3.5% of the total in fiscal 2020. In contrast, PSA earned less than 1% of revenue in Argentina and Japan.
Portugal, Poland, China, Algeria, Switzerland, And Austria
Peugeot-revenue-by-country-tier-3
(click image to expand)
A definition of the FCA-PSA merger is available here: FCA-PSA Merger.
Peugeot S.A. (PSA) had very little presence in China, as shown in the chart above. Its revenue in China in 2019 and 2020 totaled only €175 million and €133 million, respectively.
On the other hand, PSA earned much higher revenue in European countries such as Portugal, Poland, Switzerland, and Austria. However, PSA’s revenue in these European countries had significantly decreased. For example, PSA’s revenue in Switzerland was reduced by half in 2020 from 2019, reaching only €361 million in 2020.
Similarly, PSA earned €753 million in revenue in fiscal year 2020, down 37% over 2019, while revenue in Austria was down 22% year-on-year in the same period.
Portugal, Poland, China, Algeria, Switzerland, And Austria In Percentage
Peugeot-revenue-by-country-tier-3-in-percentage
(click image to expand)
A definition of the FCA-PSA merger is available here: FCA-PSA Merger.
Peugeot S.A. (PSA)’s presence in China was insignificant, with revenue contribution from this region totaling only 0.3% in fiscal year 2020.
On the other hand, PSA had 1.5%, 1.6%, 0.8%, and 1.4% of revenue contribution from Portugal, Poland, Switzerland, and Austria, respectively, in fiscal year 2020.
North America, Brazil, Italy, France, Germany, And China
Fiat-Chrysler-Automobiles-revenue-by-country-tier-1
(click image to expand)
A definition of the FCA-PSA merger is available here: FCA-PSA Merger.
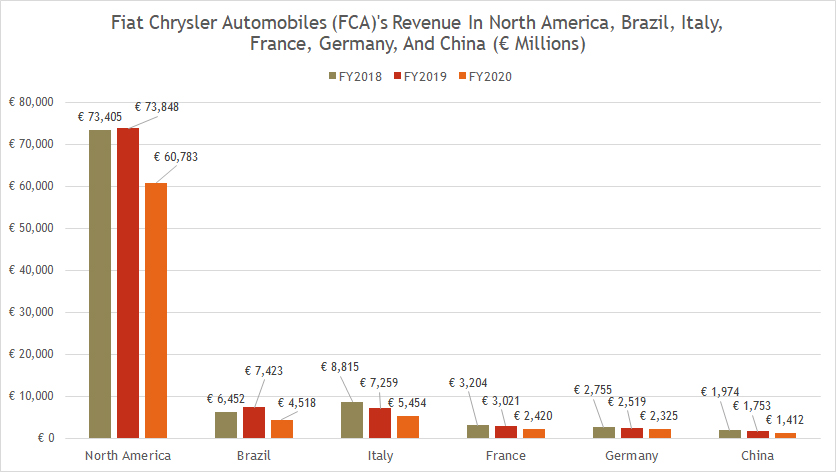
Fiat Chrysler Automobiles (FCA) operated in markets that were vastly different from Peugeot S.A. (PSA). In this aspect, FCA’s market was concentrated in the North American region, as depicted in the chart above.
The company earned significant revenue in North America, totaling over €60.8 billion in fiscal year 2020. On the other hand, FCA had very little presence in Europe. It earned less than €5 billion in annual revenue in most European countries, as shown in the chart above.
FCA’s revenue in China was considerably less, reaching just €1.4 billion in fiscal 2020.
North America, Brazil, Italy, France, Germany, And China In Percentage
Fiat-Chrysler-Automobiles-revenue-by-country-tier-1-in-percentage
(click image to expand)
A definition of the FCA-PSA merger is available here: FCA-PSA Merger.
These countries produced the most revenue for Fiat Chrysler Automobiles (FCA).
The revenue contribution from North America reached a staggering 70.1% of the total for FCA in fiscal year 2020, the largest among all countries under comparison.
Although FCA derived a significant portion of revenue from North America, it only had a modest presence in South America. As seen, FCA’s revenue in Brazil reached just 5.2% of the total in fiscal year 2020, and Brazil seemed like the only country in South America where revenue share was above 5% for the company.
In Europe, FCA does not seem to have a significant presence. Revenue contribution from Italy, France, and Germany totaled only 6.3%, 2.8%, and 2.7% of the total in fiscal year 2020.
FCA has an even lower presence in China. For example, revenue contribution from China totaled just 1.6% in fiscal year 2020.
Spain, United Kingdom, Argentina, Japan, Turkey, And Australia
Fiat-Chrysler-Automobiles-revenue-by-country-tier-2
(click image to expand)
A definition of the FCA-PSA merger is available here: FCA-PSA Merger.
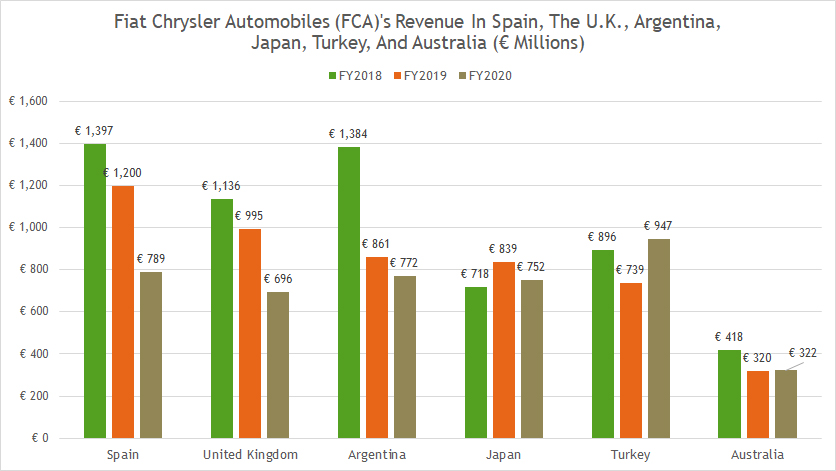
These countries produced the least revenue for Fiat Chrysler Automobiles (FCA).
FCA earned only €789 million in Spain in fiscal year 2020, while revenue from the United Kingdom declined to just €696 million in the same period.
FCA earned roughly the same revenue in Argentina and Japan, at €750 million in fiscal year 2020. However, FCA’s revenue in Argentina had been reduced by half between 2018 and 2020, while revenue in Japan had remained relatively unchanged during the same period.
FCA’s revenue in Turkey soared to nearly €1.0 billion in fiscal year 2020, the highest among all countries under comparison in this group. On the other hand, FCA earned just €322 million in Australia in fiscal year 2020.
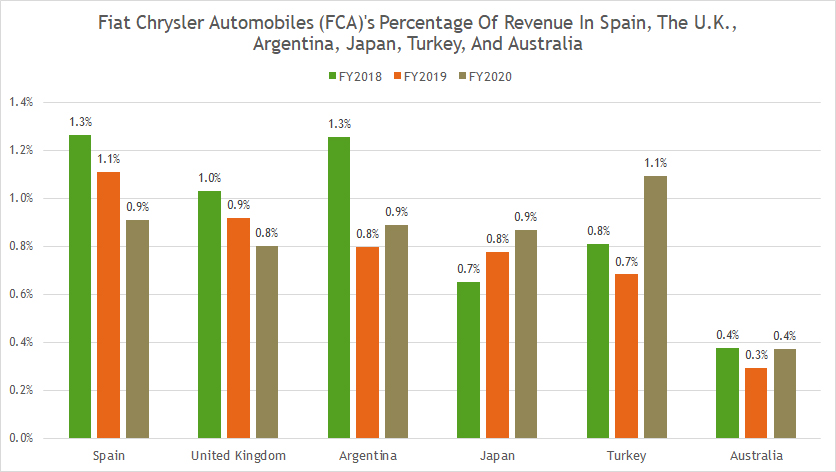
Spain, United Kingdom, Argentina, Japan, Turkey, And Australia In Percentage
Fiat-Chrysler-Automobiles-revenue-by-country-tier-2-in-percentage
(click image to expand)
A definition of the FCA-PSA merger is available here: FCA-PSA Merger.
Fiat Chrysler Automobiles (FCA) earned significantly less revenue in these countries, as shown in the chart above.
For example, revenue contribution from Spain, the U.K., and Argentina totaled less than 1% in fiscal year 2020. On the other hand, revenue contribution from Turkey rose to 1.1% during the same period, the highest among all countries in this group.
FCA earned just 0.4% of revenue in Australia in 2020, while Japan contributed 0.9%, a significant decrease from 1.3% in 2018.
Insight
After merging FCA and PSA, Stellantis’ revenue has significantly increased. This trend is particularly obvious in North America, with revenue reaching €65 billion in fiscal year 2024, the largest among all countries and regions compared. Stellantis’ revenue from North America contributed 42% of the total in fiscal year 2024.
Before the merger, Peugeot S.A. (PSA)’s revenue was concentrated primarily in Europe, while Fiat Chrysler Automobiles (FCA)’s revenue was distributed primarily in North America.
Stellantis’ revenue is more evenly distributed after the merger. The revenue contribution from European countries exceeded 30% in fiscal year 2024, only slightly behind that of North America.
Overall, Stellantis’ revenue trends reflect its heavy reliance on North America, while growth in emerging markets like Brazil and Algeria offers promising opportunities.
At the same time, the challenges in China and declining revenues in certain regions underscore the need for a balanced and adaptive global strategy.
References and Credits
1. All financial figures presented were obtained and referenced from Stellantis’ quarterly and annual reports published on the company’s investor relations page: Stellantis Investor Relations.
2. Pixabay images.
Disclosure
We may use artificial intelligence (AI) tools to assist us in writing some of the text in this article. However, the data is directly obtained from original sources and meticulously cross-checked by our editors multiple times to ensure its accuracy and reliability.
If you find the information in this article helpful, please consider sharing it on social media. Additionally, providing a link back to this article from any website can help us create more content like this in the future.
Thank you for your support and engagement! Your involvement helps us continue to provide high-quality, reliable content.

