Pedestrians crossing. Pixabay image.
Stellantis is a multinational automotive corporation formed in January 2021 through the merger of the world’s two largest automakers, Fiat Chrysler Automobiles (FCA) and Groupe PSA.
The name “Stellantis” is derived from the Latin word “stello,” which means “to brighten with stars,” and symbolizes the ambition of the new company to become a global leader in the automotive industry.
This article covers Stellantis’ vehicle sales and market share in North America, as well as its competitive position in the U.S. versus competitors.
Let’s read on!
Investors looking for other sales statistics of Stellantis may find more resources on these pages:
- Stellantis global sales,
- Stellantis Europe,
- Stellantis South America,
- Stellantis China, India & Asia Pacific,
- Stellantis Middle East & Africa, and
- Stellantis Maserati.
Please use the table of contents to navigate this page.
Table Of Contents
Overview And Definitions
Consolidated Sales
A1. Vehicle Sales In North America
Sales By Country
B1. Vehicle Sales In The U.S., Canada, And Mexico
B2. Vehicle Sales In The U.S., Canada, And Mexico In Percentage
Consolidated Market Share
C1. Market Share In North America
Market Share By Country
D1. Market Share In The U.S., Canada, And Mexico
U.S. Market Share Vs Competitors
E1. Market Share Vs Competitors In The U.S.
Conclusion And Reference
S1. Insight
S2. References and Credits
S3. Disclosure
Definitions
To help readers understand the content better, the following terms and glossaries have been provided.
North America Segment: The North America segment is one of Stellantis’ reportable segments.
According to the 2024 annual report, Stellantis operates primarily in the U.S., Canada, and Mexico in the North American region. Its brand names in this region include Jeep, Ram, Dodge, Chrysler, Fiat, and Alfa Romeo.
Stellantis has manufacturing plants in the U.S., Canada, and Mexico in the North American region.
New Vehicle Sales: According to the 2024 annual report, Stellentis defines its new vehicle sales as the sales of vehicles primarily by dealers and distributors or, directly by the company in some cases, to retail customers and fleet customers.
Sales include mass-market and luxury vehicles manufactured at Stellantis’ plants and vehicles manufactured by joint ventures and third-party contract manufacturers and distributed under its brands. Sales figures exclude sales of vehicles that it contracts to manufacture for other OEMs.
While vehicle sales are illustrative of Stellantis’s competitive position and the demand for its vehicles, sales are not directly correlated to net revenues, cost of revenues, or other measures of financial performance in any given period.
For a discussion of Stellantis’ vehicle shipments that directly correlate to its Net revenues, Cost Of revenues, and other financial measures, you may visit this article: Stellantis vehicle wholesale.
Vehicle Sales In North America
Stellantis-vehicle-sales-North-America
(click image to expand)
The definition of Stellantis’ new vehicle sales and North America segment is available here: new vehicle sales and North America segment.
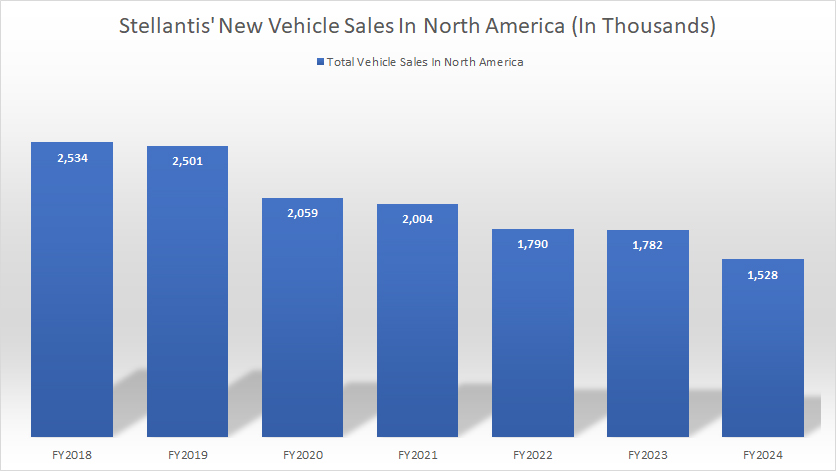
Stellantis’ total new vehicle sales in North America topped 1.53 million units in fiscal year 2024, a decrease of 17% from 1.78 millin reported in fiscal year 2023.
Since 2018, Stellantis’ new vehicle sales in North America have signficantly declined, falling from 2.5 million units in 2018 to 1.8 million units as of 2024, representing a drop of 40% in six years.
Stellantis has faced significant challenges in North America, including supply chain issues, pricing actions, and headwinds driven by inflation. However, production, supply chain and semi-conductor concerns eased across the industry in 2023.
Stellantis has stated that its vehicle sales and profitability in the North American region are generally weighted towards larger vehicles such as utility vehicles, trucks, and vans, consistent with overall industry sales trends in the North American segment, which have become increasingly weighted towards utility vehicles and trucks in recent years.
Although the U.S. industry sales, including medium and heavy-duty vehicles, in addition to commercial vehicles, were up approximately 387,000 units or 2.4 percent in 2024 from 15.9 million units in 2023, the increase did not help to boost Stellantis’ vehicle sales in the region.
Vehicle Sales In The U.S., Canada, And Mexico
Stellantis-vehicle-sales-in-the-U.S.-Canada-and-Mexico
(click image to expand)
The definition of Stellantis’ new vehicle sales is available here: new vehicle sales.
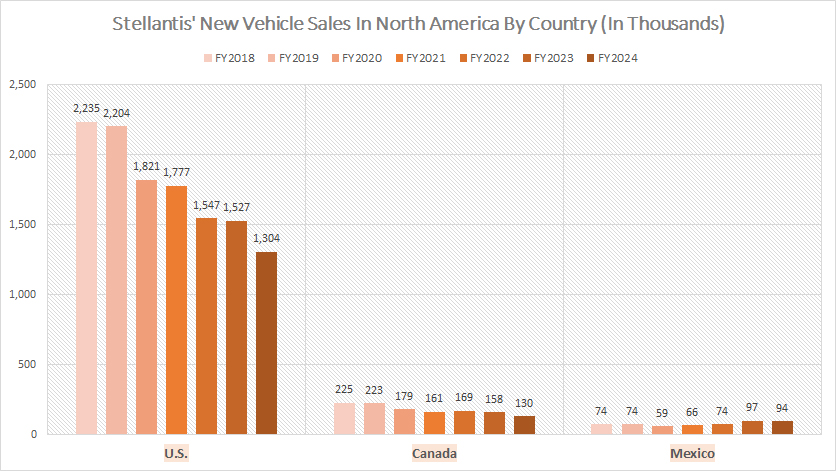
The U.S. is Stellantis’ largest market within the North America segment. The company sold over 1.3 million vehicles in the U.S. in fiscal year 2024, significantly down from the 1.5 million vehicles reported in 2023.
On the other hand, Stellantis’ retail sales in Canada totaled only 130,000 units in fiscal year 2024, while idelivery n Mexico totaled 94,000 in the same period.
Stellantis’ vehicle sales have significantly declined in the U.S. and Canada since 2018. For example, Stellantis saw its vehicle sales plummeting from 2.2 million units in 2018 to 1.3 million units as of 2024, representing a decline of over 40% in six years.
A similar trend occurs in Canada. Sales in this country have declined from 225 thousand vehicles in 2018 to a record low of 130 thousand as of 2024, down 40% over six years.
In contrast, Stellantis’ sales in Mexico have remained relatively firm since 2018. However, sales in 2023 increased considerably to 97 thousand units, up 31% over 2022. The 2023 sales result even surpassed the pre-COVID levels.
In fiscal year 2024, Stellantis’s new vehicle sales in Mexico remained solid at 94 thousand units, roughly inline with the 2023 result.
Vehicle Sales In The U.S., Canada, And Mexico In Percentage
Stellantis-vehicle-sales-in-the-U.S.-Canada-and-Mexico-in-percentage
(click image to expand)
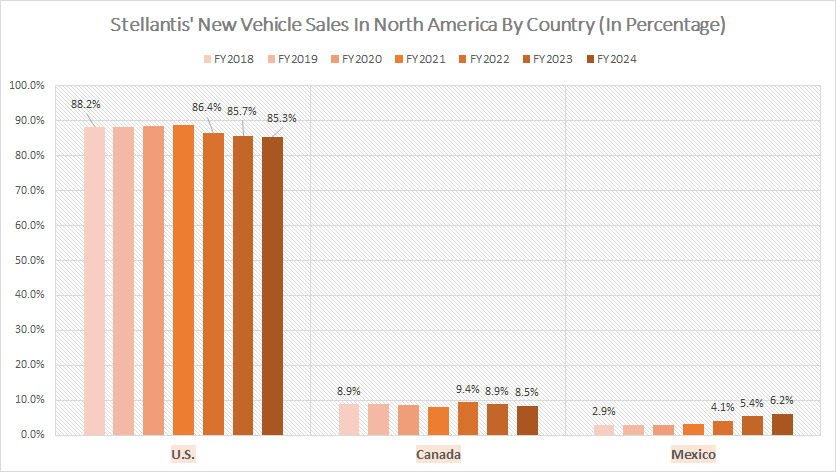
Stellantis’ U.S. sales have made up over 80% of its total retail volume in North America in all periods shown. This figure reached 85.3% in fiscal year 2024, down slightly from the 85.7% measured in 2023.
On the other hand, Stellantis’ sales in Canada has represented less than 10% of its total retail volume in North America, while Mexico has contributed an average of 5% over the last three years.
Mexico is the only country in which Stellantis has seen the percentage of its sales increasing over the years. The ratio reached 6.2% as of 2024, the highest level ever measured.
For other countries such as the U.S. and Canada, the percentage of sales with respect to the total has been steadily on the decline.
For example, Stellantis’ sales contribution from the U.S. has decreased from 88.2% to 85.3% in the last six years, while the ratio for Canada has remained stable at 9%.
Market Share In North America
Stellantis-market-share-North-America
(click image to expand)
The definition of Stellantis’ North America segment is available here: North America segment.
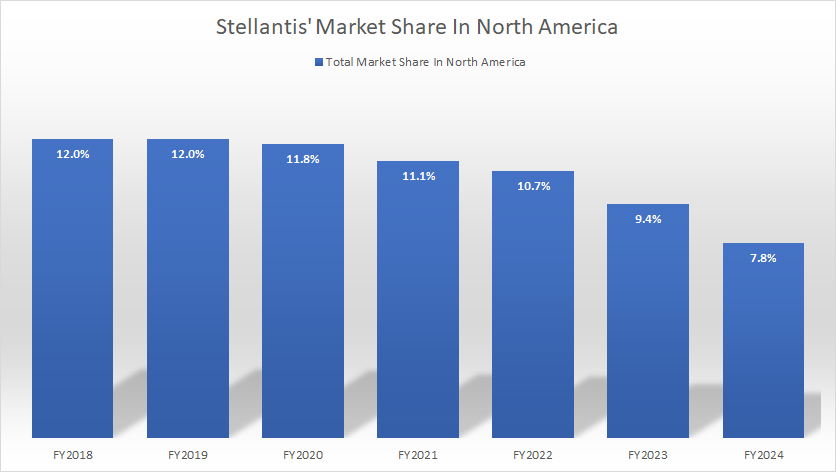
Stellantis’ total market share in North America experienced a notable decline, reaching 7.8% as of fiscal year 2024, as highlighted in the company’s 2024 annual report.
This represents a decrease from the 9.4% market share recorded in 2023, underscoring a year-over-year decline in the company’s competitive positioning within the region.
The downward trend becomes even more significant when looking at a broader timeline. Since 2018, when Stellantis commanded a robust 12.0% share of the North American market, the company has seen a steady erosion of its foothold.
By 2024, this decline amounted to a cumulative loss of 4.2 percentage points over six years.
This trajectory reflects challenges in maintaining brand competitiveness and aligning product strategies with evolving market dynamics, including shifts toward electrification and changing consumer preferences.
Market Share In The U.S., Canada, And Mexico
Stellantis-market-share-in-the-U.S.-Canada-and-Mexico
(click image to expand)
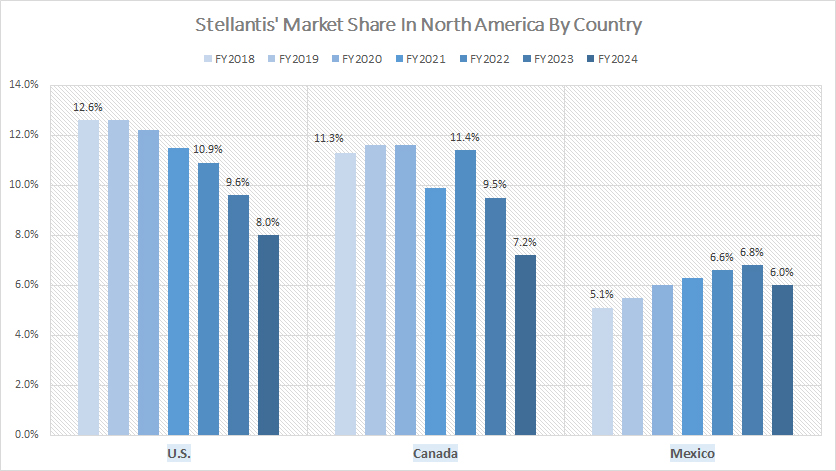
Stellantis’ market share in the U.S. has witnessed a significant decline, dropping from 12.6% in 2018 to just 8.0% as of 2024. This steep reduction reflects challenges in maintaining competitiveness within the highly dynamic and competitive U.S. automotive market.
The decline can be attributed to various factors, including underperformance in key product segments, delayed entry into the electric vehicle space, and intensifying competition from both traditional automakers and emerging EV-focused manufacturers.
In contrast, Stellantis has seen a modest but encouraging rise in its market share in Mexico, climbing from 5.1% in 2018 to 6.0% by 2024. This growth underscores the company’s stronger positioning and appeal in the Mexican market, likely driven by tailored product offerings and pricing strategies suited to regional consumer preferences.
However, Stellantis has faced comparable struggles in Canada, where its market share fell sharply to 7.2% in fiscal year 2024 — a significant drop from 9.5% in 2023.
The year-over-year decline highlights weakening traction in the Canadian market, potentially due to similar challenges encountered in the U.S., such as aging vehicle lineups and increased competition.
These trends suggest that while Stellantis has managed some gains in specific markets like Mexico, the company must address underlying issues to stabilize and rebuild its overall market share across North America. A renewed focus on innovation, electrification, and competitive pricing could be critical to regaining lost ground.
Market Share Vs Competitors In The U.S.
Stellantis-market-share-vs-competitors-in-the-U.S.
(click image to expand)
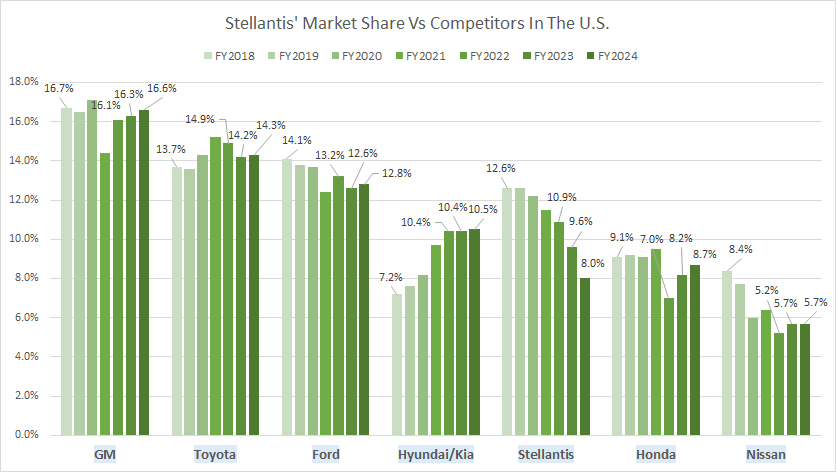
In fiscal year 2024, Stellantis secured the position of the fifth-largest automobile manufacturer in the U.S., holding a market share of 8.0%, as detailed in the company’s 2024 annual report.
This ranking placed Stellantis behind industry leaders General Motors (GM), Toyota, Ford Motor, and Hyundai/Kia, underscoring its competitive challenges in the American automotive market.
Stellantis’ primary rivals in the region include General Motors, Toyota, and Ford Motor — each demonstrating stronger market footholds. GM emerged as the clear leader, achieving the largest market share in the U.S. at 16.6% in 2024, highlighting its dominance across various vehicle segments.
Toyota followed closely, securing the second-largest market share of 14.3% for the same year, reflecting its consistent appeal to U.S. consumers through its reliability, fuel efficiency, and hybrid vehicle offerings.
Meanwhile, Ford Motor held the third spot, capturing a U.S. market share of 12.8% in 2024, supported by its robust lineup of trucks and SUVs, including its iconic F-Series.
Hyundai/Kia, benefiting from innovative designs and competitive pricing strategies, overtook Stellantis with a market share of 10.5%, claiming the fourth position among U.S. automobile manufacturers.
Stellantis’ decline to fifth place reflects growing pressure from these competitors, coupled with challenges in product positioning and electrification. To regain its footing, Stellantis will need to intensify its focus on innovation, electrification strategies, and customer engagement in the evolving U.S. automotive landscape.
Insight
To counteract declining sales and market share in major regions like the U.S. and Canada, Stellantis must aggressively invest in innovation, particularly in electrification, and refine its competitive pricing strategies.
Leveraging its PHEV leadership and expanding its BEV offerings can address changing consumer demands and intensify competition with top players.
Additionally, regional-focused strategies, like optimizing product and pricing for specific markets like Mexico, can provide resilience and mitigate overall losses.
By addressing both challenges and opportunities, Stellantis could stabilize its market position and potentially reclaim lost ground in North America.
References and Credits
1. All financial figures presented were obtained and referenced from Stellantis’ quarterly and annual reports (Form-20F) published on the company’s investor relations page: Stellantis Investor Relations.
2. Pixabay images.
Disclosure
We may use artificial intelligence (AI) tools to assist us in writing some of the text in this article. However, the data is directly obtained from original sources and meticulously cross-checked by our editors multiple times to ensure its accuracy and reliability.
If you find the information in this article helpful, please consider sharing it on social media. Additionally, providing a link back to this article from any website can help us create more content like this in the future.
Thank you for your support and engagement! Your involvement helps us continue to provide high-quality, reliable content.

