Corona beer. Source: Flickr Image.
AB InBev, also known as Anheuser-Busch InBev, has been paying cash dividends since 2006. Despite a consistent dividend history over 15 years, the dividend rates have declined considerably in recent years. This raises the question: Are AB InBev’s dividends safe? Should investors be concerned about the declining dividends?
In this article, we will examine both favorable and unfavorable factors affecting AB InBev’s dividends. Additionally, we will discuss the implications for investors.
Let’s move on!
Investors looking for other statistics of AB InBev may find more resources on these pages:
- AB InBev cash flow analysis,
- AB InBev debt ratio, payment due, and liquidity, and
- AB InBev revenue by region.
Please use the table of contents to navigate this page.
Table Of Contents
Favorable Factors
A1. Rising Sales Volumes Across All Segments
A2. Steady Regional Revenue Growth
A3. A Profitable Company
A4. A High Margin Business
A5. Solid Cash Flow
A6. Manageable Debt Levels
A7. Comfortable Interest Coverage
A8. Low Dividend Payout Ratio
Unfavorable Factors
B1. Declining Profitability
B2. Declining Margins
B3. High Indebtedness
B4. Poor Capital Return History
Conclusion And Reference
S1. Conclusion
S2. References and Credits
S3. Disclosure
AB InBev’s Rising Sales Volumes Across All Segments
AB InBev beverage sales volume
(click image to enlarge)
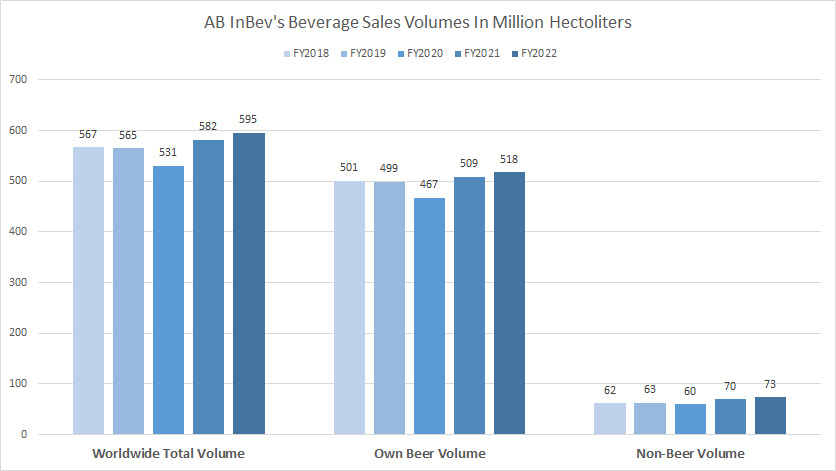
While AB InBev’s beverage sales volumes declined in fiscal 2020, they have significantly recovered in post-pandemic periods.
As shown in the chart above, AB InBev’s beverage sales volumes have been steadily recovering, hitting a record figure in fiscla year 2022 across all segments – beer and non-beer sectors.
The increasing sales volumes may drive revenue and, consequently, profitability higher. AB InBev’s dividends are likely to be much safer when sales volumes are on the rise.
AB InBev’s Steady Regional Revenue Growth
AB InBev worldwide and regional revenue
(click image to enlarge)
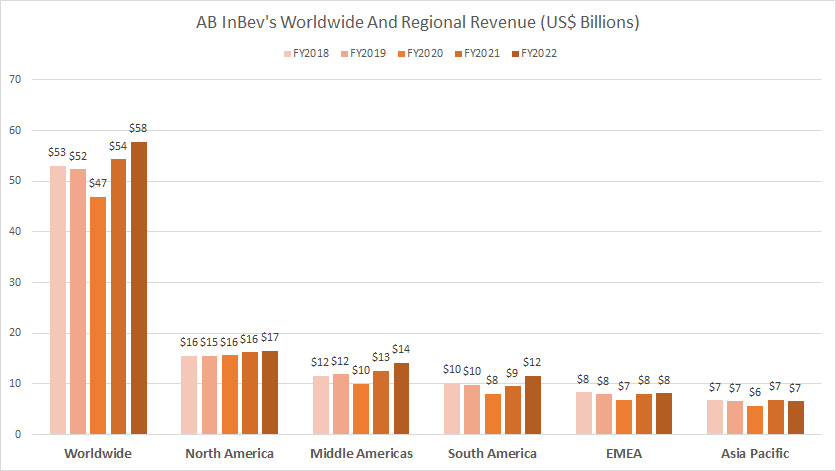
Apart from beverage volumes, AB InBev’s revenue has also risen in the post-pandemic period, as shown in the chart above. As noted, AB InBev’s worldwide revenue reached a 5-year high of $58 billion in fiscal year 2022, marking a 9% growth over 2018.
This increase in AB InBev’s worldwide revenue is driven by growth across multiple regions, particularly in North America, Middle America, and South America, as illustrated in the chart above.
While rising revenue does not necessarily guarantee profitability and subsequent cash dividends, it is certainly more favorable to have increasing revenue than declining revenue.
AB InBev Is A Profitable Company
AB InBev profitability
(click image to enlarge)
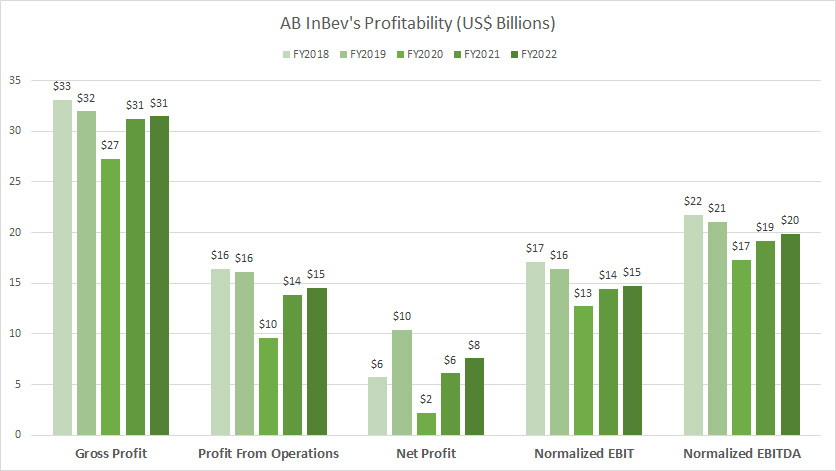
AB InBev is a profitable company that continued to generate income even during the COVID-19 crisis. Although profitability dropped in fiscal 2020, it recovered quickly in the post-pandemic period, indicating a resilient business model.
AB InBev’s consistent profitability across various periods and situations strongly supports the likelihood of maintaining a safe and consistent dividend.
AB InBev Runs A High Margin Business
AB InBev margins
(click image to enlarge)
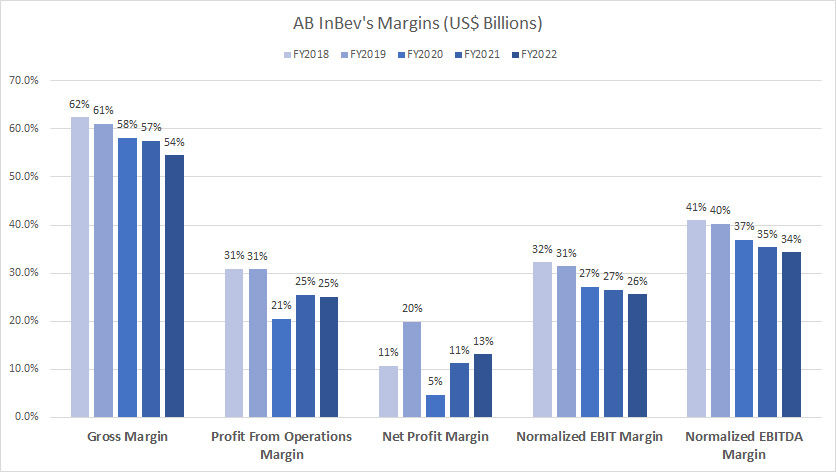
AB InBev’s margins are undeniably extraordinary. For instance, the company’s gross margin exceeds 50%, while its operating margin surpasses 20%, as shown in the graph above. Similarly, AB InBev’s net profit margin averages over 10%.
Few companies can replicate AB InBev’s high-margin business model. In summary, AB InBev’s impressive margins significantly support the stability and safety of its dividends.
AB InBev’s Solid Cash Flow
AB InBev cash flow
(click image to enlarge)
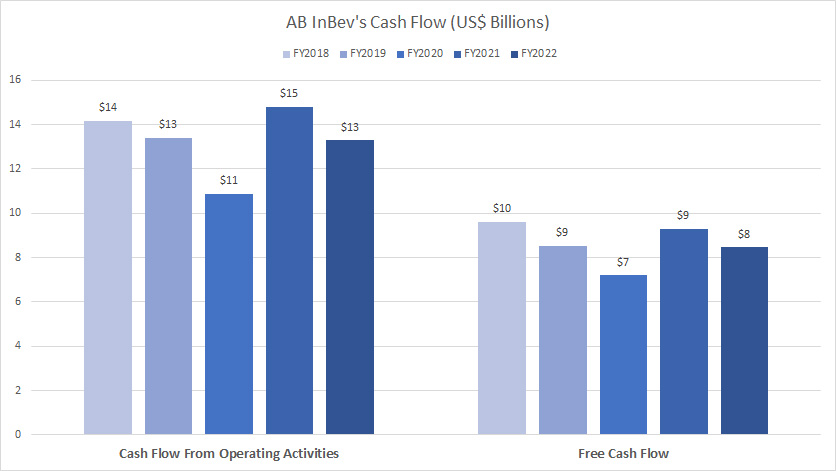
AB InBev’s strong cash flow generation greatly supports its ability to pay dividends.
As seen in the chart above, AB InBev consistently produces solid cash flow regardless of the situation, whether it’s the COVID-19 pandemic or a high inflationary environment.
AB InBev’s Manageable Debt Levels
AB InBev debt levels
(click image to enlarge)
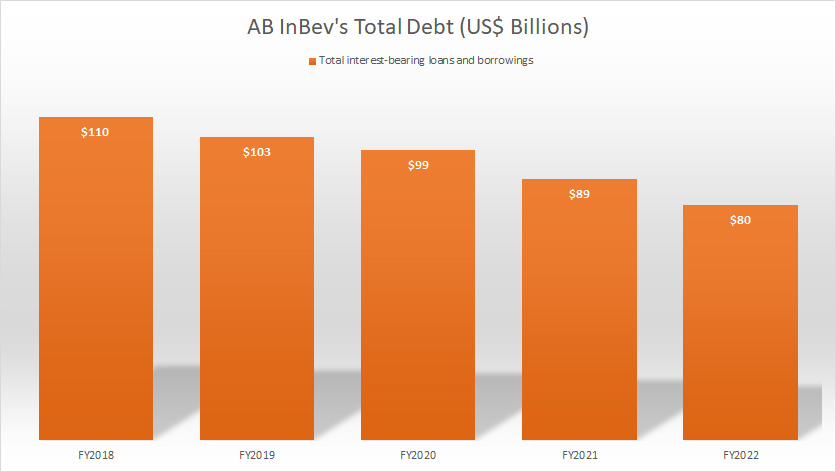
While AB InBev’s total debt is relatively high, it remains manageable. Moreover, the company’s debt level has also significantly declined since fiscal year 2018, reaching a record low of $80 billion as of fiscal year 2022, as illustrated in the chart above.
As discussed in the article, AB InBev debt vs cash, the company’s cash reserves alone are sufficient to repay its near-term debt. Therefore, debt is unlikely to harm or halt AB InBev’s cash dividends.
AB InBev’s Comfortable Interest Coverage
AB InBev interest coverage ratio
(click image to enlarge)
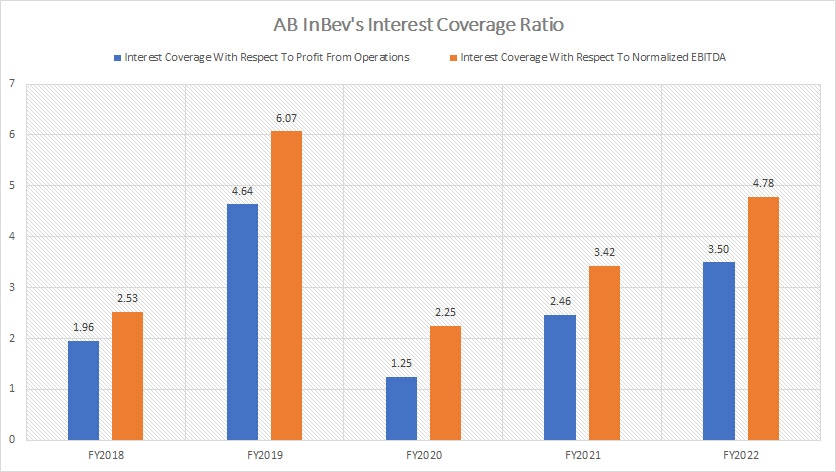
While AB InBev carries a substantial amount of debt, it does not pose a threat to the company’s financial health. As seen in the chart above, AB InBev is capable of servicing its debt using the profits from operations and EBITDA in all situations, including during the COVID crisis.
In fact, AB InBev’s profits from operations and EBITDA are sufficient to cover its debt expenses multiple times. Therefore, AB InBev’s cash dividends remain safe and solid, given the company’s high profitability, which more than adequately services its indebtedness.
AB InBev’s Low Dividend Payout Ratio
AB InBev dividend to free cash flow ratio
(click image to enlarge)
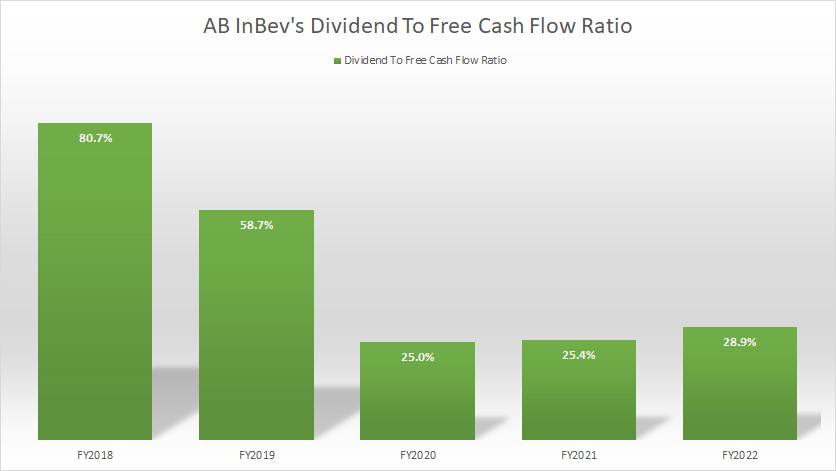
Although the dividend payout ratio was high prior to 2020, AB InBev has successfully reduced it. As of fiscal 2022, AB InBev’s dividend-to-free-cash-flow ratio stood at just 29%, one of the lowest levels ever recorded. This decline has primarily been driven by a series of dividend cuts to a more sustainable level for the company.
While AB InBev has reduced dividend rates, it did so to benefit shareholders by ensuring that future dividend payments are sustainable and balanced between capital returns and an optimal capital structure. Therefore, AB InBev’s current dividend payments are at a comfortable and safe level for both shareholders and the company and are likely to remain so in the foreseeable future.
AB InBev’s Declining Profitability
AB InBev profitability
(click image to enlarge)
While AB InBev continues to generate income, its profitability has been on a decline, as shown in the chart above. The company has not been able to replicate the profitability levels that matched or exceeded pre-pandemic results. Despite a surge in profitability in recent years, the results remain below pre-pandemic levels.
This stagnant or declining profitability does not bode well for AB InBev’s dividend policy. Although it may not completely halt dividend payments, the company may only be able to maintain the same dividend rates at best, as long as it produces mediocre results.
AB InBev’s Declining Margins
AB InBev margins
(click image to enlarge)
Similar to its profitability metrics, AB InBev’s margins at all levels have been on the decline. The most notable are the company’s gross, normalized EBIT, and EBITDA margins, which have continued to deteriorate even in the post-pandemic period, as depicted in the chart above.
Despite the rise in revenue and profitability, margins have remained depressed, suggesting that AB InBev may have increased volume at the expense of margins.
To counteract the lower margins, AB InBev needs to boost both volume and revenue. If the growth in volume and revenue is insufficient to offset the lower margins, AB InBev’s profitability will suffer, consequently impacting its dividends.
AB InBev’s High Indebtedness
AB InBev net debt to normalized EBITDA ratio
(click image to enlarge)
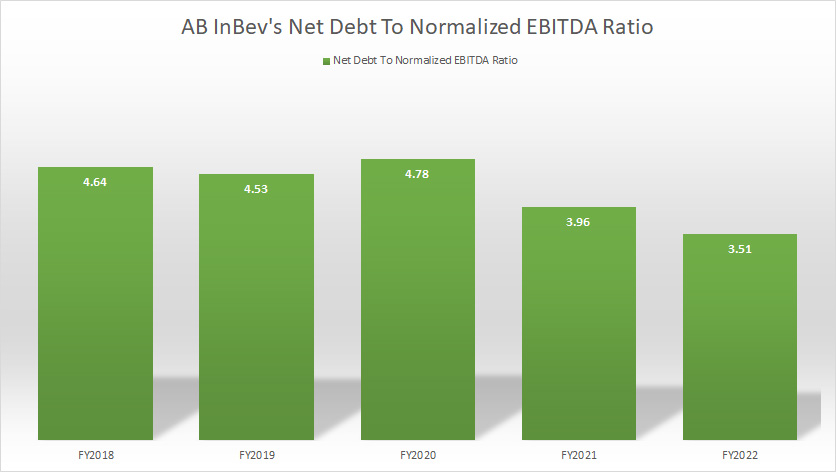
Despite having a manageable debt level, AB InBev’s indebtedness remains high, which is affecting capital returns, as depicted in the relatively high debt to EBITDA ratio above.
For your information, AB InBev allocates a large portion of its cash to debt repayment each year, a practice expected to continue in the foreseeable future. The company aims to achieve a net debt to normalized EBITDA ratio of 2.0X to reach its optimal capital structure.
As of 2022, AB InBev’s net debt to normalized EBITDA ratio was 3.51X, still far from the target of 2.0X. Therefore, AB InBev is likely to prioritize debt reduction over capital returns in the foreseeable future. While the focus on paying down debt may not eliminate dividends, it will likely restrict any increase in dividend rates.
AB InBev’s Poor Capital Return History
AB InBev dividend history
(click image to enlarge)
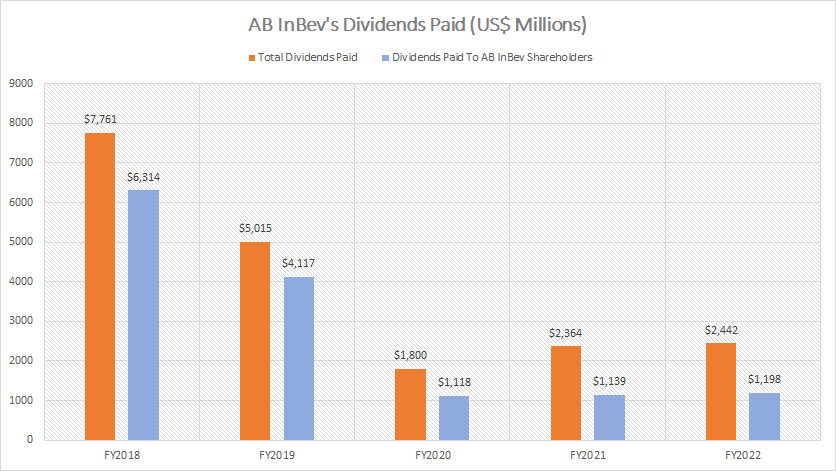
AB InBev has very poor capital returns for shareholders. The company currently only pays dividends and has not conducted any share buybacks for the period shown in the table below.
In addition, its cash outflow for dividend payments has also been on the decline, reaching record lows over the last several years, as shown in the graph above.
AB InBev’s historical share buyback
| Fiscal Year | Cash Spent On Stock Buybacks |
|---|---|
| 2018 | $0 |
| 2019 | $0 |
| 2020 | $0 |
| 2021 | $0 |
| 2022 | $0 |
| — | — |
| Average | $0 |
While AB InBev pays cash dividends, these payments have increased only marginally since 2020, rising just 7% in two years. However, since 2018, AB InBev’s total dividends and dividends paid to shareholders have significantly declined due to a series of dividend cuts aimed at conserving capital.
In short, AB InBev’s poor capital return history is a drawback for income investors. This history reflects the company’s mediocre performance and unreliable dividend payments.
Conclusion
Over the years, AB InBev has maintained a steady dividend payment history since 2006. However, the company’s dividend rates have seen a decline in recent times. Despite its resilience during the COVID-19 crisis and subsequent recovery, AB InBev’s profitability has not matched pre-pandemic levels, impacting its ability to sustain high dividend payments.
The company’s high profitability and impressive margins do support the safety of dividends, but high debt levels and a focus on debt reduction over capital returns may restrict dividend growth. AB InBev has not conducted share buybacks since 2018, which also reflects in its overall poor capital return history.
Additionally, the company’s declining dividend payout ratio, driven by necessary dividend cuts to maintain sustainability, indicates a conservative approach to capital management.
Although AB InBev’s cash flow generation is strong, ensuring the safety of its dividends, the company’s ability to increase dividends in the future remains uncertain due to its declining profitability and high indebtedness.
References and Credits
1. All financial figures presented in this article were obtained and referenced from AB InBev’s annual reports published in the company’s investor relation page: AB InBev Investor Relation.
2. Flickr Images.
Disclosure
References and examples such as tables, charts, and diagrams are constantly reviewed to avoid errors, but we cannot warrant the full correctness of all content.
The content in this article is for informational purposes only and is neither a recommendation nor a piece of financial advice to purchase a stock.
If you find the information in this article helpful, please consider sharing it on social media and also provide a link back to this article from any website so that more articles like this one can be created in the future.
Thank you!

