AB InBev beverage brands. Pixabay Image.
This article presents Anheuser-Busch InBev (AB InBev)’s debt level, cash, several leverage ratios, debt amount due, liquidity, and credit rating.
Let’s get into the details!
Investors interested in AB InBev’s other statistics may find more resources on these pages: AB InBev sales by country, AB InBev revenue by region, and AB InBev dividend.
Please use the table of contents to navigate this page.
Table Of Contents
Overview And Definitions
O2. How Does AB InBev Manage Its Debt?
Consolidated Results
A1. Total Debt
A2. Total Cash Assets
Net Debt
A3. Total Debt Less Cash
A4. Net Debt To Normalized EBITDA
Leverage Ratios
B1. Debt To Equity Ratio
B2. Debt To Asset Ratio
B3. Debt To Sales Ratio (Debt Margin)
Debt Expenses Coverage Ratios
C1. Profit From Operations To Debt Expenses
C2. Normalized EBITDA To Debt Expenses
Debt Due, Liquidity, And Credit Rating
D1. Debt Payments Due
D2. Liquidity
D3. Credit Rating
Summary And Reference
S1. Conclusion
S2. References and Credits
S3. Disclosure
Definitions
To help readers understand the content better, the following terms and glossaries have been provided.
Normalized EBITDA: Normalized EBITDA (Earnings Before Interest, Taxes, Depreciation, and Amortization) is a financial metric evaluating a company’s operating performance by removing irregular, non-recurring, or non-operational expenses and incomes.
This adjustment helps in providing a clearer and more consistent picture of the company’s core earnings and profitability. Here are key components typically adjusted in Normalized EBITDA:
1. One-time expenses or income: Removing the impact of non-recurring events such as restructuring costs, legal settlements, or sales of assets.
2. Non-operational items: Excluding gains or losses not related to the company’s primary business activities.
3. Extraordinary items: Adjusting for unusual or infrequent events that are unlikely to occur again.
The purpose of normalizing EBITDA is to make financial comparisons more reliable by stripping out anomalies that can distort true performance. This allows stakeholders to better assess and compare a company’s operational efficiency and profitability over time or against peers.
Unsecured Bond: An unsecured bond is a type of debt security that is not backed by any specific collateral. Instead, it relies on the creditworthiness and financial stability of the issuer to meet its payment obligations.
Because there is no collateral to claim in case of default, unsecured bonds typically carry a higher risk compared to secured bonds, and therefore, they often offer higher interest rates to compensate investors for this increased risk.
Secured Loans: A secured loan is a loan that is backed by collateral, meaning the borrower pledges an asset (such as a house, car, or savings account) as security for the loan.
Unsecured Loans: An unsecured loan is a loan that does not require any collateral. Instead, it is issued based on the borrower’s creditworthiness and ability to repay.
Investment-Grade Securities: Investment-grade securities are financial instruments considered to have a relatively low risk of default by credit rating agencies.
These securities are given higher ratings, usually BBB- or above by Standard & Poor’s and Fitch, or Baa3 or above by Moody’s. Here are the key aspects:
1. Credit Ratings: These ratings indicate the creditworthiness of the issuer, which can be a corporation, government, or other entities. Investment-grade securities are less likely to default compared to lower-rated, high-yield (or junk) bonds.
2. Types of Securities: Investment-grade securities can include corporate bonds, government bonds, municipal bonds, and mortgage-backed securities.
3. Interest Rates: Due to their lower risk, these securities typically offer lower interest rates compared to high-yield bonds.
4. Attraction to Investors: They are attractive to conservative investors such as pension funds, insurance companies, and other institutional investors looking for stable and reliable returns.
How Does AB InBev Manage Its Debt?
AB InBev manages its debt through a combination of strategic financial practices and disciplined capital allocation. Here are some key aspects of its debt management strategy:
1. Deleveraging: AB InBev has been focused on reducing its gross debt. For example, in 2022, the company reduced its gross debt by $8.9 billion, bringing it down to $79.9 billion1. This reduction in debt has helped improve their net debt to EBITDA ratio.
2. Strong Liquidity Position: The company maintains a strong liquidity position to ensure it can meet its financial obligations. As of the end of 2023, AB InBev had approximately $20.5 billion in liquidity.
3. Capital Allocation: AB InBev prioritizes efficient capital allocation to support its growth initiatives while managing debt levels. This includes investments in marketing, digital transformation, and premiumization of their product portfolio.
4. Share Buybacks: The company has also implemented share buyback programs to return value to shareholders and optimize its capital structure. For instance, in 2024, the board approved a $2 billion share buyback program.
5. EBITDA Growth: By consistently growing its EBITDA, AB InBev generates more cash flow to service its debt and reduce leverage. In 2022, the company reported a 7.2% increase in normalized EBITDA.
These strategies collectively help AB InBev manage its debt effectively while continuing to invest in growth and innovation.
Total Debt
AB InBev total debt
(click image to enlarge)
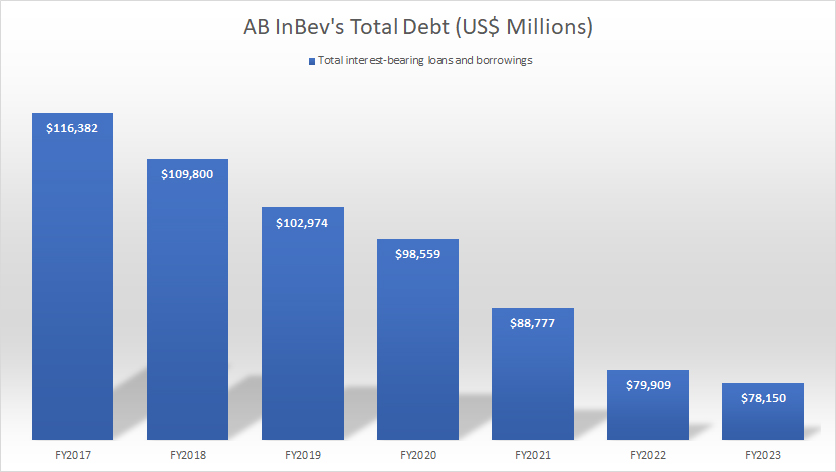
As of the end of fiscal year 2023, AB InBev’s total debt was at a 7-year low, amounting to $78.2 billion.
Compared to a year ago, AB InBev’s total debt in fiscal year 2023 has declined by $2 billion or 2%. Since fiscal 2017, AB InBev’s total debt has declined by over 30%, primarily due to the company’s deleveraging efforts.
Total Cash Assets
AB InBev cash assets
(click image to enlarge)
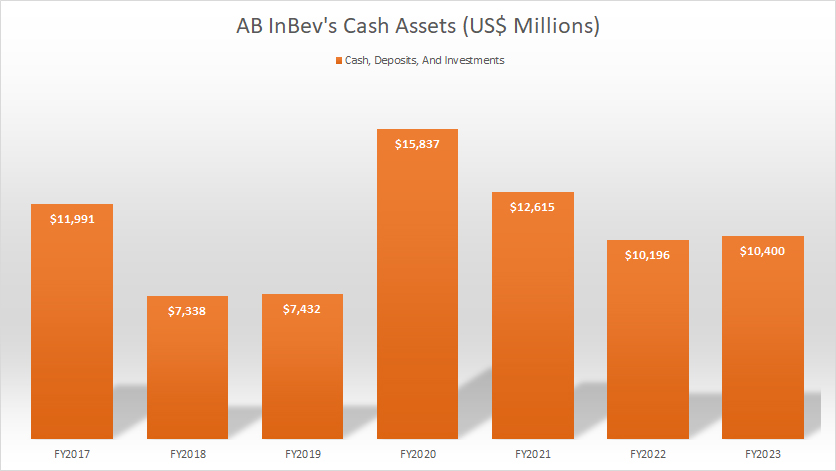
In terms of cash position, AB InBev’s cash or near-cash assets totaled slightly over $10 billion as of the end of fiscal year 2023.
On average, AB InBev carries roughly $11 billion cash. While this figure may seem like a lot, it is only a drop in the bucket compared to the company’s massive amount of debt.
AB InBev’s cash or near-cash assets could only cover about 13% of the company’s total debt based on the fiscal 2023 figures. In other words, AB InBev will not be able to pay off its total debt with only its cash.
Total Debt Less Cash
AB InBev net debt
(click image to enlarge)
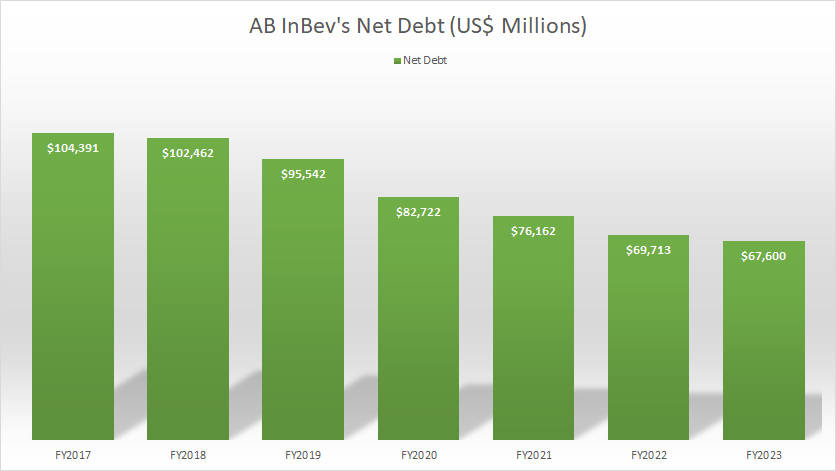
Even after taking into consideration AB InBev’s cash and near-cash assets, the company still owes a massive $67.6 billion to lenders as of the end of fiscal year 2023.
However, it is good to see that the company’s net debt has been decreasing, reaching a record low as of 2023. AB InBev’s declining net debt is the result of the company’s deleveraging efforts. The company has been paying off its debt progressively over the years.
Net Debt To Normalized EBITDA Ratio
AB InBev net debt to normalized EBITDA ratio
(click image to enlarge)
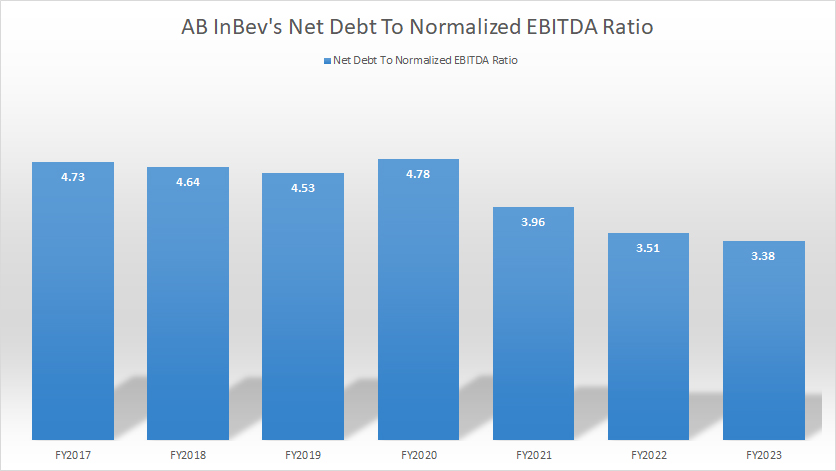
The definition of AB InBev’s normalized EBITDA is available here: normalized EBITDA. AB InBev intends to achieve a net debt-to-normalized EBITDA ratio of 2.0X.
As of fiscal year 2023, AB InBev’s net debt-to-normalized EBITDA ratio stood at 3.38X, still significantly above the targeted ratio of 2.0X. However, the ratio has declined significantly since 2021, reflecting the company’s efforts to maximize returns and allocate resources efficiently.
In this regard, AB InBev maximizes its returns by improving its normalized EBITDA, while also allocating substantial resources to debt reduction. We can clearly see both of these efforts in action at AB InBev. Since 2020, AB InBev’s normalized EBITDA has risen by 15% while its debt has reduced by 19%.
Debt To Equity Ratio
AB InBev debt to equity ratio
(click image to enlarge)
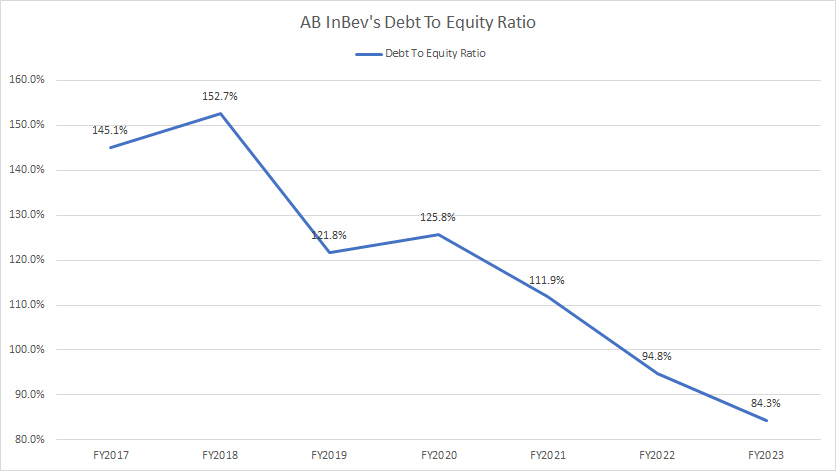
In terms of leverage, AB InBev’s debt-to-equity ratio as of fiscal year 2023 was at a 7-year low, totaling 84% or 0.84X. What this ratio means is that AB InBev has a total debt of $0.84 for every dollar of equity. AB InBev’s debt was slightly lower than the total equity.
My opinion is that AB InBev’s debt leverage was relatively low compared to its total equity. Besides, we can see that AB InBev’s debt leverage with respect to equity has significantly declined since fiscal year 2017. It was down from 145% or 1.45X in 2017 to 84% or 0.84X as of 2023, demonstrating the company’s effective debt reduction efforts.
Debt To Asset Ratio
AB InBev debt to asset ratio
(click image to enlarge)
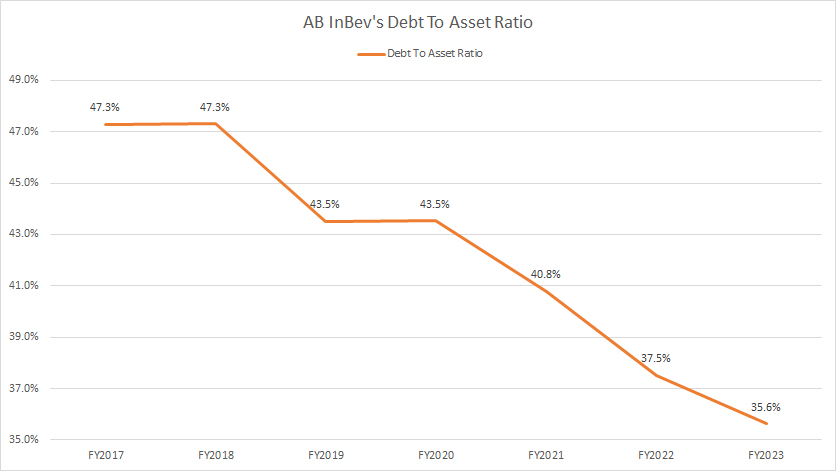
The debt-to-asset ratio reflects AB InBev’s capital structure, also known as the debt structure.
In AB InBev’s case, its capital structure was 36% debt, with the rest making up by assets and other liabilities as of fiscal 2023. Therefore, AB InBev’s total debt made up only a moderate portion of the company’s total assets.
The good news is that the debt-to-assets ratio has been declining, reaching a 7-year low by the end of fiscal year 2023, illustrating AB InBev’s commitment to reducing its indebtedness.
Debt To Sales Ratio (Debt Margin)
AB InBev debt to sales ratio
(click image to enlarge)
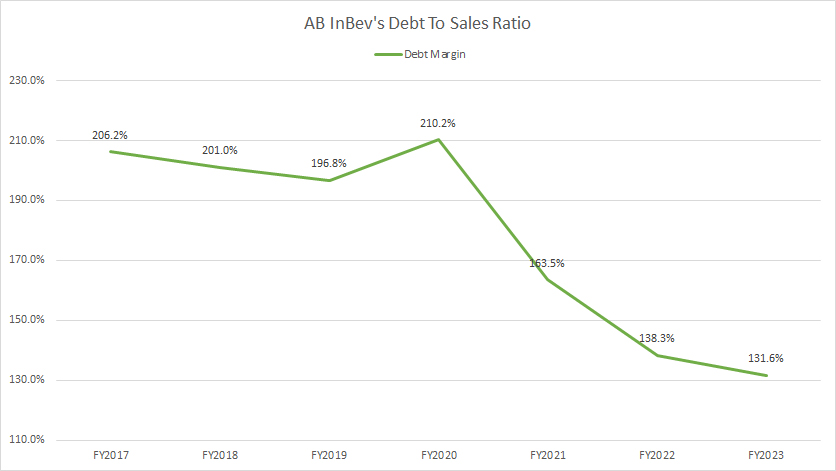
AB InBev also has managed to drive its debt margin to a record low of 132% as of fiscal 2023, as shown in the graph above.
However, AB InBev’s debt was still considerably high in fiscal 2023 at 132% of revenue.
With this ratio, AB InBev carried $1.32 dollar of debt for every dollar of sales. Fortunately, this ratio has significantly declined since 2017. It was down from over 200% in 2017 to 132% as of 2023, illustrating the company’s commitment towards deleveraging and maximizing return.
Profit From Operations To Debt Expenses Ratio
AB InBev interest coverage ratio
(click image to enlarge)
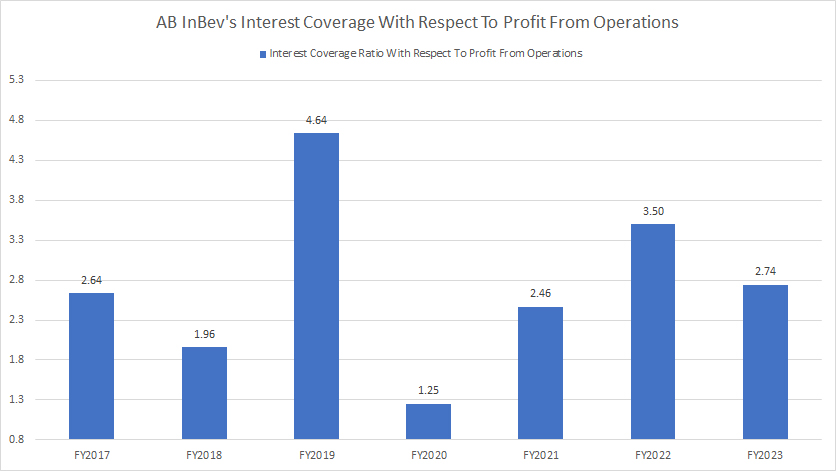
Despite the seemingly high debt levels, AB InBev has been able to cover its debt expenses in most fiscal years, as shown in the graph above, even for the period dated before the COVID-19 pandemic.
As seen, AB InBev’s profit from operations has been sufficiently large enough to cover all debt expenses by at least 1.0X. On average, the interest coverage ratio with respect to profit from operations totaled 2.9X between fiscal year 2021 and 2023, a reasonably comfortable level for any company.
The positive development is that AB InBev’s interest coverage ratio, in terms of profit from operations, has significantly increased since fiscal 2020, reaching a reasonably high level of 2.74X as of 2023. This demonstrates the company’s financial recovery from the COVID-19 impact in 2020.
Normalized EBITDA To Debt Expenses Ratio
AB InBev interest coverage ratio
(click image to enlarge)
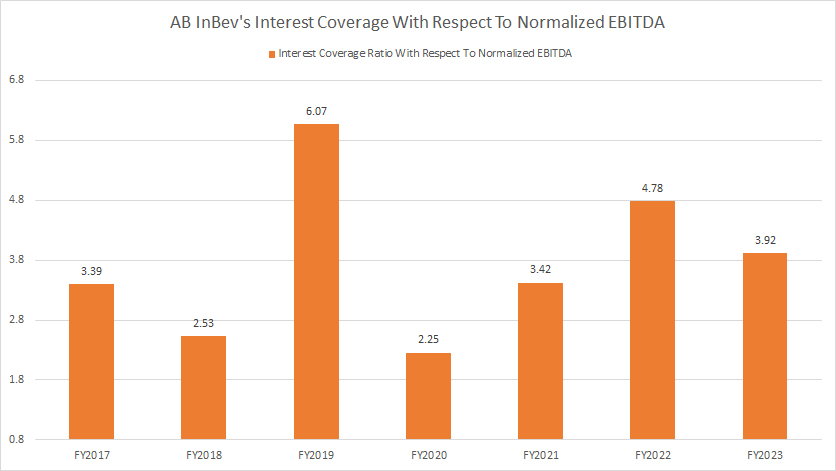
The normalized EBITDA is a non-IFRS measure and works more like cash earnings by stripping off most non-cash and irregular items. The detailed definition of the normalized EBITDA is available here: normalized EBITDA.
That said, with respect to the normalized EBITDA, AB InBev’s interest coverage ratio is at an even more comfortable level. As shown, AB InBev’s interest coverage with respect to normalized EBITDA was at a reasonably high of 3.92X in fiscal 2023.
In other words, AB InBev’s cash earnings in fiscal 2023 were more than sufficient to cover all debt expenses, notably by nearly 4 times.
Debt Due
AB-InBev-debt-due-schedules
(click image to expand)
An analysis of AB InBev’s debt and leverage will not be conclusive without a discussion of the corresponding debt maturity. The snapshot above shows Ab InBev’s contractual maturities of its interest-bearing liabilities as of 31 Dec 2023. The definitions of the different types of loans are available here: unsecured bond, secured loans, and unsecured loans.
As shown in the snapshot above, AB InBev’s debt due within 2024 totaled $4 billion, while debt due in the 2nd year (2025 – 2026) totaled $1.1 billion. AB InBev’s debt due in the third year (2026 – 2027) totaled $3.7 billion.
The cumulative debt due over the next 3 years (from 2024 to 2027) totaled $8.8 billion. Does AB InBev have enough cash to settle the debt payment due in the next 3 years? Let’s check out the next section.
Sources Of Liquidity
ABI’s estimated liquidity as of 31 Dec 2023.
| Sources Of Liquidity | US$ Millions | |
|---|---|---|
| Committed Capacity | Available Capacity For FY2024 | |
| Cash & Cash Equivalents | – | $10.4 |
| Long-Term Credit Facilities | $10.1 | $10.1 |
| Operating Cash Flow | – | $13.8 (estimated) |
| Total | – | $34.3 |
AB InBev’s sources of liquidity include cash and cash equivalents, long-term credit facilities, and net cash from operating activities.
As of 31 Dec 2023, AB InBev’s estimated liquidity was $20.5 billion, which consisted of cash & cash equivalents and credit facilities, and $34.4 billion after accounting for cash flow from operations.
In the prior section, we saw that AB InBev’s cumulative debt due over the next 3 years (from 2024 to 2027) was $8.8 billion. Therefore, AB InBev should have sufficient cash to cover the cumulative debt due of $8.8 billion in the next 3 years, given that its estimated liquidity (excluding cash flow from operations) was a handsome $20.5 billion.
If we take into account of ABI’s operating cash flow, AB InBev has more than sufficient liquidity to settle the debt due over the next 3 years.
Credit Rating
AB InBev’s credit ratings as of 31 Dec 2023.
| Rating Institutions | Types Of Indebtedness | Outlook | |
|---|---|---|---|
| Long-Term Debt | Short-Term Debt | ||
| Standard & Poor’s | A- | A-2 | Stable |
| Moody’s Investors Service | A3 | P-2 | Stable |
As of the date of the 2023 annual report, ABI’s credit rating from S&P was A- for long-term obligations and A-2 for short-term obligations, with a stable outlook.
ABI’s credit rating from Moody’s Investors Service was A3 for long-term obligations and P-2 for short-term obligations, with a stable
outlook.
According to AB InBev’s its credit ratings may be changed, suspended or withdrawn at any time and are not a recommendation to buy, hold or sell any of its subsidiaries’ securities.
Any change in credit ratings could have a significant impact on the cost of debt capital to the company and/or its ability to raise capital in the debt markets.
In short, AB InBev’s credit rating for its debt was classified as investment grade as of 2023. The definition of investment-grade securities is available here: investment-grade securities.
Moody’s credit rating definitions can be found here – Moody’s.
Standard & Poor’s credit rating definitions can be found here – Understanding Credit Ratings.
Conclusion
In summary, AB InBev had total debt of $78.2 billion as of the end of fiscal year 2023. However, AB InBev has made significant strides in managing its debt effectively.
Given the improvements in key financial metrics and a positive trend in their debt-to-equity ratio and interest coverage ratio, the company appears to be in a solid position regarding its debt as of 2023. These efforts likely enhance their overall financial stability and ability to navigate future challenges.
In addition, AB InBev also has sufficient liquidity to deal with the debt due in the nex three years. AB InBev also obtained investment-grade for its long-term and short-term obligations according to S&P and Moody’s.
References and Credits
1. All financial figures presented in this article were obtained and referenced from AB InBev’s annual reports (20-F) which are available in AB InBev Investor Relations.
2. Featured images in this article are obtained from Pixabay.
Disclosure
References and examples such as tables, charts, and diagrams are constantly reviewed to avoid errors, but we cannot warrant the full correctness of all content.
The content in this article is for informational purposes only and is neither a recommendation nor a piece of financial advice to purchase a stock.
If you find the information in this article helpful, please consider sharing it on social media and also provide a link back to this article from any website so that more articles like this one can be created in the future.
Thank you!

