3D printing process. Flickr Image.
Cash is the lifeline of a business. It is no exception for 3D Systems (DDD).
Being a capital-intensive operation, the company requires significant cash to manage its day-to-day operations.
In addition, 3D Systems invests heavily in research and development to ensure they remain at the forefront of the industry.
The R&D includes developing cutting-edge technologies, creating new materials, and integrating advanced software solutions to enhance their product offerings.
These activities require access to cash, and maintaining a healthy balance sheet is critical for the company’s continued success.
In this article, we will examine various cash-related statistics for 3D Systems. These statistics include cash on hand, cash flow, margins, and ratios.
Let’s take a look!
Please use the table of contents to navigate this page.
Table Of Contents
Overview
O1. Definitions
Consolidated Results
A1. Cash On Hand
Ratio
B1. Cash To Current Assets Ratio
Primary Cash Flow
Cash Flow From The Purchase And Sale Of Assets
C2. Net Cash From Investing Activities
Free Cash Flow
C3. Free Cash Flow Net Of Capital Expenditures
C4. Free Cash Flow Net Of Cash Flow From Investing Activities
Cash Flow Margins
D1. Operating Cash Flow Margin
D2. Free Cash Flow Margin
Debt Borrowings And Repayments
E1. Net Cash From Financing Activities
Conclusion And Reference
S1. Conclusion
S2. References and Credits
S3. Disclosure
Definitions
To help readers understand the content better, the following terms and glossaries have been provided.
Operating Cash Flow: Operating cash flow (OCF) measures the cash generated by a company’s regular business activities. This metric indicates if a company can generate enough positive cash flow to sustain and expand its operations or if it needs external financing for capital expansion. In other words, OCF helps to assess a company’s ability to fund its current and future growth without relying on external sources.
Free Cash Flow: Free cash flow (FCF) refers to a company’s cash generated after accounting for the cash outflows supporting its operations and maintaining its capital assets. Simply put, it is the cash remaining after paying off operating expenses (OpEx) and capital expenditures (CapEx).
Cash Flow Margin: The cash flow margin is a financial ratio that calculates the cash generated as a percentage of total sales revenue over a specific period. This metric is a reliable indicator of a company’s cash flow efficiency.
Cash Flow From Investing Activities: Cash flow from investing activities reflects the cash inflows and outflows resulting from the sale or purchase of long-term assets, such as property, plant, and equipment.
It also includes investments in securities, such as stocks, bonds, and cash for mergers and acquisitions. This metric provides insights into how a company deploys its capital to support its long-term growth strategy.
Cash Flow From Financing Activities: Cash flow from financing activities is a section of a company’s cash flow statement that reflects the inflows and outflows of cash resulting from financing activities.
Financing activities include raising or paying back capital through issuing stocks, bonds, and loans and paying shareholders dividends.
Cash On Hand
3D Systems’ cash on hand
(click image to expand)
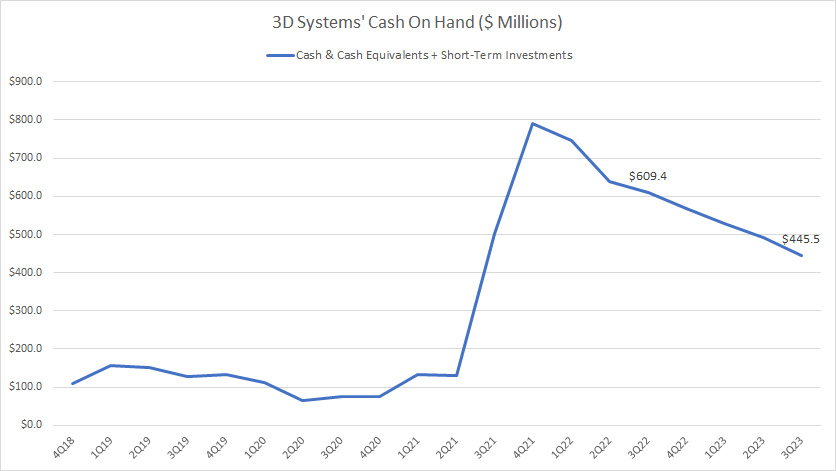
As of 3Q 2023, 3D Systems had US$445.5 million in cash on hand.
This figure, entirely comprising cash and equivalents, was down 27% from last year’s quarter.
A notable trend is the significant surge in cash on hand in fiscal 2021, soaring considerably from US$100 million to nearly US$800 million in just two quarters, as shown in the chart above.
As 3D Systems produces little to no free cash flow, the surge in cash on hand was fueled primarily by sales of assets and debt.
The following discussions will explain more about 3D Systems’ sales of assets and debt borrowings.
A primary concern is the declining cash on hand since fiscal 2022.
As shown in the chart above, 3D Systems’ available cash has significantly decreased since fiscal 2022 after peaking at nearly US$800 million in 2021.
The steady decrease in cash is driven by the company’s poor operating cash flow.
Does DDD Systems have a cash flow problem? Let’s look at more details.
Cash To Current Assets Ratio
3D-Systems-cash-to-current-assets-ratio
(click image to expand)
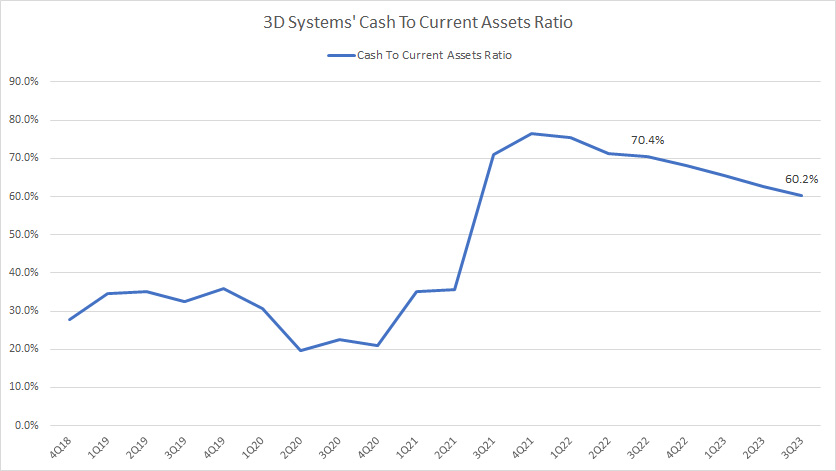
The plot above shows that DDD Systems’ cash on hand is a significant portion of its current assets.
As of 3Q 2023, the ratio hit 60%, down from the 70% recorded a year ago, primarily driven by the decrease in available cash that we saw in prior discussions.
At a ratio of 60%, the majority of DDD Systems’ current assets comprise cash.
Besides cash, there are very few other current assets.
More importantly, the ratio has significantly fluctuated in the past, indicating the importance of cash as working capital for DDD Systems.
Net Cash From Operations
3D Systems’ net cash from operations
(click image to expand)
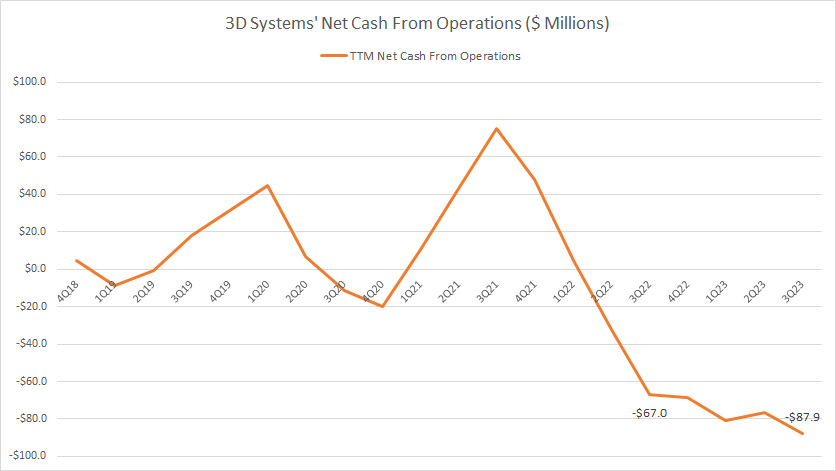
3D Systems’ net cash provided by operating activities is weak and poor.
The chart above shows that DDD Systems generates inconsistent net cash from operating activities.
In most quarters, negative figures dominate, especially for the recent results.
As of 3Q 2023, 3D Systems’ operating cash flow reached -US$87.9 million on a TTM basis, slightly worse off than the quarter a year ago.
DDD Systems’ continuous negative net cash from operations in recent quarters has resulted in the steady decline of the company’s cash balance.
Net Cash From Investing Activities
3D-Systems-net-cash-from-investing-activities
(click image to expand)
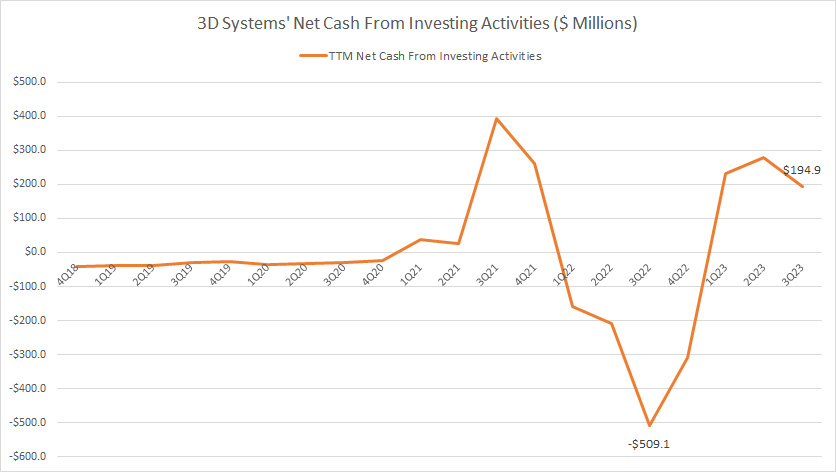
The net cash provided by investing activities indicates the sale or purchase of long-term assets.
Positive figures indicate cash inflow from the disposal of assets, while negative figures indicate cash outflow from the purchase of assets.
The assets can range from property, plant, and equipment to investments such as stocks, bonds, and cash for mergers and acquisitions.
The surge in net cash from investing activities in fiscal 2021 was one of the factors that contributed to the rise in DDD Systems’ cash position in the same year.
The other factor was cash flow from debt proceeds.
Free Cash Flow Net Of Capital Expenditures
3D Systems’ free cash flow net of capital expenditures
(click image to expand)
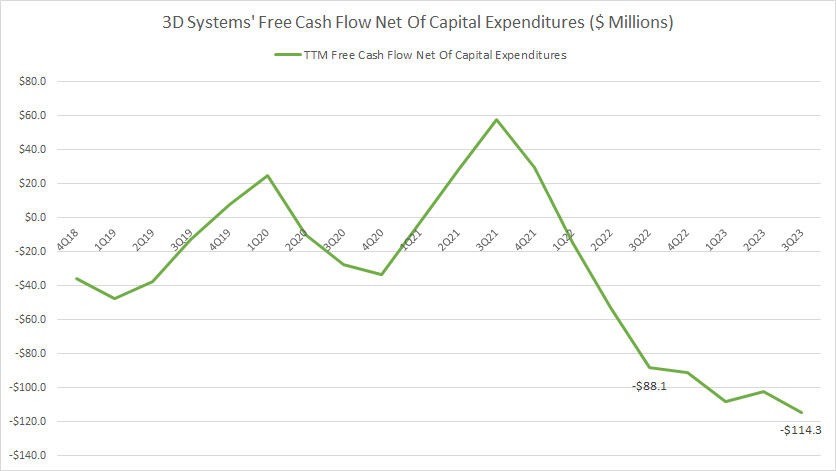
Free cash flow net of capital expenditures equals net cash from operations less cash outflow from capital expenditures.
3D Systems generates weak and poor free cash flow after accounting for capital expenditures.
The results are mostly negative, indicating poor or insufficient net cash from operating activities to cover the cash outflow from capital expenditures.
As of 3Q 2023, DDD Systems’ free cash flow reached -US$114 million, slightly worse off than the quarter a year ago.
Free Cash Flow Net Of Cash Flow From Investing Activities
3D Systems’ free cash flow net of net cash from investing activities
(click image to expand)
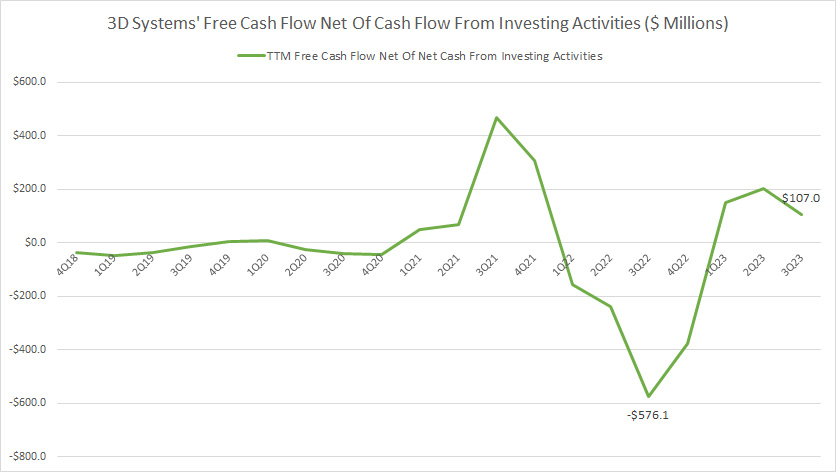
Free cash flow net of cash flow from investing activities equals net cash from operations less cash flow from investing activities.
If you compare the current chart with the chart of cash flow from investing activities, their trends look similar.
Positive results from net cash from investing activities are favorable for 3D Systems’s free cash flow, while negative results take cash out of the company’s free cash flow, as shown in the chart above.
In return, positive free cash flow helps to increase 3D Systems’ cash balance.
Operating Cash Flow Margin
3D Systems’ operating cash flow margin
(click image to expand)
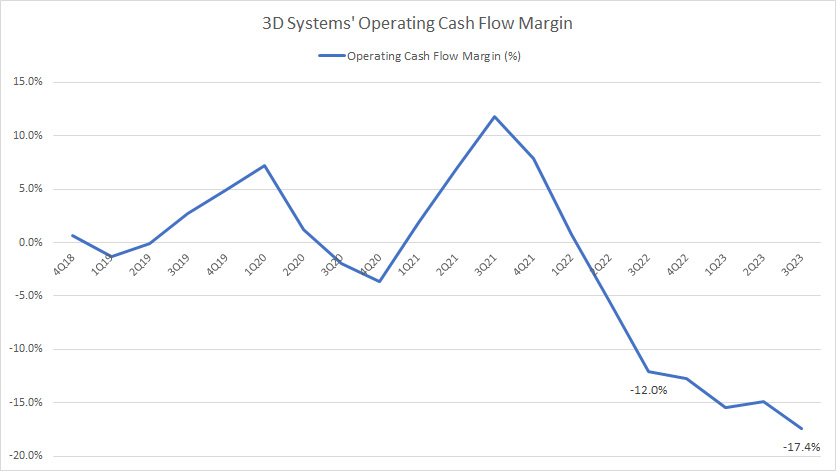
3D Systems’ operating cash flow margin measures the company’s efficiency in cash flow conversion from revenue.
As shown in the chart, 3D Systems’ operating cash flow margin historically averaged less than 5%, a relatively poor result.
The ratio was mostly negative in recent quarters, suggesting the company’s poor and weak operating cash flow.
Free Cash Flow Margin
3D Systems’ free cash flow margin
(click image to expand)
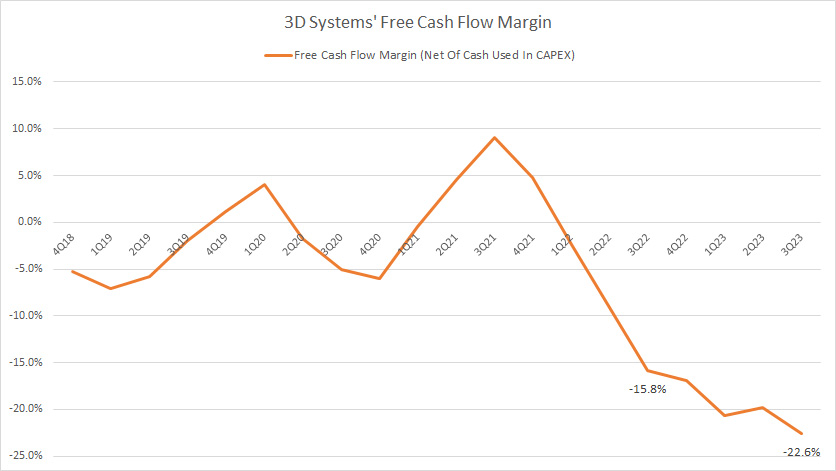
Similar to the operating cash flow margin, the free cash flow margin measures DDD Systems’ efficiency in converting free cash flow from revenue.
Again, 3D Systems is grossly inefficient at turning free cash flow from revenue.
The ratio was mostly negative in recent quarters, indicating the company’s poor free cash flow.
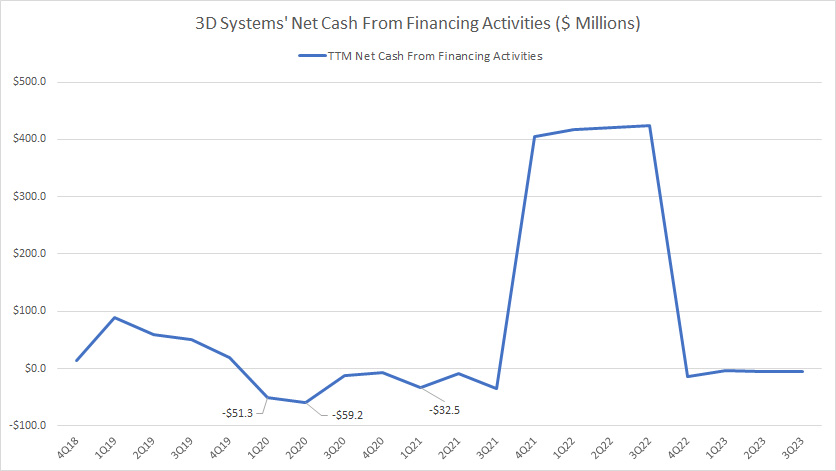
Net Cash From Financing Activities
3D Systems’ net cash from financing activities
(click image to expand)
A positive net cash from financing activities indicates that a company has raised more capital than it has paid back. At the same time, a negative number means it has paid back more than it has raised.
The chart shows that DDD Systems has paid back some capital but borrowed more.
The US$400 million cash raised between fiscal 2021 and 2022 contributed significantly to the rise of the company’s cash on hand during the same period.
Conclusion
To recap, DDD Systems’ consistent negative operating cash flow is a concern for investors and a problem for the company.
The reason is that the continuous negative net cash from operating activities has led to a steady decline in 3D Systems’ cash position.
Moreover, 3D Systems may have to resort to more borrowing and taking on more debt if the negative free cash flow persists or when the cash on hand runs low.
This is a highly possible situation considering that the company has resorted to sales of assets and taking on more debt to supplement its cash balance in the past.
Credits and References
1. All financial figures presented in this article were obtained and referenced from DDD’s quarterly and annual reports, investor presentations, earning releases, SEC filings, press releases, etc., which are available in the following location: DDD Investor Relation.
2. Featured images in this article are used under Creative Commons licenses and sourced from the following websites: Spatial Cardioidal Variations and 3D printing.
Disclosure
References and examples such as tables, charts, and diagrams are constantly reviewed to avoid errors, but we cannot warrant the total correctness of all content.
The content in this article is for informational purposes only and is neither a recommendation nor a piece of financial advice to purchase a stock.
If you find the information in this article helpful, please consider sharing it on social media and provide a link to this article from any website so that more articles like this can be created.
Thank you!

