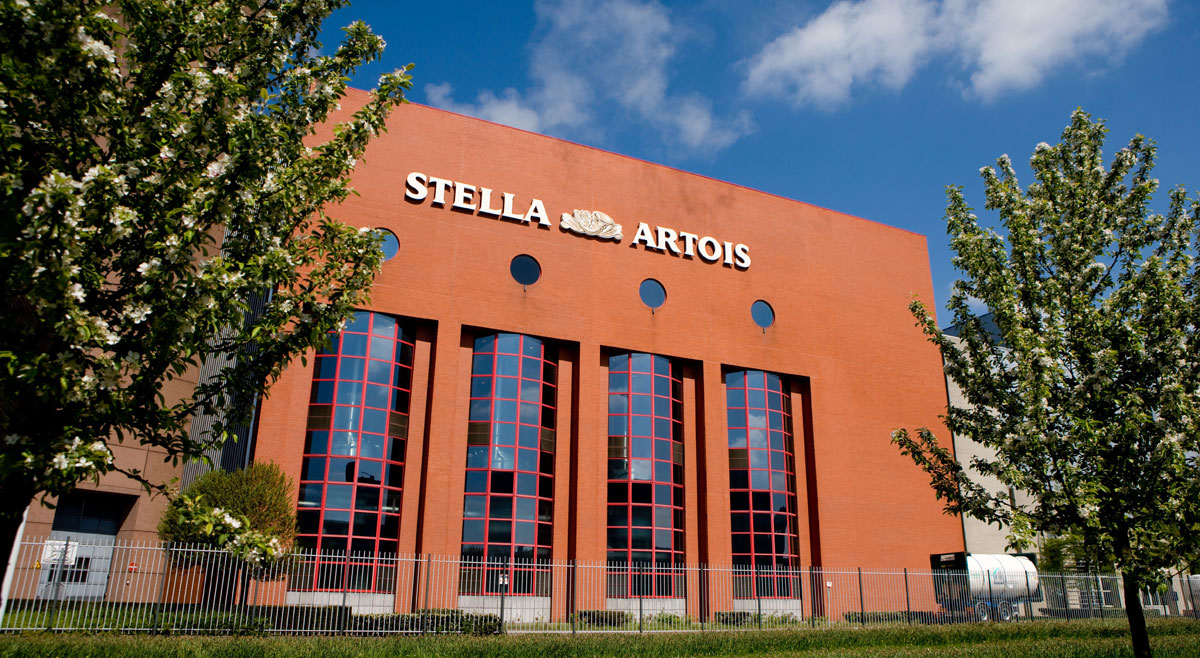
AB InBev’s Stella Artois Brewery. Source: Flickr
AB InBev, also known as Anheuser-Busch InBev, is a multinational beverage and brewing company formed in 2008 by merging Belgium-based InBev and American-based Anheuser-Busch.
With headquarters in Leuven, Belgium, and management offices in New York City, AB InBev is the largest brewer in the world, producing over 500 beer brands, including Budweiser, Corona, Stella Artois, and Beck’s.
This article covers AB InBev’s sales volume of various beverages, such as beer, alcoholic beverages, and non-alcoholic drinks.
Additionally, this article also looks at AB InBev’s sales volume by region or segment.
Investors interested in AB InBev’s revenue and profit margin may find more information on this page – AB InBev revenue breakdown and profit margin by segment.
Let’s take a look.
Please use the table of contents to navigate this page.
Table Of Contents
Definitions And Overview
O2. How Does AB InBev Market Its Products
O3. How Does AB InBev Distribute Its Products
Consolidated Sales Results
A1. Worldwide Sales Volume By Year
A2. Worldwide Sales Volume By TTM
Beverage Type Sales Results By Year
B1. Own-Beer, Non-Beer, And 3rd Party Products
B2. Percentage Of Own-Beer, Non-Beer, And 3rd Party Products
B3. Growth Rates Of Own-Beer, Non-Beer, And 3rd Party Products
Beverage Type Sales Results By TTM
C1. Own Beer
C2. Non-Beer
C3. Third-Party Products
Segment Sales Results By Year
D1. North America, Middle Americas, South America, etc.
D2. Percentage Of North America, Middle Americas, South America, etc.
D3. Growth Rates Of North America, Middle Americas, South America, etc.
Segment Results By TTM
E1. North America
E2. South America
E3. Middle Americas
E4. EMEA
E5. Asia Pacific
Summary And Reference
S1. Summary
S2. References and Credits
S3. Disclosure
Definitions
To help readers understand the content better, the following terms and glossaries have been provided.
Sales Volume: ABI’s sales volume is measured based on the product sales within the countries that comprise the business segment rather than based on products manufactured within that business segment but sold elsewhere.
North America: ABI’s North American region includes the following countries: United States and Canada.
Middle Americas: ABI’s Middle Americas region includes the following countries: the Caribbean, Colombia, Costa Rica, the Dominican Republic, Ecuador, El Salvador, Guatemala, Honduras, Mexico, Panama and Peru.
South America: ABI’s South American region includes the following countries: Argentina, Bolivia, Brazil, Chile, Paraguay and Uruguay.
EMEA: ABI’s EMEA region includes the following countries: Austria, Belgium, France, Germany, Ireland, Italy, Luxembourg, the Netherlands, Spain, Switzerland, the United Kingdom, Botswana, Ghana, Lesotho, Mozambique, Namibia, Nigeria, South Africa, Swaziland, Tanzania, Uganda and Zambia and other African, European and Middle East countries.
Asia Pacific: ABI’s Asia Pacific region includes the following countries: China, India, Japan, New Zealand, South Korea, Vietnam and other South Asian and Southeast Asian countries.
How Does AB InBev Market Its Products
AB InBev markets its products through various channels, such as advertising, sponsorships, and promotions. The company invests heavily in advertising campaigns to create brand awareness and promote its products.
It also sponsors various events and sports teams to reach a wider audience and build brand loyalty. In addition, AB InBev runs promotions and offers discounts to incentivize customers to purchase its products.
These marketing strategies help the company to maintain its market share and stay competitive in the industry.
How Does AB InBev Distribute Its Products
AB InBev uses a combination of direct and indirect distribution channels to get their products to consumers. Its distribution network includes warehouses, fleets of trucks, and sales representatives who work directly with retailers and bars.
AB InBev also partners with third-party distributors to expand their reach and improve efficiency. These distributors work with retailers and bars to stock AB InBev’s products and ensure they are available to customers in various locations.
Overall, AB InBev’s distribution strategy is designed to be flexible and adaptable to the needs of different markets and regions, allowing them to reach consumers worldwide effectively.
Worldwide Sales Volume By Year
AB InBev’s Worldwide Annual Sales Volumes
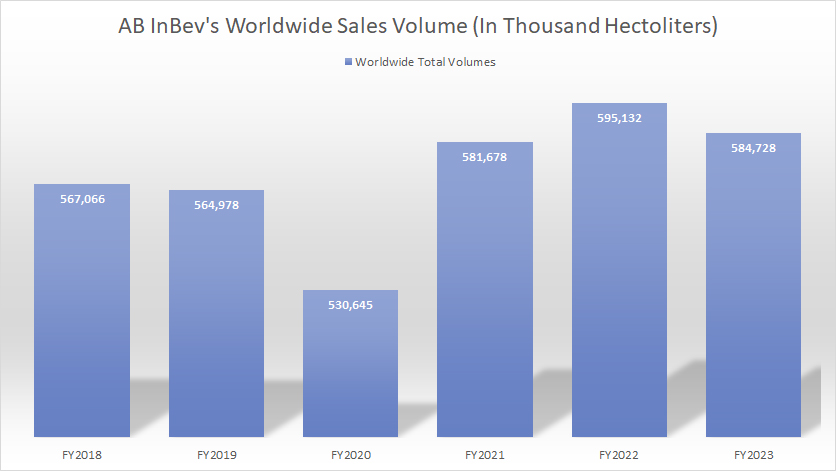
AB InBev sold 581.7 million, 595.1 million, and 584.7 million hectoliters of beverages globally in fiscal years 2021, 2022, and 2023, respectively. The 2023 result decreased 2% over 2022, but roughly in line with the 2021 result.
AB InBev experienced a significant decrease in worldwide sales volume in fiscal year 2020 when it sold just 530.6 million hectoliters of beverages, down 6% year-over-year.
Since 2018, AB InBev’s global sales volume has increased by just 3%.
Worldwide Sales Volume By TTM
AB InBev’s Worldwide Sales Volumes By TTM
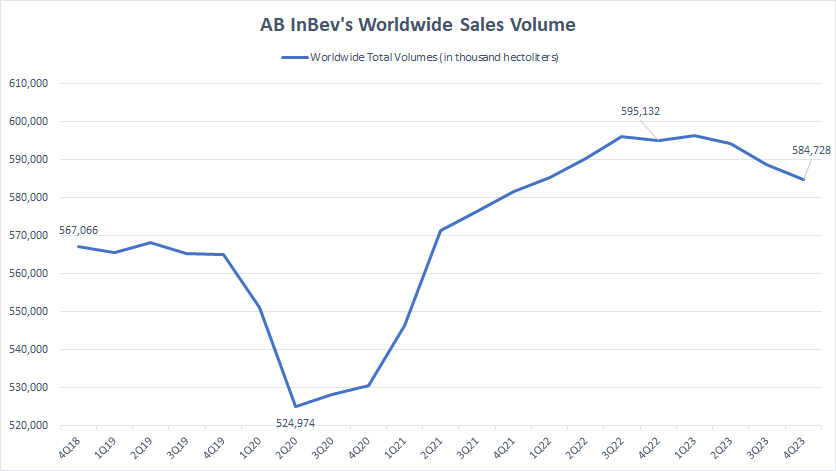
The TTM plot indicates a significant recovery in AB InBev’s global beverage sales volume in post-pandemic periods.
However, the recovery appears to have stalled since fiscal year 2023. As depicted in the chart, AB InBev’s global sales volume has steadily decreased after reaching its peak at 595.1 million hectoliters.
Own-Beer, Non-Beer, And 3rd-Party Products
ab-inbev-sales-volume-by-beverage-type-by-year
(click image to expand)
AB InBev’s own-beer and non-beer sales volume includes brands that it owns and licenses, third-party brands that it brews
or otherwise produces as a subcontractor and third-party products that it sells through its distribution network.
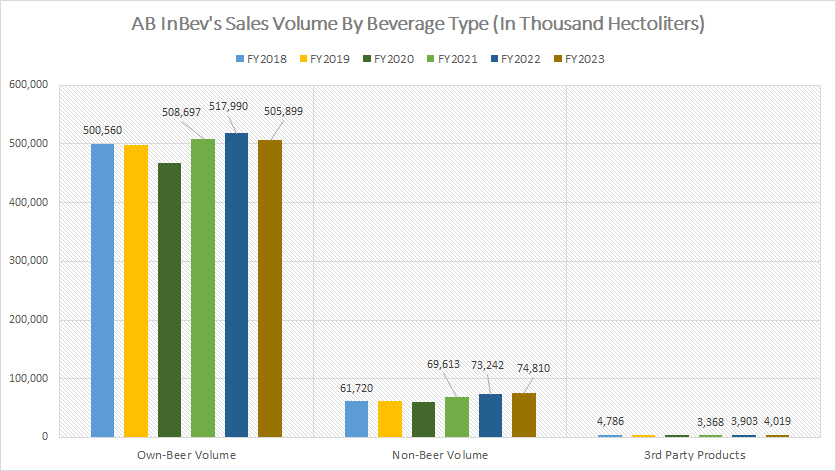
AB InBev is one of the world’s leading beer makers. In terms of its own beer volume, it sells around 500 million hectoliters per year, the highest in the industry. In 2023, the company sold about 505.9 million hectoliters of its own beer, a 2% decrease from the previous year. Since 2018, AB InBev’s own beer volume has gained by only 5.3 million hectoliters or 1%.
When it comes to non-alcoholic drinks, AB InBev sold 74.8 million hectoliters in 2023, up from 73.2 million hectoliters in 2022. This shows a positive trend in the company’s non-beer or non-alcoholic beverage sales, which have risen significantly since 2018. In fact, ABI’s non-beer sales volume has experienced a whopping 21% increase over the past six years since 2018.
On the other hand, AB InBev’s third-party product sales volume has been insignificant. The company sold only 4.0 million hectoliters of 3rd-party beverages in 2023 and about 3.9 million hectoliters in 2022. Since 2018, ABI’s 3rd-party product sales volume has been declining, down roughly 0.8 million hectoliters or 17% over the past six years.
Percentage Of Own-Beer, Non-Beer, And 3rd Party Products
ab-inbev-percentage-of-sales-volume-by-beverage-type-by-year
(click image to expand)
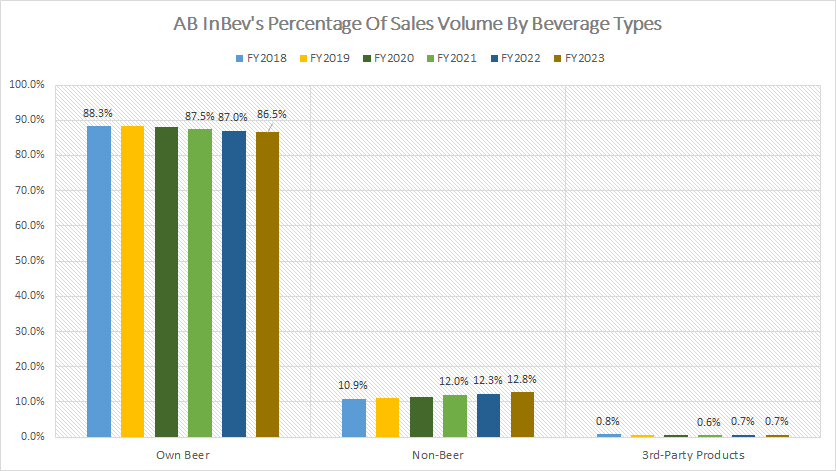
AB InBev’s own beer contributed a staggering 86.5% of sales to total volume in fiscal 2023, a figure that hasn’t changed much over the last six years and the largest among all beverage types.
AB InBev’s non-beer comprised only 12.8% of the total volume in fiscal 2023, while third-party products contributed less than 1%.
A significant trend is the increasing contribution from ABI’s non-beer segment. Since 2018, the ratio of AB InBev’s non-beer beverages has risen from 10.9% to 12.8% over the last six years.
Growth Rates Of Own-Beer, Non-Beer, And 3rd Party Products
ab-inbev-growth-rates-of-sales-volume-by-beverage-type-by-year
(click image to expand)
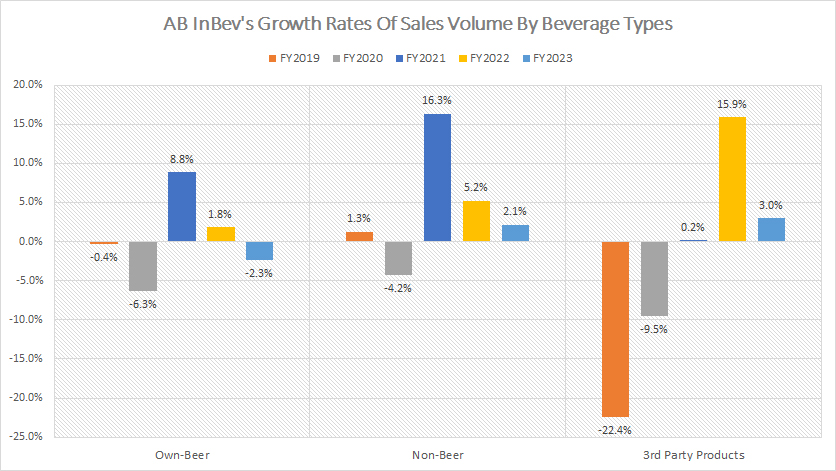
AB InBev’s fiscal year 2021 witnessed a turnaround in year-on-year growth rates, as illustrated in the chart above. Before this year, all segments had negative growth rates, including its own beer and 3rd-party products. Fiscal 2020 was the worst year for AB InBev as sales volumes for its own beer and non-beer decreased by high single digits.
However, in 2021, AB InBev managed to grow its own beer volume by 8.8% from the previous year and a massive 16.3% for the non-beer segment. The growth continued into 2023, although with lower growth rates compared to 2022, and the company’s own beer suffered a decline. AB InBev’s own beer volume decreased by 2.3% in 2023.
Despite the lower growth rates in 2023, ABI’s non-beer segment performed much better in all fiscal years than its own-beer segment. In fiscal 2023, ABI’s 3rd-party product sales volume grew 3% over 2022.
In summary, AB InBev has been able to grow the sales volumes of its non-beer or non-alcoholic segment at much better growth rates than its own-beer segment. Between 2018 and 2023, the growth rates of non-beer volume have been far better than that of own-beer volume.
Own Beer
ab-inbev-own-beer-sales-volume-by-ttm
(click image to expand)
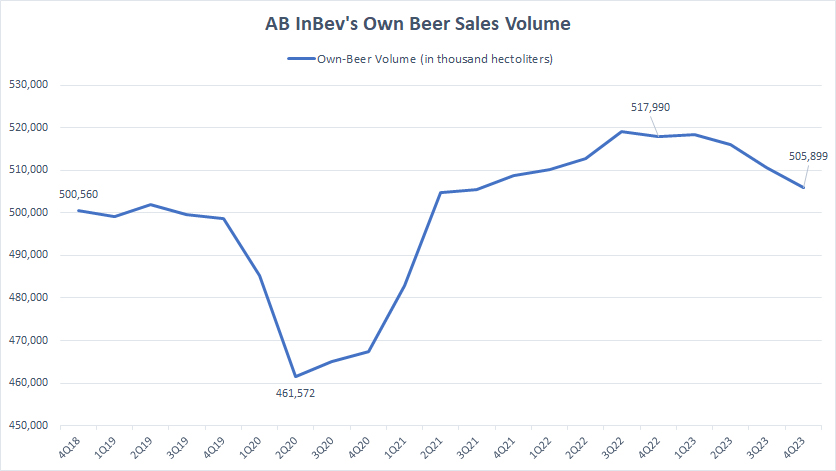
The TTM plot shows that AB InBev’s own beer sales volume has significantly improved in post-pandemic periods. However, the own beer volume has slightly decreased since 2023.
AB InBev’s own beer sales volume reached an all-time high of 518 million hectoliters in fiscal Q4 2022. After that, the sales volume of the company’s own beer has been declining.
Non-Beer
ab-inbev-non-beer-sales-volume-by-ttm
(click image to expand)
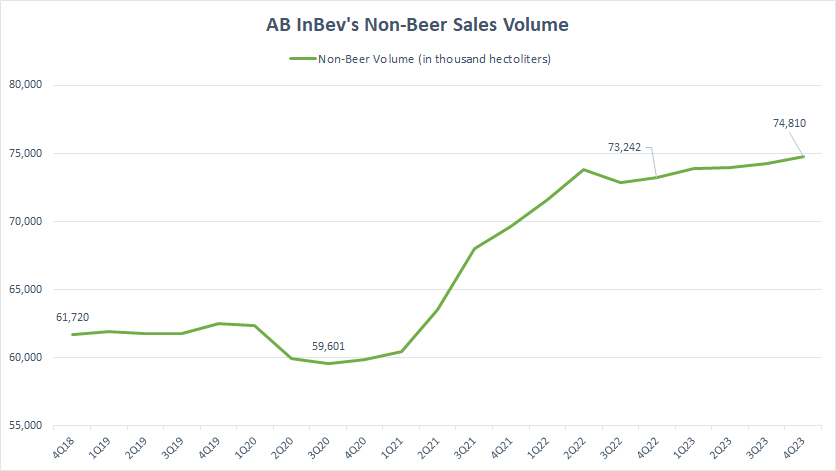
Although AB InBev’s own beer sales volume has slightly decreased since 2023, it is not the case for the non-beer segment.
As shown in the chart above, AB InBev’s non-beer sales volume has continued to move higher since 2023, reaching an all-time high of 74.8 million hectoliters as of 4Q 2023.
Third-Party Products
ab-inbev-third-party-product-sales-volume-by-ttm
(click image to expand)
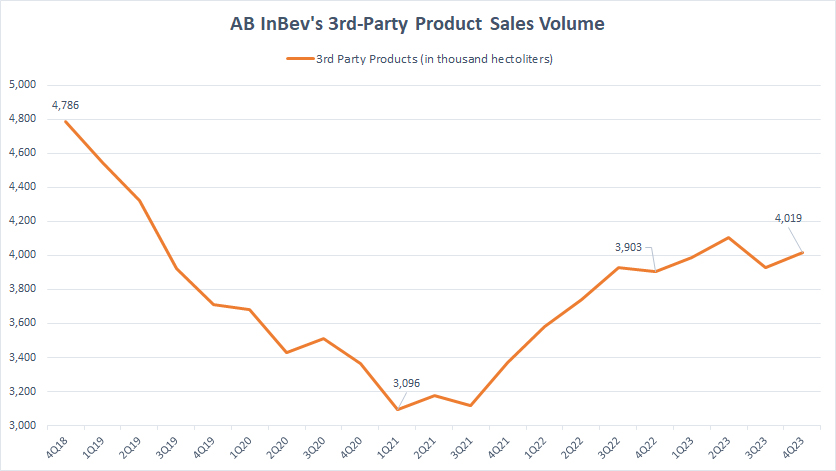
AB InBev’s 3rd-party product sales volume also has recovered considerably in post-pandemic periods. As of 4Q 2023, it reached 4 million hectoliters, a record high since 2021.
Although recovery has taken place, it is still much lower than pre-pandemic levels, indicating a slower-than-expected sales volume in third-party products.
North America, Middle Americas, South America, etc.
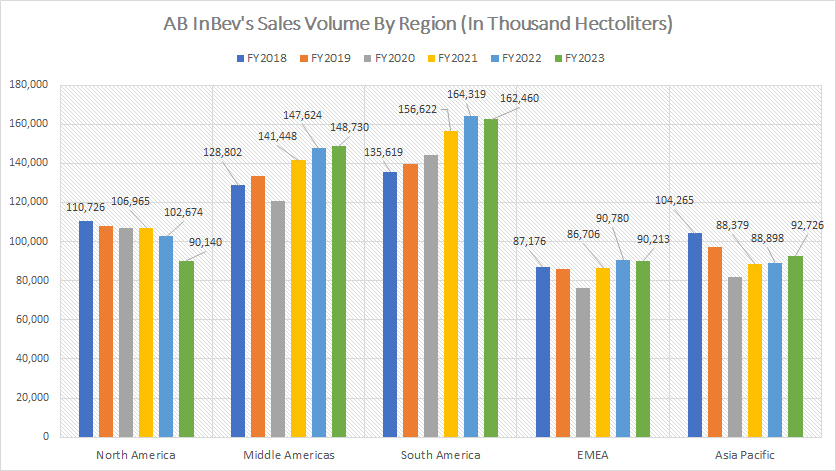
AB InBev’s Sales Volumes By Regions
The definitions of ABI’s sales volume and regions are available here: sales volume, North America, Middle Americas, South America, EMEA, and Asia Pacific.
AB InBev shipped the highest beverage volume in South America, with over 162.5 million hectoliters in fiscal year 2023. Following closely is the Middle Americas region, with a staggering 148.7 million hectoliters in beverage volume for the same period. AB InBev’s North American operation contributed around 90 million hectoliters of beverage volume to the company in 2023.
Historically, AB InBev has delivered the least volume of beverages in EMEA and Asia Pacific. However, both regions overtook the North American segment in fiscal 2023 by delivering 90.2 million and 92.7 million hectoliters of beverage volumes, respectively.
It’s important to note that South America and Middle Americas have been the only regions reporting an increase in sales volumes between FY2018 and FY2023. Most other regions have remained flat or reported a decrease in sales volumes. North America, in particular, has seen a considerable decline in sales volume since 2018.
In contrast, AB InBev’s South America and Middle Americas segments have shown resilience with consistently rising sales volumes. This increase even occurred during the COVID-19 pandemic in 2020.
Percentage Of North America, Middle Americas, South America, etc.
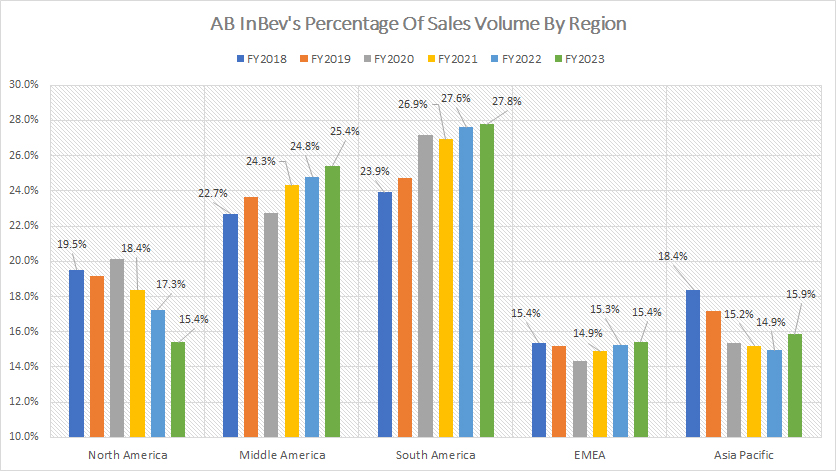
ABI’s percentage of region to total volume
The definitions of ABI’s sales volume and regions are available here: sales volume, North America, Middle Americas, South America, EMEA, and Asia Pacific.
AB InBev’s sales volume has been contributed mainly by South America, which reached a record 27.8% in 2023. The Middle Americas region comes in second with 25.4% of the total volume in the same year.
On the other hand, the EMEA and Asia Pacific segments only contributed 15.4% and 15.9%, respectively. AB InBev’s North America made the least contribution, with only 15.4% in fiscal 2023.
It is worth noting that the South America and Middle Americas regions have seen an increase in their percentage contribution between 2018 and 2023, while the North American, European, Middle Eastern, African, and Asia Pacific regions have all experienced a decline in their contributions over the past six years.
Growth Rates Of North America, Middle Americas, South America, etc.
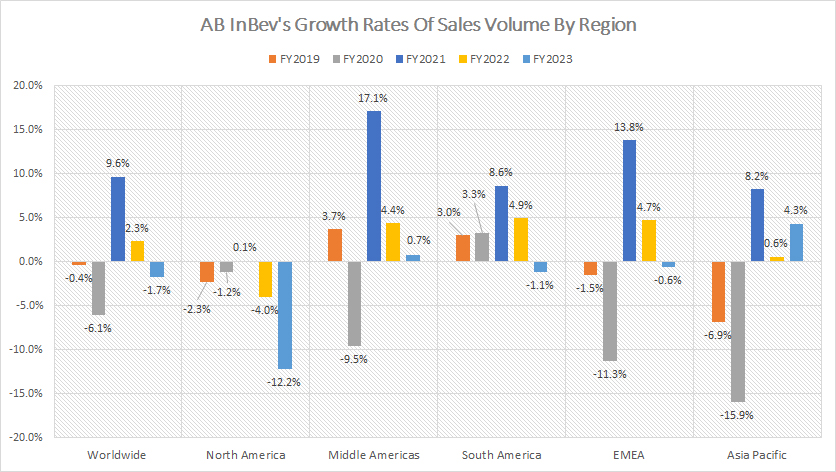
ABI’s regional growth rates
The definitions of ABI’s sales volume and regions are available here: sales volume, North America, Middle Americas, South America, EMEA, and Asia Pacific.
As the chart above indicates, AB InBev’s South American operation has been the most resilient among all segments. The South American segment has reported favourable yearly growth rates of 8.6%, 4.9%, and -1.1% in 2021, 2022, and 2013, respectively. On average, the South America segment has grown by 4.1% annually between 2021 and 2023.
On the other hand, AB InBev’s North America has had the worst growth, with a sales volume decline of 5.4% annually on average since 2021. In 2023, AB InBev’s sales volume in North America decreased by a staggering 12.2% year-over-year. AB InBev’s Asia Pacific segment also has struggled, with negative growth rates reported mainly in pre-COVID periods. In post-COVID periods, the Asia Pacific has been reporting phenomenal sales growth.
AB InBev’s sales growth in the Middle Americas has been one of the highest among all segments, averaging 7.4% between 2021 and 2023. The Europe, Middle East, and Africa (EMEA) segment has also reported impressive sales growth, which averaged around 6.0% over the last three years.
On a consolidated basis, AB InBev’s worldwide sales growth averaged 3.4% between 2021 and 2023.
North America
ab-inbev-north-america-sales-volume
(click image to expand)
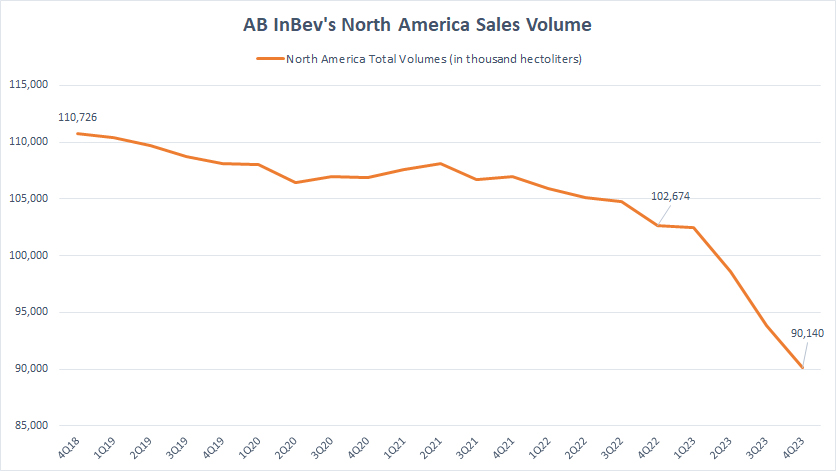
The definitions of ABI’s sales volume and regions are available here: sales volume and North America.
AB InBev has struggled to grow its sales volume in North America. As depicted in the chart above, ABI’s sales volume in North America has continued to decrease, even in post-pandemic periods.
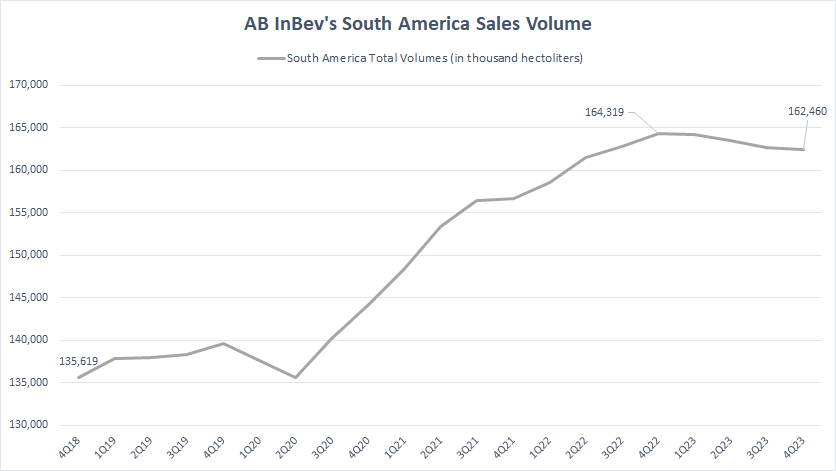
South America
ab-inbev-south-america-sales-volume
(click image to expand)
The definitions of ABI’s sales volume and regions are available here: sales volume and South America.
On the contrary, AB InBev’s sales volume in South America has significantly grown in post-COVID periods, reaching 162.5 million hectoliters as of 4Q 2023, one of the new highs ever measured.
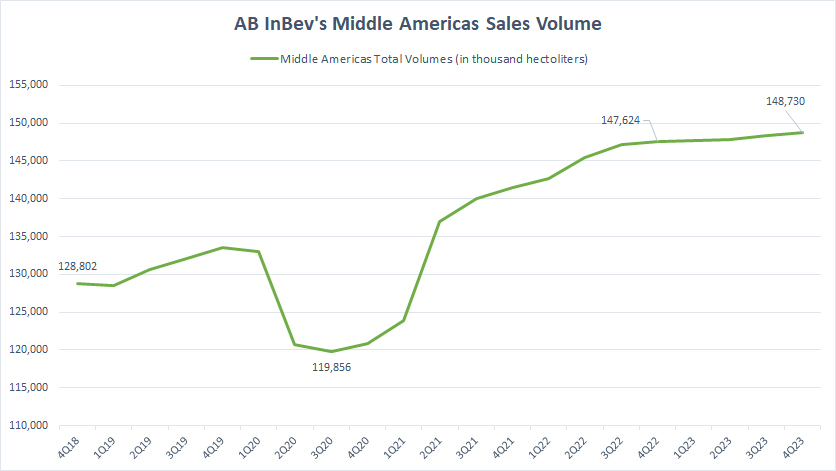
Middle Americas
ab-inbev-middle-americas-sales-volume
(click image to expand)
The definitions of ABI’s sales volume and regions are available here: sales volume and Middle Americas.
AB InBev has continued to post record sales figures in the Middle Americas segment, particularly in post-COVID periods. As seen, AB InBev’s sales volume in the Middle Americas reached a record high of 148.7 million hectoliters as of 4Q 2023.
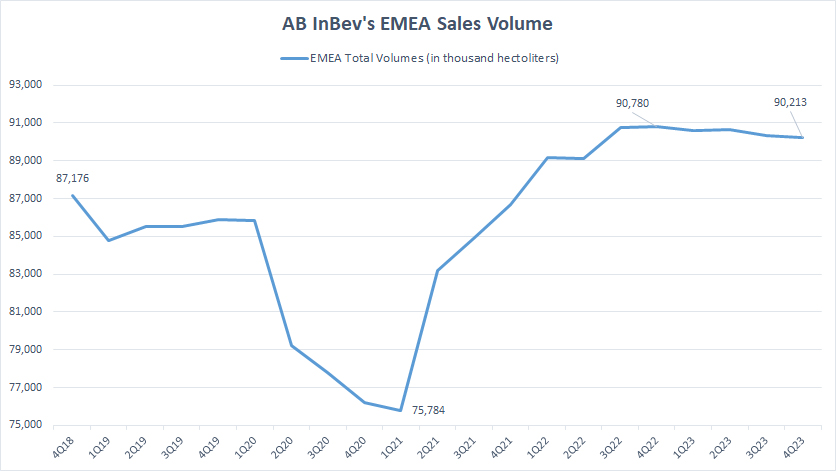
Europe, Middle East And Africa (EMEA)
ab-inbev-emea-sales-volume
(click image to expand)
The definitions of ABI’s sales volume and regions are available here: sales volume and EMEA.
AB InBev’s sales volume in the EMEA region has risen significantly in post-COVID periods. As of 4Q 2023, AB InBev sold a record figure of 90.2 million hectoliters of beverages under the EMEA segment on a TTM basis.
Asia Pacific
ab-inbev-asia-pacific-sales-volume
(click image to expand)
The definitions of ABI’s sales volume and regions are available here: sales volume and Asia Pacific.
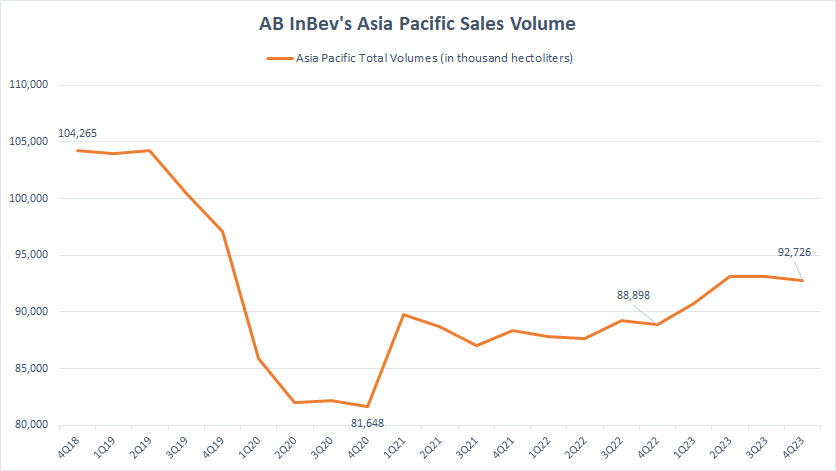
AB InBev’s sales volume in the Asia Pacific has not been able to take off successfully after a significant dive during the COVID-19 period.
As seen, as of 4Q 2023, AB InBev sold only 92.7 million hectoliters of beverages on a TTM basis in the Asia Pacific, a far lower figure than that reported in the pre-COVID periods.
The reason for ABI’s slow recovery in the Asia Pacific is partially due to the divestment of the Australian subsidiary in 2019, which has caused a significant decline in volume in subsequent years.
Nevertheless, since 2020, AB InBev’s sales volume in the Asia Pacific has steadily improved, and the 4Q 2023 result represents a rise of 4.3% year-on-year.
Conclusion
AB InBev’s beverage sales volumes have been rising in most regions, following a dramatic decline during the COVID-19 pandemic, indicating that the company has been recovering since 2020.
Non-beer sales volume grew at a faster rate than the beer volume. Countries in the South American region have shown the most resilience in terms of volume growth rates during most fiscal years.
AB InBev’s sales volume in South America has been increasing even during challenging times like a pandemic, an ongoing war, supply chain disruptions, or inflationary environments. The South American region is ABI’s largest market by sales volume, while North America has become the smallest market.
References and Credits
1. All financial figures presented in this article were obtained and referenced from AB InBev’s earnings releases, quarterly and annual reports, SEC filings, presentations, press releases, etc., which are available in AB InBev Investor Relation.
2. Featured image was used under Creative Common Licenses and obtained from toyohara and VISITFLANDERS.
Disclosure
The content in this article is for informational purposes only and is neither a recommendation nor a piece of financial advice to purchase a stock.
If you find the information in this article helpful, please consider sharing it on social media and provide a link back to this article from any website so that more articles like this can be created in the future.
Thank you!

