TV streaming. Pixabay Image.
This article covers the debt, liquidity, several debt ratios, and credit ratings of Roku, Inc. (NASDAQ:ROKU).
For debt, we will explore several measurements which include the net debt, debt-to-equity, debt-to-ebitda, and debt-to-asset ratios as well as the interest coverage ratio.
For liquidity, we will go over Roku’s debt maturities and payments due as well as the company’s sources of liquidity. In this aspect, Roku’s ability to repay its debt or any amounts owed will be investigated.
Finally, we will find out the credit rating of Roku to see how rating institutions rate the company’s debt.
Let’s get started!
Please use the table of contents to navigate this page.
Table Of Contents
Definitions And Overview
O2. How Does Roku Use Its Debt?
Debt And Cash
A1. Total Debt
A2. Total Debt And Leases
A3. Total Cash
Net Debt
A4. Total Debt And Leases Less Total Cash
Leverage Ratios
B1. Debt To Equity Ratio
B2. Debt To Asset Ratio
B3. Debt To EBITDA Ratio
Interest Coverage Ratio
C1. Interest Expense
C2. Interest Expenses To Operating Income Ratio
C3. Interest Expenses To Adjusted EBITDA Ratio
Debt Schedules, Liquidity And Credit Rating
D1. Payment Due
D2. Sources Of Liquidity
D3. Credit Rating
Summary And Reference
S1. Conclusion
S2. References and Credits
S3. Disclosure
Definitions
To help readers understand the content better, the following terms and glossaries have been provided.
Adjusted EBITDA: Adjusted EBITDA refers to Earnings Before Interest, Taxes, Depreciation, and Amortization that have been modified to exclude one-time, irregular, and non-operational items.
This financial metric adjusts the EBITDA figure by removing elements that are considered non-recurring, such as restructuring costs, non-cash expenses like stock-based compensation, and other items that the company deems not reflective of its core operating performance.
These adjustments provide a clearer picture of a company’s operational profitability and cash flow generation by focusing solely on the revenues and costs directly tied to the core business activities.
This makes it easier for investors and analysts to compare financial performance across different periods and between companies by minimizing the impact of accounting and financial policies.
Roku’s adjusted EBITDA excludes other income (expense), net, stock-based compensation expense, depreciation and amortization, restructuring
charges, and income tax (benefit)/expense from the net income (loss) of the period, according to the 2023 4Q earnings call.
Debt To Asset Ratio: The debt-to-asset ratio is a financial metric that measures the percentage of a company’s assets financed by debt. It is calculated by dividing the company’s total liabilities by its total assets. The formula looks like this:
Debt to Assets Ratio = Total Liabilities / Total Assets
This ratio is important because it provides insights into the company’s financial leverage, indicating how much of the company’s assets are funded by debt.
A higher ratio suggests that the company relies more heavily on debt to finance its assets, which can be riskier, especially during a financial downturn.
Conversely, a lower ratio indicates that the company is less dependent on debt and may have a stronger equity position. Investors and creditors often use this ratio to assess a company’s financial health and risk profile.
How Does Roku Use Its Debt?
Roku, like many companies, may use its debt to finance various aspects of its operations and growth strategies. Here are some common ways Roku might utilize its debt:
1. **Expansion**: Roku can use borrowed funds to expand its market reach, including entering new geographical territories or investing in marketing campaigns to attract more users to its platform.
2. **Research and Development**: In the tech industry, staying ahead means constantly innovating. Debt can finance R&D efforts to develop new products, features, and technologies that enhance Roku’s offerings.
3. **Content Acquisition**: For platforms like Roku that rely on streaming content, securing rights to movies, TV shows, and other forms of entertainment is crucial. Debt can be used to fund these content acquisitions, ensuring that Roku remains competitive by offering a wide variety of viewing options.
4. **Infrastructure Investment**: Maintaining and upgrading the technical infrastructure to support streaming services at a large scale requires significant investment. This can include server capacity, network improvements, and cybersecurity measures, all of which can be financed through debt.
5. **Strategic Acquisitions**: Roku may use debt to fund the acquisition of other companies that can complement or enhance its existing services, expand its technology portfolio, or eliminate competition.
6. **Working Capital**: Debt can also provide Roku with the necessary working capital to manage day-to-day operations, such as paying salaries, rent, and other operational expenses.
Using debt financing has its advantages, such as not diluting shareholder equity and potentially offering tax benefits (interest payments on debt are often tax-deductible). However, Roku needs to manage its debt levels carefully to ensure it does not take on more debt than it can afford to repay, especially considering the interest payments and the potential impact on its financial health and flexibility.
Total Debt
roku-total-debt
(click image to enlarge)
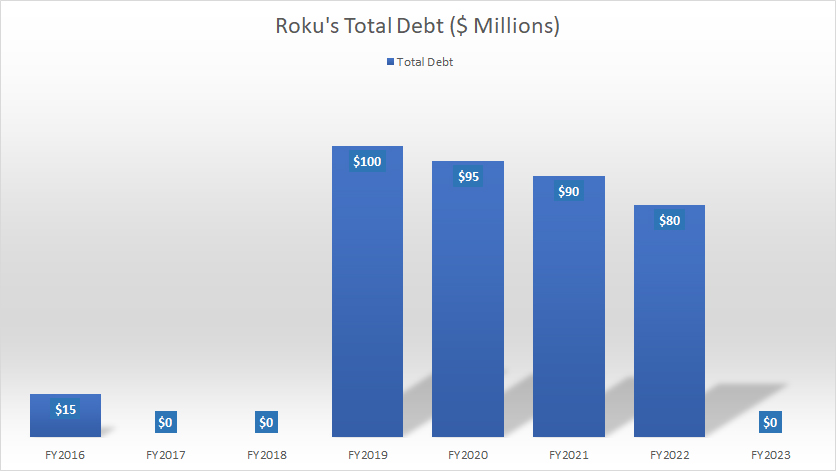
As of 2023, Roku already repaid all prior borrowings and carried no debt. Even before fiscal 2023, Roku carried very little to no debt.
The largest total debt that Roku ever had totaled just $100 million and this was in 2019. The company has already repaid all of the amount owed. Therefore, Roku had no debt as of 4Q 2023.
Total Debt And Leases
roku-total-debt-and-leases
(click image to enlarge)
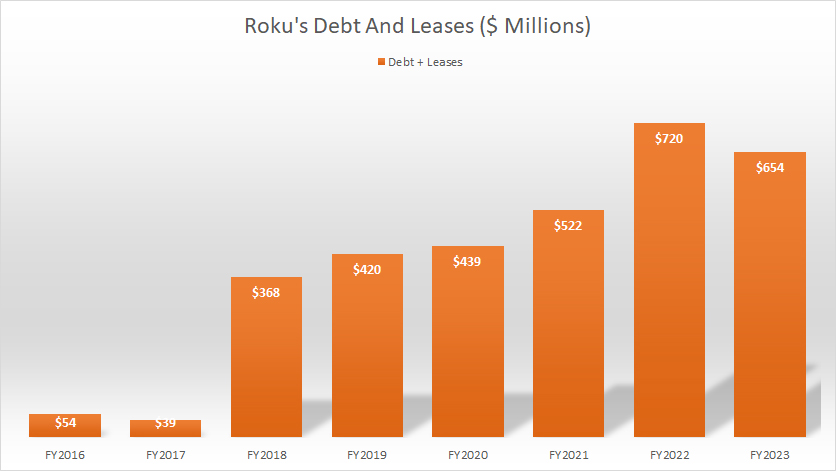
Although Roku had no debt as of 4Q 2023, the company did carry a significant amount of leases, and it totaled $654 million in the same period.
Of this amount, roughly $68 million was categorized as the current portion, which means that it will be due within a year starting from 4Q 2023.
A trend worth pointing out is the growing amount of leases that Roku has carried over the years. As seen in the chart, Roku’s leases have been increasing since 2016, reaching its peak figure of $720 million in fiscal 2022 before decreasing slightly to $654 million in 2023.
Although Roku did not have debt, the lease obligations that the company carried in the latest period was quite significant.
Total Cash
roku-total-cash
(click image to enlarge)
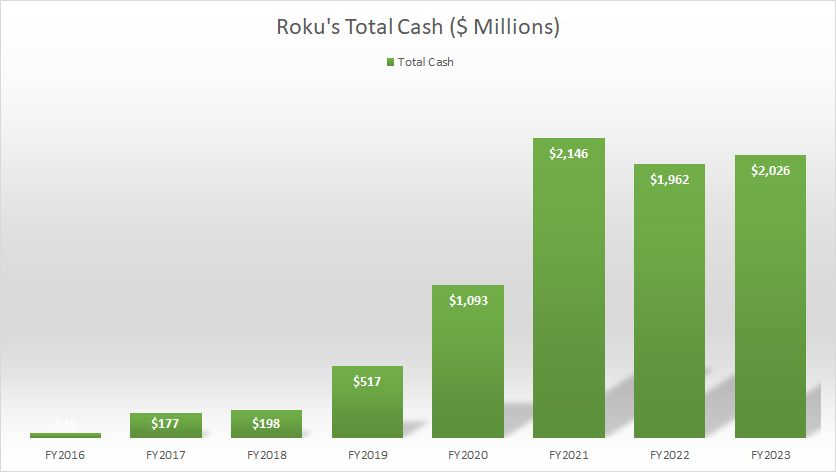
Roku carries considerable amount of cash.
As of 4Q 2023, Roku’s total cash amounted to $2.0 billion, one of the largest figures ever measured. This amount of cash position came primarily from cash and cash equivalents.
Total Debt And Leases Less Total Cash
roku-net-debt
(click image to enlarge)
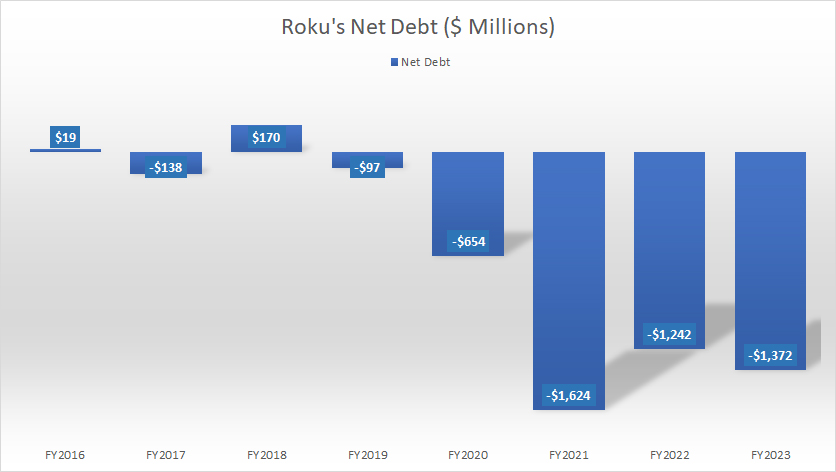
Due to the much higher cash balance, Roku’s net debt has been mostly negative, as shown in the chart above.
As of 4Q 2023, Roku’s net debt measured -$1.4 billion after accounting for the leases. On average, Roku’s net debt measured -$1.4 billion between 2021 and 2023.
Debt To Equity Ratio
roku-debt-to-equity-ratio
(click image to enlarge)
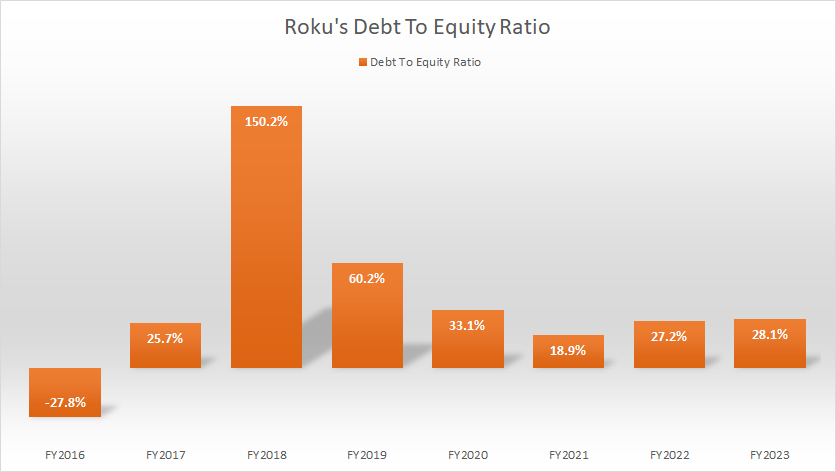
Roku’s total amount of debt and leases represent only 28.1% of the company’s equity as of 4Q 2023, a considerably low leverage in my opinion.
The majority of this ratio is contributed by leases in most fiscal years. Without leases, Roku’s debt-to-equity ratio would be very little.
In addition, Roku’s debt-to-equity ratio also has been on the decline over the years, largely driven by the company’s aggressive repayments of debt.
Debt To Asset Ratio
roku-debt-to-assets-ratio
(click image to enlarge)
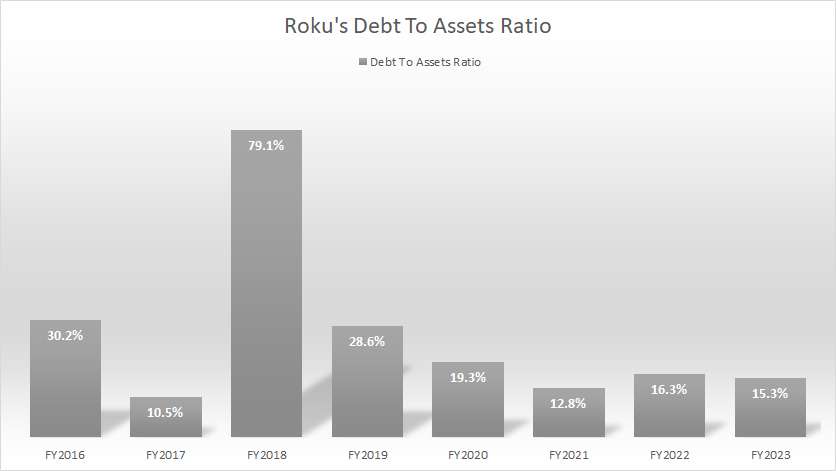
The definition of debt-to-asset ratio is available here: debt-to-asset ratio. The debt-to-asset ratio reflects Roku’s capital structure, also known as the debt structure.
As of fiscal 4Q 2023, Roku’s total debt and leases accounted for only 15.3% of the company’s total assets, suggesting that debt and leases made up only a small portion of the company’s capital structure.
Similarly, the majority of this ratio is contributed by leases in most fiscal years. Without leases, Roku’s debt leverage with respect to total assets would be even smaller.
This ratio also has declined considerably over the years, suggesting that the company borrows little to no debt and has repaid most of the debt owed.
Debt To EBITDA Ratio
roku-debt-to-ebitda-ratio
(click image to expand)
The definition of Roku’s EBITDA is available here: adjusted EBITDA.
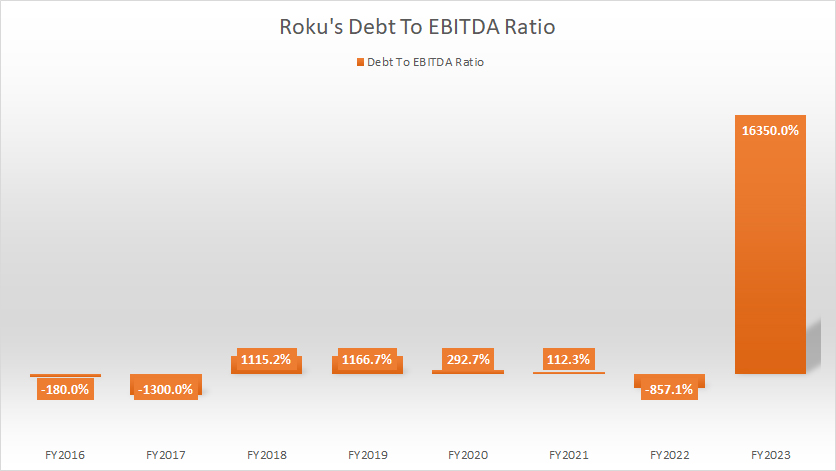
Roku has experienced poor debt-to-ebitda ratio in most periods, due largely to the low EBITDA produced by the company. For example, Roku generated just $4 million in adjusted EBITDA in 2023, while it was -$84 million in 2022. Roku generated a record adjusted EBITDA in 2021, notably at $465 million, the highest ever reported.
Due to the poor adjusted EBITDA, Roku has seen extremely large debt-to-ebitda ratio. The reason is that the debt is many times greater than the EBITDA.
In fiscal year 2023, Roku’s debt-to-ebitda ratio topped 16350%, as the adjusted EBITDA measured just $4 million.
Interest Expense
roku-interest-expenses
(click image to enlarge)
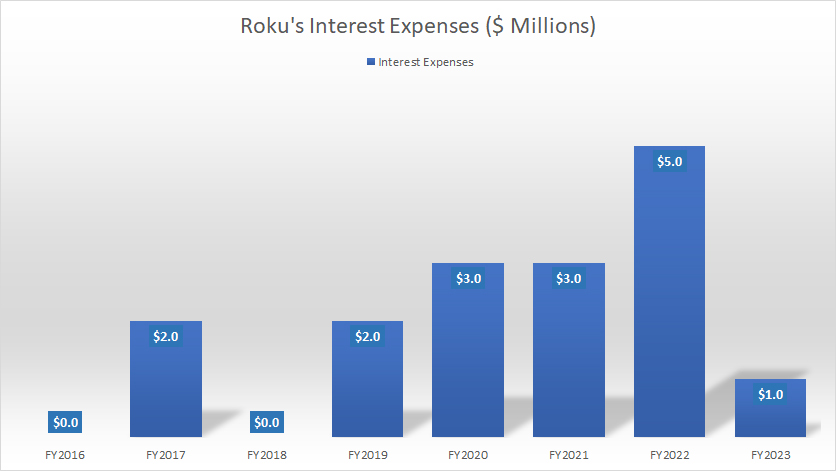
Since Roku has not had that much debt, it has very little interest expenses.
The majority of the interest expense, I believe, comes from leases as leases are much larger than debt which we saw in prior discussions.
As of fiscal 2024, Roku’s interest expense totaled just $1 million, one of the lowest figures ever recorded.
In short, Roku’s interest expenses are insignificant.
Interest Expenses To Operating Income Ratio
roku-interest-expenses-to-operating-income-ratio
(click image to enlarge)
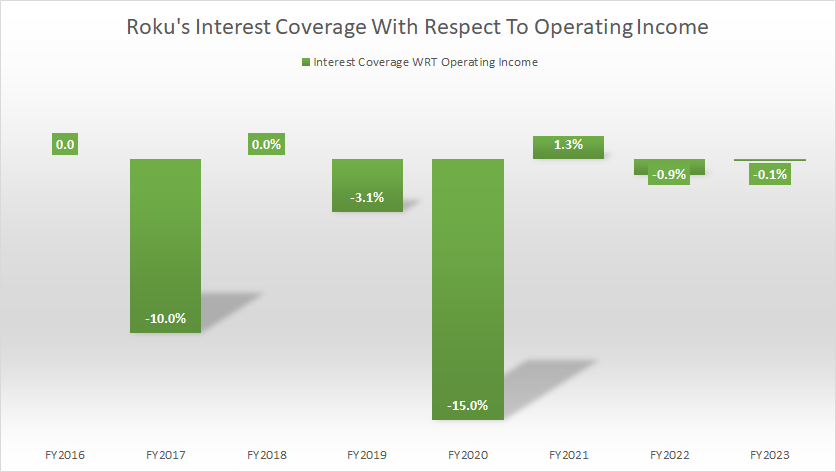
For your information, Roku has made little to no profit all these years, according to this article – Roku Profit And Margin.
As a result, Roku has not been able to cover the interest expenses with its operating income irrespective of how small the numbers are.
As shown in the chart above, most of Roku’s interest coverage ratios are negative, due primarily to the negative operating income.
In fiscal year 2021, Roku generated positive operating income. The respective interest coverage ratio totaled only 1.3%, indicating the insignificant amount of incurred interest expenses by the company.
Interest Expenses To Adjusted EBITDA Ratio
roku-interest-expenses-to-adjusted-ebitda-ratio
(click image to enlarge)
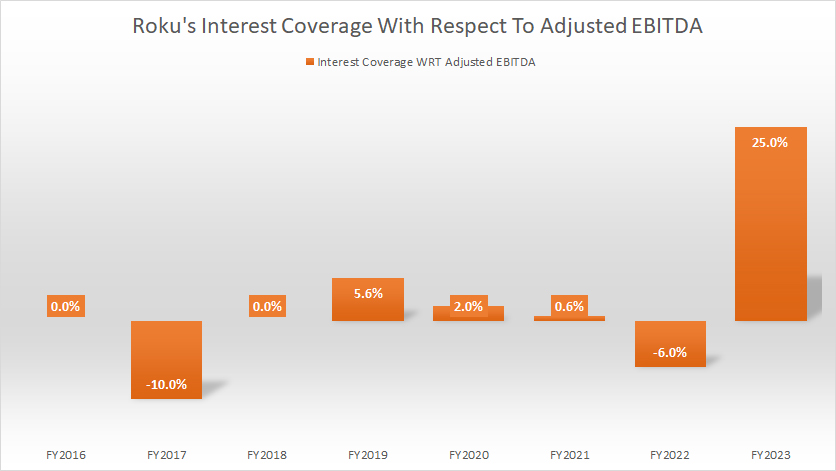
The definition of Roku’s adjusted EBITDA is available here: adjusted EBITDA. Similar to the operating income, Roku produces little to no adjusted EBITDA.
Therefore, with respect to the adjusted EBITDA, Roku has not been able to cover the interest expenses in most fiscal years.
For fiscal years when positive EBITDA was generated, the interest coverage ratio came in at only a few percentage points, illustrating the insignificant amount of interest expenses with respect to the adjusted EBITDA.
Payment Due
Roku Inc.’s payments due figures are based on the 2023 annual report dated 31 Dec 2023.
| Types Of Payments | Amount Due In Million Of USD | |||
|---|---|---|---|---|
| 2024 | 2025 | 2026 | Thereafter | |
| Operating Leases | $90 | $99 | $100 | $483 |
| Debt | $0 | $0 | $0 | $0 |
| Non-Cancelable Manufacturing Purchase Commitments | $33 | $33 | $33 | $33 |
| Content Commitments | $185 | $63 | $22 | $17 |
| Total | $308 | $195 | $155 | $533 |
The table above shows Roku’s expected amount due in different years based on the types of debt. These payments are to be paid in cash.
Some of these amounts may be off-balance sheets as they haven’t met the criteria for asset recognition. All said, for fiscal year 2024, the expected amount that comes due is estimated at $308 million.
This amount includes various types of debt such as leases, manufacturing purchase commitments, and content commitments.
For fiscal 2025, Roku’s expected amount that comes due is estimated at $195 million while a total sum of $155 million is expected to come due in fiscal 2026.
Between 2024 and 2026, Roku’s total amount that needs to be paid in cash is roughly $700 million.
Does Roku have sufficient liquidity to cover the expected payment due in the next 3 years? We will find out in the next section.
Sources Of Liquidity
Roku Inc.’s total liquidity data are based on the 2Q 2023 quarterly report dated 30 June 2023.
| Sources Of Liquidity | USD In Millions | |
|---|---|---|
| Committed Capacity | Available Capacity | |
| Cash & Cash Equivalents | – | $2,026 |
| Letters Of Credit | – | $37.5 |
| Annual Operating Cash Flow | – | $165 (estimated) |
| Total | – | $2,229 |
Roku Inc.’s sources of liquidity include cash and cash equivalents, letters of credit, and cash provided by operating activities.
Roku’s total liquidity is estimated at more than $2 billion based on the 2023 quarterly report. In the prior discussion, we saw that Roku’s expected cash payment between 2024 and 2026 is estimated at $700 million.
Since Roku has over $2 billion of cash, the company’s liquidity should be sufficient to cover for all payments due in the next 3 years until 2026.
Even without the operating cash flow, Roku’s cash balance alone is able to cover all payments due between 2024 and 2026 and may even be enough to pay for the remaining $533 million of expected cash payment after 2026.
The following quote shows what Roku said about its liquidity in the 2023 annual report:
- “We believe our existing cash and cash equivalents balance will be sufficient to meet our working capital, capital expenditures, and material cash requirements from known contractual obligations for the next twelve months and beyond.”
In short, Roku Inc. has enough liquidity to meet all payment obligations all the way to fiscal 20256and possibly beyond.
Credit Rating
Roku Inc.’s credit rating as of 30 June 2023.
| Rating Institutions | Types Of Indebtedness | Outlook | |
|---|---|---|---|
| Long-Term Debt | Short-Term Debt | ||
| Standard & Poor’s | N.A. | N.A. | N.A. |
| Moody’s | N.A. | N.A. | N.A. |
| Fitch | N.A. | N.A. | N.A. |
As of 31 Dec 2023, Roku Inc. has not published any credit rating regarding its debt obligation in its 2023 annual report.
Besides, the company did not have any short-term or long-term debt obligations as of 4Q 2023.
Therefore, the matter of credit rating was not applicable at this moment.
Conclusion
In summary, Roku Inc. had no debt but had lease obligations that totaled more than $600 million as of the end of fiscal 2023.
Despite the seemingly high lease obligation, Roku’s leverage with respect to assets, equity, and EBITDA was low and had somewhat declined in the last several years.
Moreover, the company had cash and cash equivalents totaling $2 billion which should be sufficient to cover all payments due in the next 3 years or until 2026.
In short, Roku had sufficient liquidity to meet all payment obligations until 2026 and possibly beyond.
References and Credits
1. All financial figures presented in this article were obtained and referenced from Roku, Inc.’s SEC filings, earnings reports, financial statements, news releases, shareholder letters, etc., which are available at Roku Financial Results.
2. Featured images in this article are obtained free and are used without any attribution from Pixabay.
Disclosure
References and examples such as tables, charts, and diagrams are constantly reviewed to avoid errors, but we cannot warrant the full correctness of all content.
The content in this article is for informational purposes only and is neither a recommendation nor a piece of financial advice to purchase a stock.
If you find the information in this article helpful, please consider sharing it on social media and also provide a link back to this article from any website so that more articles like this one can be created in the future.
Thank you!

