Ford GT. Flickr Image
The assets of a company are the most important part of a company as they represent the future economic benefits that the company will receive.
The future economic benefits can be in the form of monetary or non-monetary.
For example, monetary benefits are revenue, sales, income, costs, etc.
Non-monetary benefits are protection, efficiency, improvement, etc.
In this article, we will look at Ford Motors Company’s (NYSE:F) assets from different perspectives, including the breakdown of its current and long-term portions as well as the growth of a certain type of assets.
Let’s explore Ford’s assets!
Ford’s Total Assets
Ford total assets
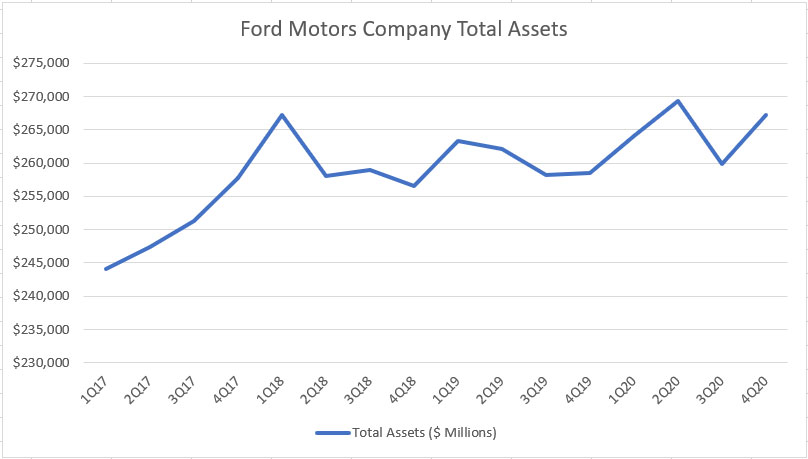
Let’s first explore Ford’s total assets which are shown in the chart above for the period from 2017 to 2020.
Over the last 4 years, Ford’s total assets had slightly increased from $245 billion in 1Q 2017 to $265 billion by the 4th quarter of 2020.
The jump in total assets occurred mostly in 2017 while it remained flat from 2018 to 2020.
Ford’s total assets increment may not necessarily represent a good indicator of the company’s financial health.
There are other metrics that we need to look at such as the usage efficiency and the types of assets that have been added.
Breakdown of Ford’s Total Assets
Ford total assets breakdown
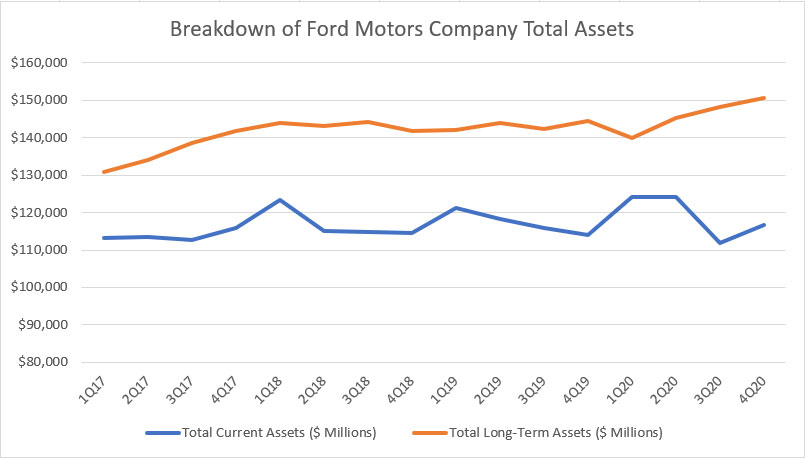
Ford’s total assets are broken down into current and long-term portions as shown in the chart above.
According to the chart, Ford’s current assets have hardly budged between 2017 and 2020, staying mostly flat at about $116 billion throughout the 4 years.
However, Ford’s current assets increased significantly to $124 billion in the 1st half of 2020 when the COVID-19 pandemic first struck, indicating that the company had shored up its short-term liquidity in preparation for the outbreak.
On the flipped side, Ford’s non-current or long-term assets have increased steadily between 2017 and 2020, growing from $130 billion in 1Q 2017 to $150 billion as of 2020 Q4.
We will plunge into Ford’s long-term assets in subsequent discussions to find out which long-term assets have increased.
All in all, Ford’s total assets are almost equally divided between current and non-current assets, with non-current assets taking up a slightly higher portion at 56%.
Ford’s Current Assets Breakdown
Ford current assets breakdown
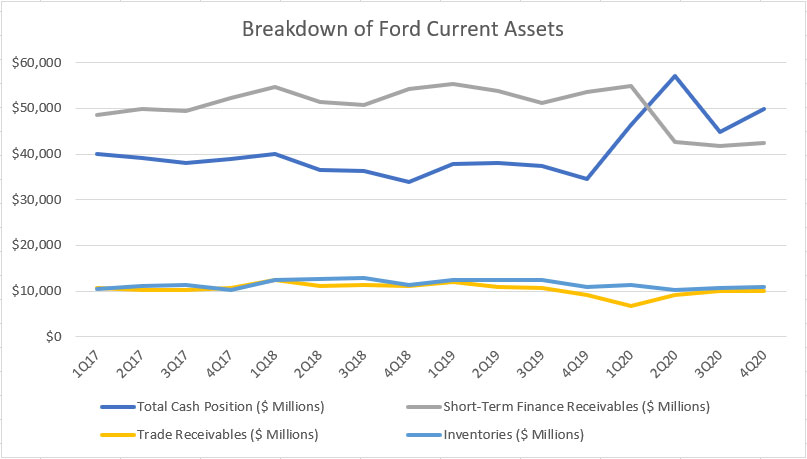
Ford’s total current assets are mostly made up of cash position, short-term finance receivables, trade receivables and inventories as shown in the chart above.
Between 2017 and 2020, Ford’s trade receivables and inventories have hardly changed in the last 4 years.
In contrast, we are seeing a significant rise in Ford’s cash position throughout 2020.
For your information, Ford’s cash position consists of cash and cash equivalents and marketable securities.
These are highly liquid assets that can be deployed instantly for any corporate purpose.
That said, Ford’s cash position increased to nearly $60 billion in 2Q 2020 while staying north of $40 billion in most quarters in 2020.
As mentioned, Ford increased its cash position to pump liquidity into its balance sheets to better prepare for a possible liquidity crunch driven by loan payment default and lower vehicle demand.
Another thing worth mentioning is the short-term finance receivables which have declined significantly in 2020.
We will come to the finance receivables topic in a separate discussion later.
Ford’s Long-Term Assets Breakdown
Ford long-term assets breakdown
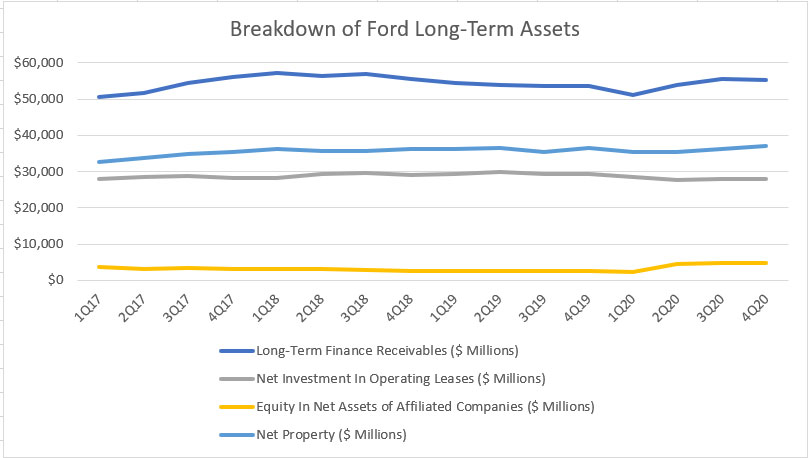
The long-term finance receivables made up the largest portion of Ford’s long-term assets at over $55 billion as of Q4 2020.
Ford’s property and operating leases also made up a significant portion of Ford’s long-term assets at $37 billion and $28 billion, respectively, in 4Q 2020.
Ford’s equity in affiliated companies was the least at only $4.9 billion as of 2020 Q4.
While the values of the equity in affiliated companies may look insignificant, this portion of long-term assets has actually nearly doubled between 2017 and 2020.
We will come to the equity in affiliated companies topic in a separate discussion later.
Ford’s Total Finance Receivables
Ford total finance receivables
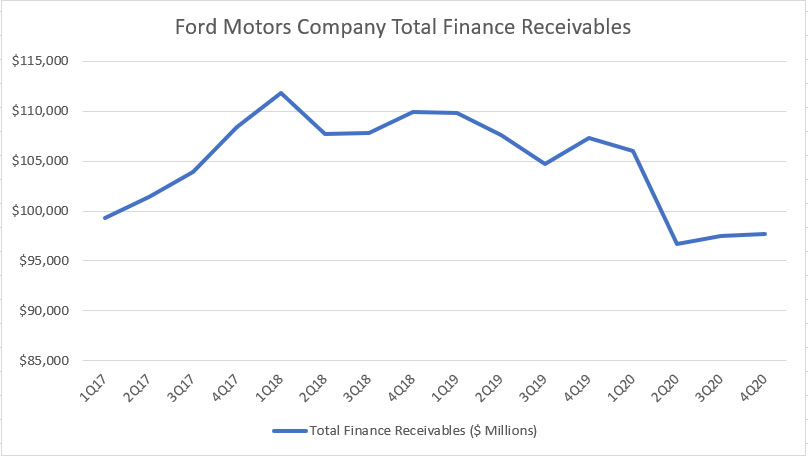
Ford’s total finance receivables are one of the company’s most precious assets as they are financial assets that directly generate income for Ford.
What are finance receivables?
In layman’s terms, Ford’s finance receivables are bank loans given to retail and commercial customers for the purchase of the company products.
In particular, Ford Credit, the captive finance arm of Ford Motors Company, acts as the bank that provides loans to customers who require financing assistance.
These assets basically belong to Ford Credit and are consolidated in Ford Motors Company’s balance sheets.
Of course, Ford Credit will collect the principal amount in addition to the interest charges for the loans given.
In other words, Ford will receive interest income from these finance receivables assets.
The best part is that the finance income is quite stable and predictable and provides a good stream of revenue for Ford.
Therefore, the increasing finance receivables usually indicate a healthy business for Ford.
Unfortunately, we are seeing a significant decline in Ford’s finance receivables in 2020 and the downtrend means a deteriorating vehicle demand as fewer customers have signed up for Ford Credit’s financial assistance.
For example, Ford’s finance receivables totaled $110 billion prior to 2020.
Since 2019, Ford’s finance receivables have slowly deteriorated and reached only $98 billion as of 2020 Q4, possibly driven by the negative impact of the COVID-19 pandemic.
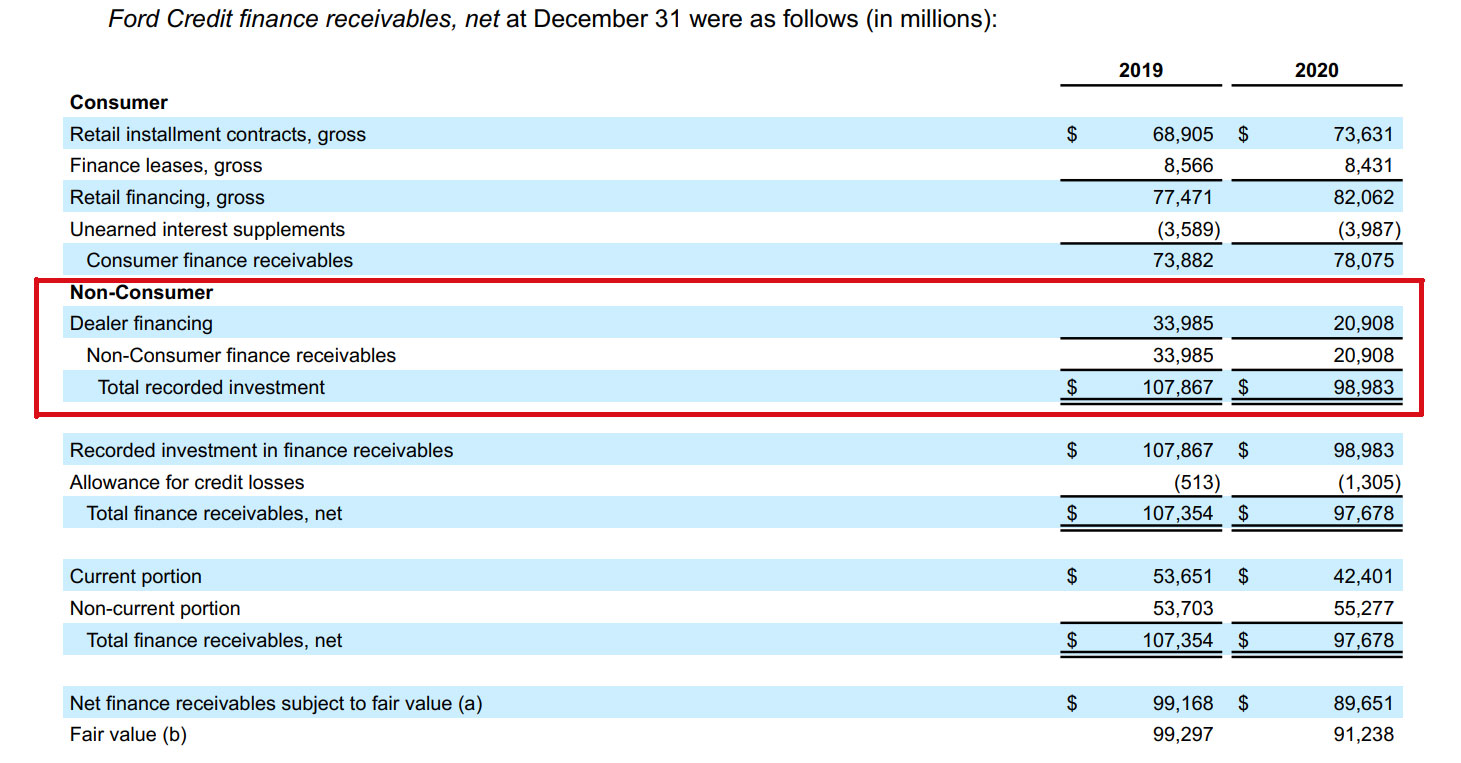
Upon a check into Ford’s financial statements, we have found that the reason behind the decline of the company’s finance receivables is related to the reduction in dealer financing as shown in the following snapshot.
Ford Credit finance receivables
According to the snapshot above, Ford’s finance receivables have lost more than $10 billion in asset value in the 4th quarter of 2020 compared to the same quarter a year ago, due mainly to the reduction in dealer financing as highlighted in the snapshot.
What this means is that dealers have bought fewer vehicles from Ford through the financing provided by Ford Credit in 2020.
The continuous decline in Ford’s finance receivables, especially during a pandemic outbreak, may indicate a deteriorating business environment and investors should keep an eye on this asset type from time to time.
Ford’s Investment In Operating Leases
Ford investment in operating leases
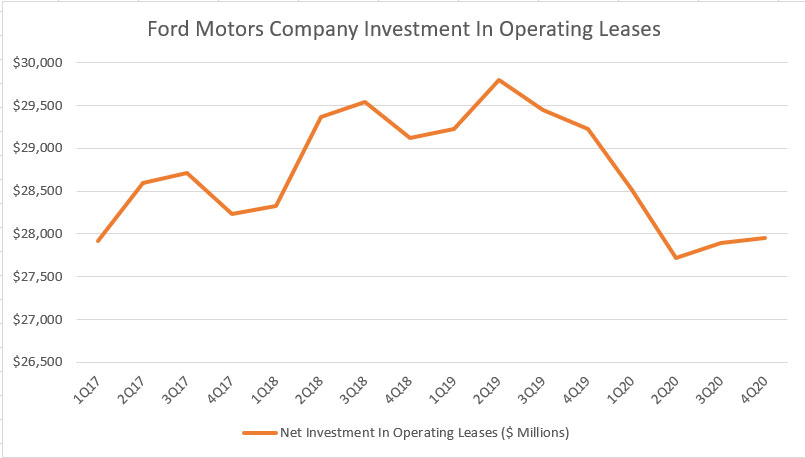
Similarly, the investment in operating lease assets is another type of Ford’s income-producing asset.
This asset type is similar to Ford’s finance receivables in which the company will continuously receive a stable revenue.
The investment in operating leases are basically vehicles leased to retail as well as non-retail consumers under Ford’s automotive and Ford Credit.
Again, the plunge in this asset type in 2020 does not bode well for Ford as well as for investors.
The decline in the investment in operating leases means that there were fewer customers who signed up for Ford’s leasing contracts.
For your information, Ford generated nearly $6 billion of revenue from leasing income in 2020, which was about 5% of Ford’s total sales.
Therefore, a decline in this asset type will certainly impact Ford’s leasing income.
Ford’s Asset Turnover Ratio
Ford asset turnover ratio
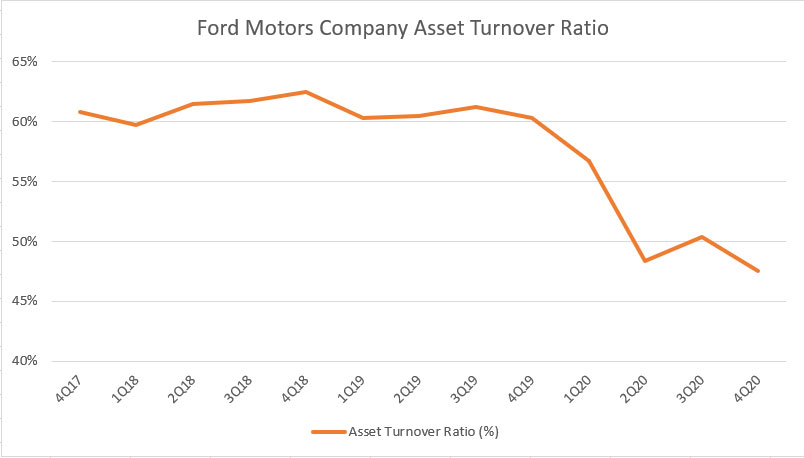
To find out how efficient Ford has been using its assets, we look at Ford’s asset turnover ratio which is shown in the chart above for the period between 2017 and 2020.
The asset turnover ratio is calculated using the formula below:
Asset turnover ratio = ( TTM revenue / Total assets ) X 100%
According to the chart, Ford’s total assets usage efficiency has dropped to about 48% as of 2020 Q4.
Ford used to have an asset turnover ratio of more than 60% back in 2017.
However, that figure has begun to decline in the 2nd half of 2019 and the decline accelerated in 2020.
Over the chart, we can see that Ford’s asset turnover ratio had remained relatively stable between 2017 and 2019, and it only began to drop by the 4th quarter of 2019.
In 2020, Ford’s asset turnover ratio continued to plunge, signaling the negative impact of the COVID-19 outbreak on Ford’s sales.
In short, Ford’s declining asset turnover ratio means that the company has underutilized its assets to generate sales.
If this ratio stayed below 50% or continued to decline further in subsequent quarters, it may signal a very bad business environment for Ford Motors.
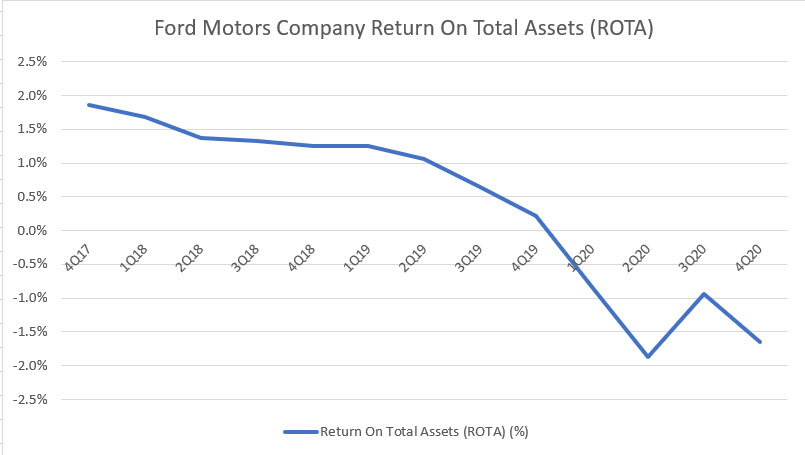
Ford’s Return On Total Assets (ROTA)
Ford return on assets
Ford’s return on assets ratio is another metric that measures Ford’s asset utilization efficiency.
In particular, the return on assets ratio measures Ford’s profitability with respect to the company’s total assets.
That said, Ford’s profitability can be in the form of gross income, operating income or net profit.
In Ford’s case, I used the company’s operating income or EBIT to gauge the company’s operating strength.
Similar to the asset turnover ratio, Ford’s return on asset ratio has also been on a decline between 2017 and 2020 and reached -1.5% as of 4Q 2020.
Unlike the steep decline in Ford’s asset turnover ratio, we are seeing a steady decline in Ford’s return on asset ratio over the past 4 years.
The steady downtrend does not look good as it means that Ford’s core operations have been deteriorating secularly even before the arrival of COVID-19.
In 2020, the COVID-19 pandemic has further weakened Ford’s operating strength and plunged the company’s return on asset ratio into the negative region.
At a ratio of -1.5%, Ford was operating at a loss.
In other words, Ford’s main business operations, including its automotive activities as well as the financing part of Ford Credit, had not made any money throughout 2020.
Conclusion
In short, Ford’s total assets have been on a rise and reached a new high at $265 billion as of Q4 2020.
The increase in Ford’s total assets has been driven largely by the increase in the company’s long-term assets.
However, Ford’s most precious assets – finance receivables and operating leases – have been on a decline and reached new lows in 2020, possibly driven by the negative impact of the COVID-19 outbreak.
Therefore, Ford’s other long-term assets such as property and equity in net assets of affiliated companies should have been the reason that has caused the rise in the company’s total assets.
Ford has invested more than $2 billion on Argo AI in 2020, and hence, the rise in the equity in net assets of affiliated companies.
In terms of asset usage, Ford has underutilized its total assets to generate the expected revenue and profitability.
References and Credits
1. Financial figures in the charts were obtained and referenced from Ford’s quarterly and annual filings which can be found in Ford Financials and Filings.
2. Featured images are used under Creative Common Licenses and are obtained from Miroslav Fikar and matthieu chollet.
Recommended Reads That You Might Find Interesting
Disclosure
Readers, investors, analysts, bloggers, visitors, researchers, writers, or academicians are highly encouraged to use, copy, quote, distribute, duplicate, modify, edit, upload, download, share and link any materials on this webpage such as the charts, snapshots, texts, paragraphs, etc. in your websites, research papers, essays and so on.
You can credit back to this page by a link or a mention of the website. Thanks for sharing!
