A Tesla factory in Fremont, CA. Source: Flickr
This article presents the debt-to-equity ratio and capital structure of Tesla (NASDAQ: TSLA).
The debt-to-equity ratio determines the extent of debt financing relative to equity. It is used to evaluate the leverage of a company and assess its financial risk.
On the other hand, the capital structure assesses how a company finances its operations, whether through debt, equity, or a combination of both.
Let’s look at Tesla’s results!
For other key statistics of Tesla, you may find more resources on these pages:
Sales
Revenue
- Revenue streams and profit margin breakdown,
- Revenue by country: U.S., China, Norway, Netherlands, etc.,
- Revenue per employee and revenue per car
Energy
Profit Margin
- Profit margin breakdown: automotive, energy, and services,
- Profit per employee,
- Tesla vs BYD: profit margin comparison
R&D Budget
- Tesla vs GM,
- Tesla vs Ford,
- Tesla vs Chinese EV,
- Tesla vs BYD
Debt, Cash, and Liquidity
- Financial health: debt level, payment due, and liquidity,
- Cash flow and cash on hand analysis,
- Liquidity check: current ratio, working capital, and quick ratio
Comparison With Peers
- Marketing, advertising, and promotional spending,
- Tesla vs GM: profit margin comparison,
- Tesla vs Ford: vehicle profit and margin
Other Statistics
- Infrastructure expansion: supercharger stations, service fleets, and stores,
- Operating expenses breakdown analysis,
- Inventory breakdown analysis
Please use the table of contents to navigate this page.
Table Of Contents
Definitions And Overview
Debt Figures
A1. Total Debt (Inclusive Of Lease Liabilities)
Debt Ratio
B1. Debt To Equity, Debt To Liabilities, and Debt To Asset Ratios
Capital Structure
C1. Total Liabilities To Assets Ratio
Summary And Reference
S1. Insight
S2. References and Credits
S3. Disclosure
Definitions
To help readers understand the content better, the following terms and glossaries have been provided.
Debt To Equity Ratio: The debt-to-equity (D/E) ratio is a financial metric measuring a company’s financial leverage by comparing its total liabilities to its shareholder equity.
It is calculated using the formula:
\[ \text{Debt-to-Equity Ratio} = \frac{\text{Total Liabilities}}{\text{Total Shareholders’ Equity}} \]
Key Insights:
-
A higher D/E ratio indicates that a company relies more on debt financing, which can increase financial risk.
-
A lower D/E ratio suggests that the company is primarily funded through equity, which may indicate financial stability but could also mean missed opportunities for leveraging debt to fuel growth.
The ideal D/E ratio varies by industry — capital-intensive industries (like manufacturing or utilities) often have higher ratios, while tech firms may have lower ones.
Debt To Total Liabilities: The debt-to-total liabilities ratio measures the proportion of a company’s total liabilities that are financed through debt.
It is calculated using the formula:
\[ \text{Debt-to-Total Liabilities Ratio} = \frac{\text{Total Debt}}{\text{Total Liabilities}} \]
Key Insights:
-
A higher ratio indicates that a larger portion of the company’s liabilities is composed of debt, which may suggest higher financial risk.
-
A lower ratio implies that the company relies less on debt and more on other types of liabilities, such as accounts payable or accrued expenses.
This ratio is useful for assessing a company’s financial structure and its reliance on debt as part of its overall liabilities.
Capital Structure: Capital structure refers to the mix of debt and equity that a company uses to finance its operations and growth. It represents how a firm funds its assets, investments, and overall business activities.
Key Components of Capital Structure:
-
Debt – Includes loans, bonds, and other borrowed funds that the company must repay with interest.
-
Equity – Represents ownership in the company, including common and preferred stock, as well as retained earnings.
-
Hybrid Instruments – Some companies use convertible bonds or mezzanine financing, which blend elements of both debt and equity.
Why Capital Structure Matters:
-
A high debt ratio can increase financial risk but may also provide tax advantages.
-
A strong equity base reduces financial risk but may dilute ownership.
-
Companies aim for an optimal capital structure to minimize their cost of capital while maximizing returns.
Total Debt (Inclusive Of Lease Liabilities)
tesla-debt-with-leases
(click image to expand)
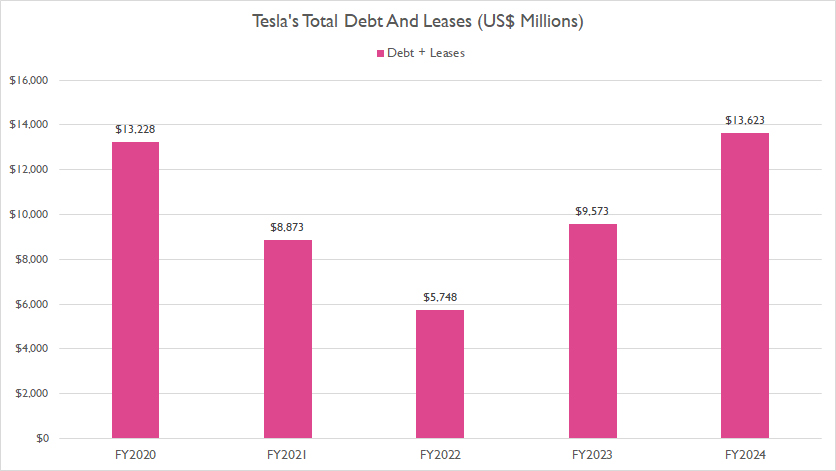
Including lease liabilities, Tesla’s total debt reached $13.6 billion by the end of fiscal year 2024, more than twice the $5.7 billion reported in fiscal year 2022.
On a broader scale, Tesla’s total debt in fiscal year 2024 remained consistent with the level reported four years earlier, in fiscal year 2020
Debt To Equity, Debt To Liabilities, and Debt To Asset Ratio
tesla-debt-ratios
(click image to expand)
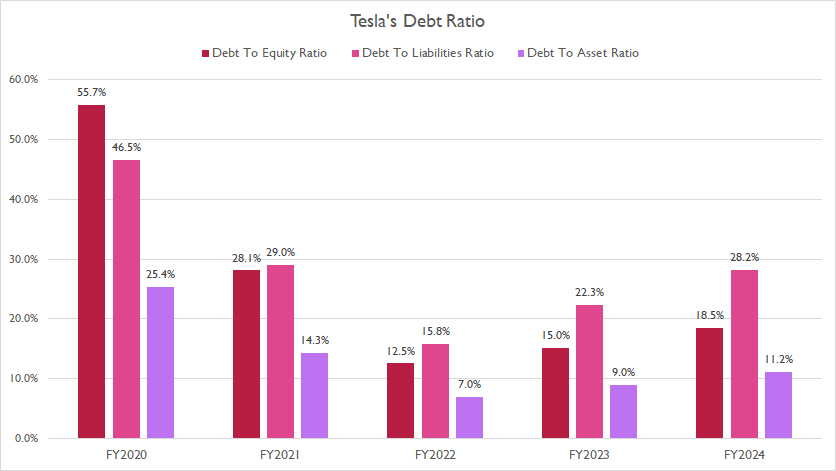
The graph above presents several of Tesla’s debt ratios, such as debt to equity, debt to total liabilities, and debt to asset. You may find more information about the debt ratios here: debt to equity ratio and debt to total liabilities.
As illustrated in the chart above, Tesla has made significant progress in reducing its debt ratios over recent years, with key metrics — including debt-to-equity, debt-to-liabilities, and debt-to-assets—reaching record lows by the end of fiscal year 2024. This trend highlights Tesla’s ongoing focus on strengthening its financial position and improving its capital structure.
For example, Tesla’s debt-to-equity ratio stood at 18.5% in fiscal year 2024, a dramatic improvement from the 55.7% reported four years earlier, in fiscal year 2020.
While this represents a substantial decline, it is worth noting that the ratio ticked up slightly compared to the 15% reported in the previous year, fiscal year 2023, reflecting small adjustments in Tesla’s financial leveraging.
Similarly, Tesla’s debt-to-liabilities ratio, which includes lease liabilities, decreased significantly over the same period. By fiscal year 2024, total debt accounted for just 28% of Tesla’s total liabilities — down from 46.5% in 2020 — demonstrating a marked reduction in the company’s reliance on debt as a proportion of its overall obligations.
From an asset perspective, Tesla’s total debt made up only 11% of its total assets in fiscal year 2024. This figure marks another notable improvement compared to the 25.4% recorded in fiscal year 2020, further underscoring the company’s efforts to solidify its balance sheet and reduce financial risk.
These metrics collectively underscore Tesla’s ability to moderate its debt levels while maintaining its growth trajectory, reflecting sound financial management and a robust approach to capital efficiency.
Total Liabilities To Assets Ratio
tesla-capital-structure
(click image to expand)
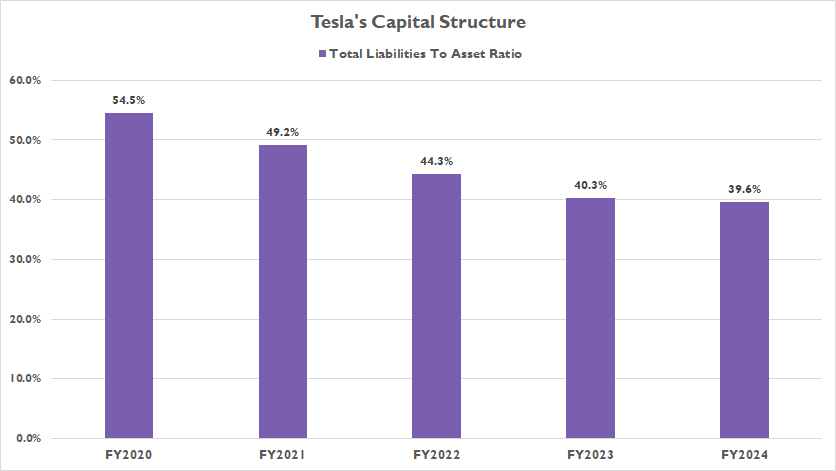
From the total liabilities to asset ratio, we can figure out Tesla’s capital structure. You may find more information about capital structure here: capital structure.
By the end of fiscal year 2024, Tesla’s total liabilities-to-assets ratio had moderated to 40%, reflecting a capital structure composed of 40% liabilities and 60% equity.
This marks a significant improvement, as Tesla historically reported a higher liabilities-to-assets ratio of 55% in fiscal year 2020, where over half of its capital structure was funded by liabilities, leaving only 45% for equity.
Of the 40% liabilities in 2024, approximately 28% was attributed to debt, as discussed earlier, highlighting Tesla’s careful reduction of debt as a component of its liabilities.
The historical ratio of 55% represented a higher-risk capital structure, as the majority of Tesla’s funding relied on liabilities. Such reliance posed potential financial vulnerabilities, especially during periods of economic volatility or downturns.
Over the years, Tesla successfully reduced its liabilities-to-assets ratio, achieving a record low of 40% in 2024. This milestone indicates Tesla’s shift toward a more balanced and robust capital structure, with a greater emphasis on equity financing over liabilities.
Tesla’s strategic shift can be attributed to the company’s rising share price and increasing profitability, which provided opportunities to restructure its capital framework.
By leaning more heavily on equity-based funding rather than debt, Tesla minimized financial risk and reduced borrowing costs. This approach allowed the company to fund its expansion more efficiently and sustainably, leveraging equity funds as a cheaper and less risky alternative.
Tesla’s progress in optimizing its capital structure showcases its commitment to financial prudence while maintaining flexibility for future growth.
Insight
Tesla has achieved significant improvement in its financial stability by optimizing its capital structure and reducing financial risk.
Essentially, Tesla has significantly reduced its debt ratios, including debt-to-equity, debt-to-liabilities, and debt-to-assets, reaching record lows by fiscal year 2024. These efforts demonstrate the company’s commitment to reducing leverage and financial vulnerability.
Tesla transitioned to a more equity-driven capital structure, with liabilities comprising 40% and equity 60% by the end of fiscal year 2024. This reflects a deliberate shift away from a high-risk composition that previously relied heavily on liabilities (55% in fiscal year 2020).
With rising profitability and a surging share price, Tesla utilized equity-based financing instead of debt. This strategic move has not only minimized risk but also provided a cheaper and more sustainable means to fuel its expansion efforts.
Tesla’s actions highlight robust financial management and a focus on long-term stability, positioning the company favorably for future growth opportunities.
These insights collectively underscore Tesla’s success in reducing financial risk while maintaining a growth trajectory through improved financial discipline and strategic capital management.
References and Credits
1. All financial figures presented were obtained and referenced from Tesla’s quarterly and annual reports published on the company’s investor relations page: Tesla Investor Relations.
2. Flickr Images.
Disclosure
We may use artificial intelligence (AI) tools to assist us in writing some of the text in this article. However, the data is directly obtained from original sources and meticulously cross-checked by our editors multiple times to ensure its accuracy and reliability.
If you find the information in this article helpful, please consider sharing it on social media. Additionally, providing a link back to this article from any website can help us create more content like this in the future.
Thank you for your support and engagement! Your involvement helps us continue to provide high-quality, reliable content.


Hello!
Just wondering how did you calculate total debt to equity ratio as I am slightly confused looking at tesla’s financial statements. Thank you!
Just take the total debt and divide it over the total equity.