
Meta’s Facebook. Pixabay Image.
This article provides a detailed breakdown of Meta Platforms, Inc. (META)’s revenue, categorized by region and user geography. Meta Platforms, Inc. reports two distinct types of revenue based on regions in their financial statements.
The first category is based on the addresses of customers. The second category is apportioned according to the geographic location of users when they engage in revenue-generating activities, offering a different perspective on regional revenue distribution.
In addition to presenting revenue figures, this article also displays the percentage of revenue by region in relation to the total revenue.
Let’s take a look! You may find related statistic of Meta Platforms on these pages:
- Meta revenue by product segment,
- R&D comparison among Meta, Twitter, Snap, and Pinterest, and
- Meta operating expenses breakdown analysis.
Please use the table of contents to navigate this page.
Table Of Contents
Definitions And Overview
O2. Overview Of Meta Revenue By Region
O3. How Meta Determines User Location
O4. How Meta Earns Revenue
U.S. And Canada
A1. U.S. & Canada Revenue By Address
A2. U.S. & Canada Revenue By Location
A3. U.S. Revenue By Address
A4. Canada Revenue By Address
Europe
B1. Europe Revenue By Address
B2. Europe Revenue By Location
Asia Pacific
C1. Asia Pacific Revenue By Address
C2. Asia Pacific Revenue By Location
China
Rest Of World
E1. Rest Of World Revenue By Address
E2. Rest Of World Revenue By Location
Conclusion And Reference
S1. Conclusion
S2. References and Credits
S3. Disclosure
Definitions
To help readers understand the content better, the following terms and glossaries have been provided.
Revenue Based On Customer Address: According to Meta’s annual reports, the revenue disaggregated by geography based on customer address is geographically apportioned based on the addresses of the company’s customers.
Revenue Based On User Location: According to Meta’s annual reports, the revenue by user geography comes from the company’s estimate of the geography in which ad impressions are delivered, virtual and digital goods are purchased, or consumer hardware products are shipped.
Overview Of Meta Revenue By Region
Meta revenue breakdown by region
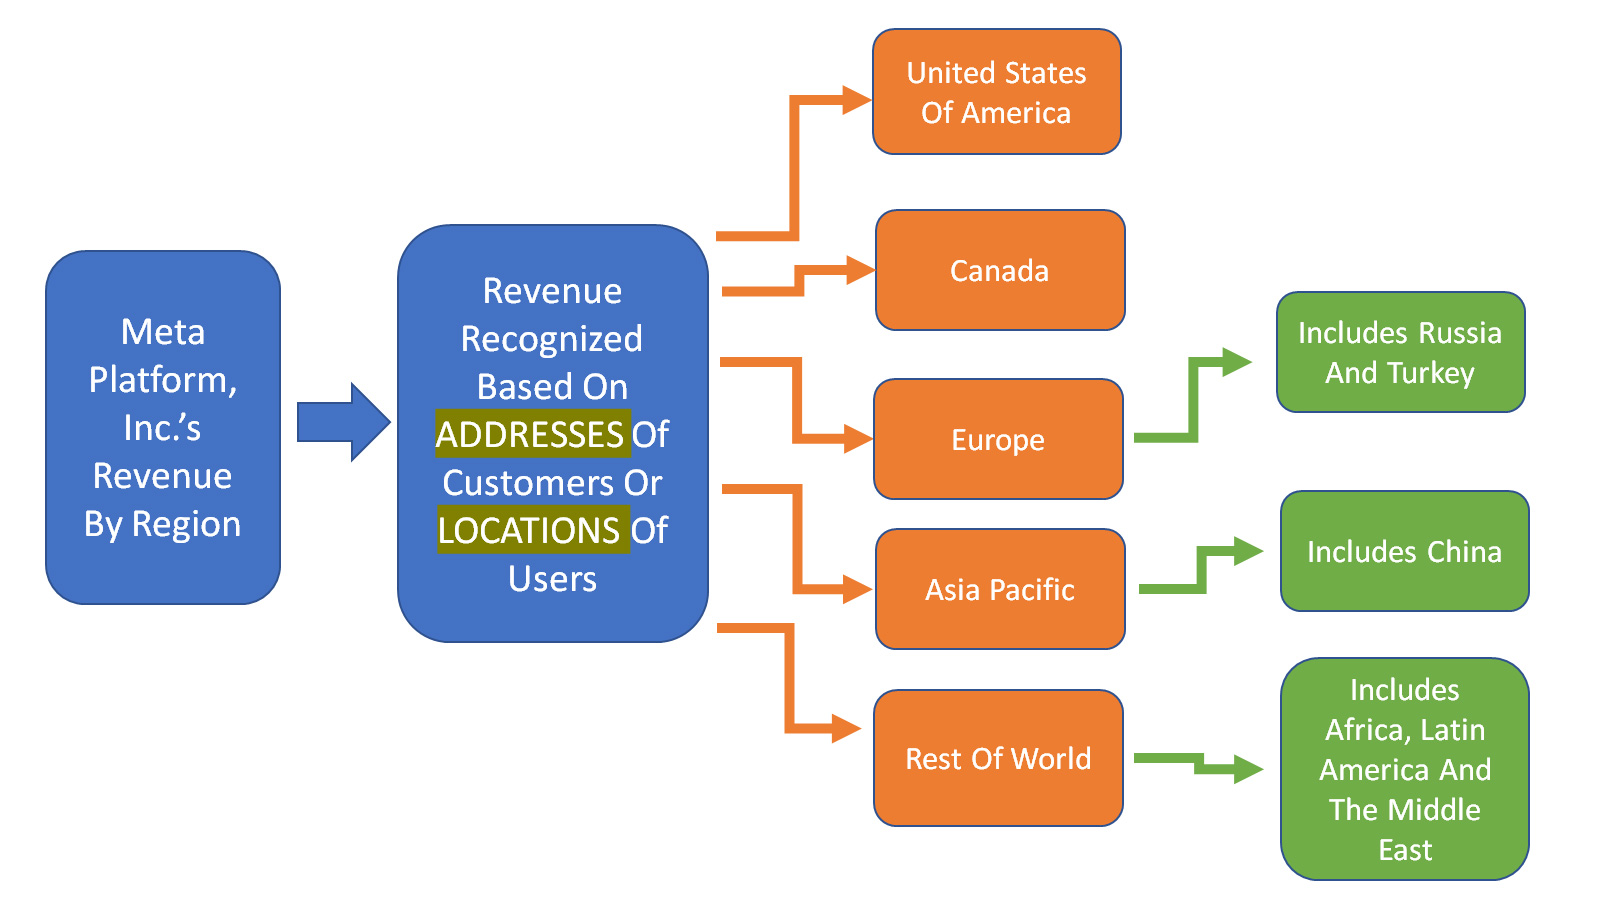
Meta Inc.’s revenue by region or user geography is categorized into two segments: addresses of customers and locations of users, as shown in the diagram above.
The definitions of revenue based on customer address and revenue based on user location are available here: revenue by customer address and revenue by user location.
Meta’s revenue by country includes countries such as the United States Of America, Canada, Europe, the Asia Pacific, China, and Rest Of World.
The European region includes Russia and Turkey. The Rest Of World includes Africa, Latin America, and the Middle East.
The Asia Pacific region includes China.
How Meta Determines Users’ Locations
Meta determines users’ locations through several factors, including the user’s IP address and self-disclosed location. These factors are used to estimate the user’s geographic location, but they may not always accurately reflect the user’s actual location.
Additionally, a user may appear to be accessing Meta from the location of the proxy server that the user connects to rather than from the user’s actual location.
How Meta Earns Revenue
Meta platforms, like Facebook, earn revenue primarily through advertising. Advertisers pay to have their ads shown to users on the platform, and the platform uses data on user behavior and interests to target those ads to specific audiences.
Some platforms may also generate revenue through other means, such as selling virtual goods or offering premium subscriptions.
U.S. & Canada Revenue By Address
Meta’s U.S. & Canada revenue by address
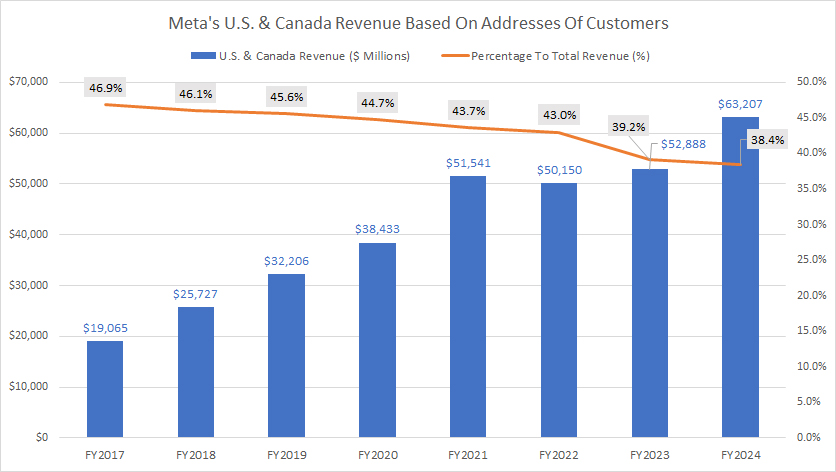
For the U.S. and Canada, revenue based on customer addresses reached $63.2 billion in fiscal year 2024, marking a 19% increase from the $52.9 billion recorded in fiscal year 2023.
Since 2017, Meta’s U.S. and Canada revenue by customer address has experienced substantial growth. However, this growth plateaued between 2021 and 2023, remaining relatively flat during that period.
Despite the overall increase, the revenue share of the North American region has seen a notable decline. In fiscal year 2024, the North American region accounted for 38% of Meta’s total revenue, down significantly from 47% in fiscal year 2017.
This shift reflects the evolving dynamics of Meta’s revenue streams and the increasing contributions from other regions. The sustained growth in the U.S. and Canada highlights the region’s ongoing importance to Meta’s financial performance.
However, the relative decrease in its share of total revenue indicates that Meta is successfully diversifying its revenue sources and expanding its presence in international markets.
U.S. & Canada Revenue By Location
Meta’s U.S. & Canada revenue by location
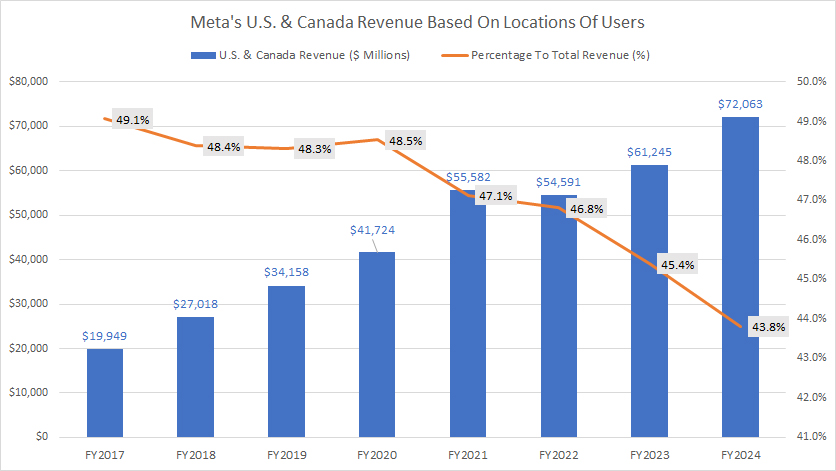
When examining revenue based on user location, Meta’s U.S. and Canada figures are notably higher than those based on customer addresses.
As of fiscal year 2024, Meta’s U.S. and Canada revenue by user location reached $72.1 billion, reflecting an 18% increase from the $61.2 billion recorded in fiscal year 2023. This figure represents a significantly higher revenue share compared to revenue based on customer addresses.
In fiscal year 2024, Meta’s U.S. and Canada revenue of $72.1 billion accounted for 44% of the company’s total revenue. However, this category has also experienced a notable decline since fiscal year 2017, highlighting substantial revenue growth in other countries and regions.
For example, in fiscal year 2017, U.S. and Canada revenue by user location accounted for 49% of Meta’s total revenue. This proportion decreased to 44% by fiscal year 2024, indicating the expanding contributions of other geographic regions to Meta’s overall revenue.
This shift underscores the dynamic nature of Meta’s revenue streams and the company’s ability to grow its international presence.
The increasing revenue from regions outside the U.S. and Canada demonstrates Meta’s successful expansion into diverse markets, further solidifying its position as a global leader in the technology industry.
U.S. Revenue By Address
Meta’s U.S. revenue by address
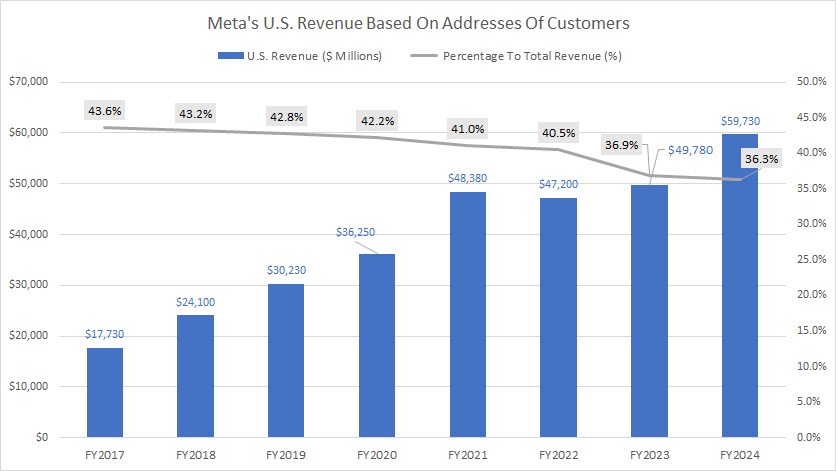
When we focus specifically on the revenue generated from customers within the United States, it is evident that Meta’s U.S. revenue has been a notable increase.
In fiscal year 2024, this U.S. revenue reached a substantial $59.7 billion. This marks a significant rise from the $49.8 billion recorded in the previous fiscal year of 2023.
Despite this impressive growth in absolute terms, the U.S. revenue as a percentage of the total revenue has seen a decline, amounting to 36.3% of the overall revenue in the latest result.
This trend indicates that while the absolute value of Meta’s U.S. revenue has experienced a considerable boost, its share of the total revenue has decreased.
This can be attributed to the even more rapid growth in revenue from other regions. As Meta continues to expand its global presence and diversify its customer base, the proportionate contribution of U.S. revenue to the total revenue is naturally being diluted.
This reflects the company’s ongoing efforts to capture emerging markets and strengthen its foothold in international territories, highlighting its strategic shift towards a more balanced and diversified revenue portfolio.
Canada Revenue By Address
Meta’s Canada revenue by address
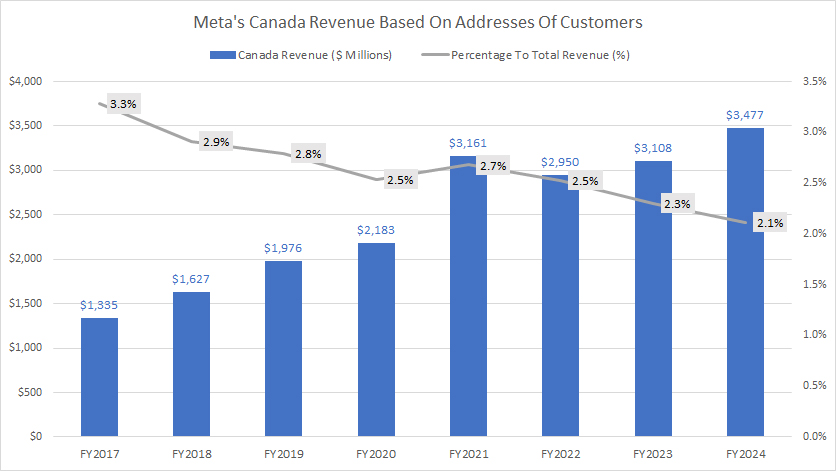
When we analyze the revenue breakdown for North America based on customer addresses, we find that Meta’s revenue from Canada represents only a small portion of the total. Specifically, it accounted for 2.1% or $3.5 billion in fiscal year 2024.
Similar to its U.S. revenue trends, Meta’s revenue share from Canada has experienced a notable decline over the years. In 2017, the revenue share was 3.3%, which has since reduced to 2.1% as of fiscal year 2024.
However, it’s important to note that while the revenue share percentage has decreased, the absolute value of the revenue from Canada has actually increased during this period.
In this regard, it has risen from $1.3 billion in fiscal year 2017 to $3.5 billion as of fiscal year 2024, representing a growth of more than 169% over the past eight years.
The declining percentage share of revenue from Canada underscores the significant growth Meta has achieved in other regions and countries. As Meta continues to expand its global footprint and capture emerging markets, the relative contribution from Canada has naturally diminished.
This trend reflects Meta’s strategic emphasis on diversifying its revenue sources and strengthening its presence in international markets.
Such diversification not only enhances Meta’s resilience against regional economic fluctuations but also showcases its commitment to tapping into new opportunities worldwide.
Europe Revenue By Address
Meta’s Europe revenue by address
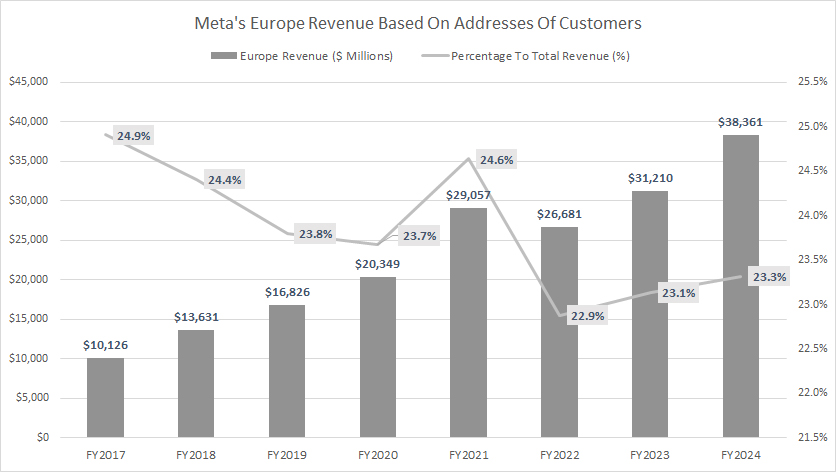
Meta’s revenue from Europe, based on customer addresses, experienced substantial growth, reaching $38.4 billion in fiscal year 2024. This marks an impressive increase from the $31.2 billion reported in fiscal year 2023, representing a year-over-year growth of over 20%.
In terms of its contribution to Meta’s total revenue, the European segment accounted for 23.3% in fiscal year 2024, up slightly from 23.1% in fiscal year 2023.
This indicates that while the revenue from Europe has grown significantly in absolute terms, its share of the overall revenue has only seen a modest increase.
Looking at the longer-term trend, since fiscal year 2017, the absolute revenue figures from Europe have significantly risen. However, the revenue share has seen a decrease from 25% in fiscal year 2017 to 23% as of fiscal year 2024.
This decline in percentage terms, though present, is not as pronounced as the declines observed in the revenue shares from the U.S. and Canada.
The relatively smaller decrease in the European revenue share suggests that Meta has maintained a strong and consistent growth trajectory in this region, even as other markets have expanded rapidly.
This highlights the importance of Europe as a stable and significant revenue source for Meta, balancing the fluctuations and rapid growth seen in other parts of the world.
It also reflects Meta’s strategic efforts to sustain and grow its presence in established markets while simultaneously pursuing new opportunities in emerging regions.
Europe Revenue By Location
Meta’s Europe revenue by location
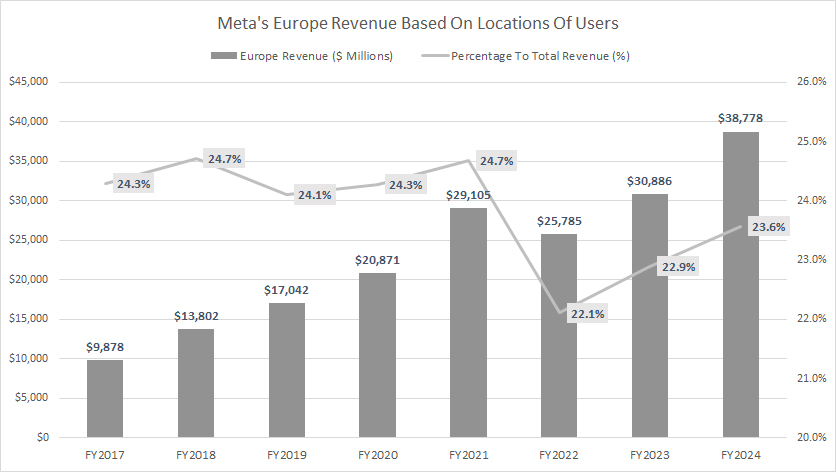
Meta’s Europe revenue by user locations is largely comparable to the revenue by customer addresses, as depicted in the chart above. In fiscal year 2024, Meta generated $38.8 billion in revenue from user locations in Europe, slightly higher than the $38.4 billion recorded based on customer addresses.
From a revenue share perspective, the Europe revenue according to user locations represented 23.6% of Meta’s total revenue, up slightly from 23% in fiscal year 2023.
However, examining the longer-term trend, there has been a slight decline in the revenue share of Meta’s Europe revenue based on user locations, decreasing from 24.3% in fiscal year 2017 to 23.6% over the past eight years.
This slight decrease in revenue share over the long-term could be attributed to various factors such as market saturation in Europe, intensified competition, and potential shifts in user engagement or advertising spend.
Despite this, the stable year-over-year revenue figures suggest that Meta has managed to maintain a strong presence in the European market.
It’s crucial for Meta to continue innovating and adapting its strategies to capture new growth opportunities and sustain its competitive edge in the region.
Exploring emerging markets, enhancing user experience, and leveraging new technologies could be key drivers for future revenue growth.
Asia Pacific Revenue By Address
Meta’s Asia Pacific revenue by address
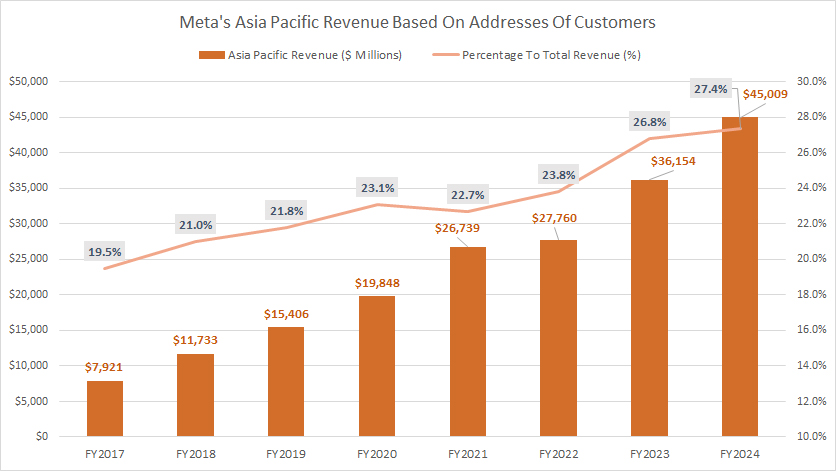
Meta’s Asia Pacific revenue by customer address soared to $45.0 billion in fiscal year 2024, marking a remarkable 24% increase over fiscal year 2023. This growth rate is one of the highest among all regions and countries.
This impressive revenue figure for fiscal year 2024 accounted for approximately 27% of Meta’s total revenue, slightly up from 26.8% in fiscal year 2023.
When compared to revenue based on user locations, Meta’s Asia Pacific revenue by customer address shows a significant variance. In fiscal year 2024, Meta earned $32.8 billion in revenue based on user locations, compared to the $45.0 billion based on customer addresses.
Unlike North America and Europe, Meta’s Asia Pacific revenue has not only increased in absolute value but also in revenue share. This simultaneous rise is crucial as it underscores the region’s expanding importance and growth.
Over the years, Meta’s Asia Pacific revenue share by customer addresses has seen a notable increase, rising from 19.5% in fiscal year 2017 to 27.4% in fiscal year 2024. During the same period, the absolute revenue figures have surged from $7.9 billion in 2017 to $45.0 billion in 2024.
This sustained growth can be attributed to several factors, including increased internet penetration, growing user base, and enhanced monetization strategies.
Moreover, the region’s dynamic market, characterized by rapid technological advancements and a burgeoning middle class, provides Meta with ample opportunities for further expansion.
To continue capitalizing on this momentum, Meta must focus on localized content, innovative advertising solutions, and strategic partnerships.
By doing so, the company can further strengthen its foothold in the Asia Pacific region and drive sustained growth in the coming years.
Asia Pacific Revenue By Location
Meta’s Asia Pacific revenue by location
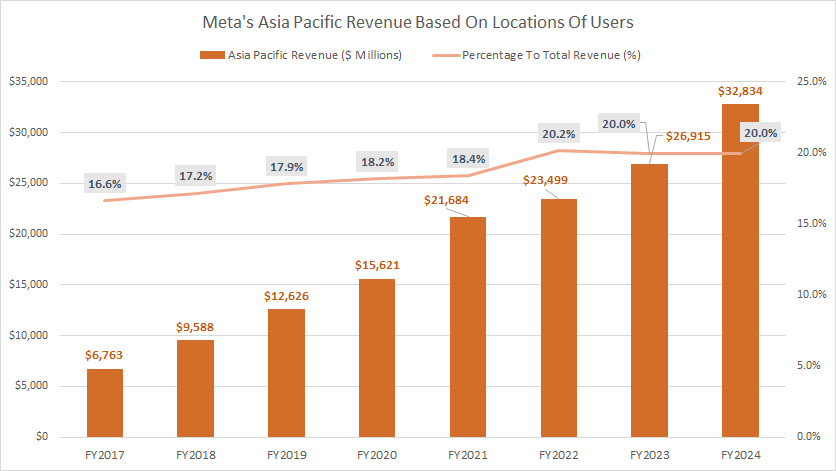
As mentioned, Meta’s Asia Pacific revenue by user location varies significantly compared to revenue by customer address, as depicted in the graph above.
For instance, in fiscal year 2024, Meta’s Asia Pacific revenue by user location amounted to $32.8 billion, whereas the revenue recognized by addresses was significantly higher at $45.0 billion, resulting in a substantial difference of $13 billion.
Although Meta’s Asia Pacific revenue by user location is smaller, the trend has been on the rise since 2017.
Specifically, the Asia Pacific revenue by location has increased from $6.8 billion in fiscal year 2017 to $32.8 billion in fiscal year 2024, representing a nearly 400% growth over the past eight years. During the same period, the revenue share has grown from 16.6% to 20.0%.
This consistent upward trend in both absolute revenue and revenue share suggests that regardless of whether the Asia Pacific revenue is recognized by address or location, the overall growth trajectory remains positive.
Meta’s increasing revenue and revenue share in the Asia Pacific region highlight the region’s growing significance as a primary growth driver for the company.
This growth can be attributed to factors such as increased internet penetration, expanding user base, and effective monetization strategies.
Moreover, the Asia Pacific market presents unique opportunities for Meta, driven by rapid technological advancements, a burgeoning middle class, and a dynamic digital landscape.
To maintain and accelerate this growth, Meta should continue to focus on localized content, innovative advertising solutions, and strategic partnerships.
By leveraging these opportunities and maintaining a strong presence in the region, Meta can further solidify its position and drive sustained growth in the Asia Pacific market in the coming years.
China Revenue By Address
China-revenue-by-address
(click image to expand)
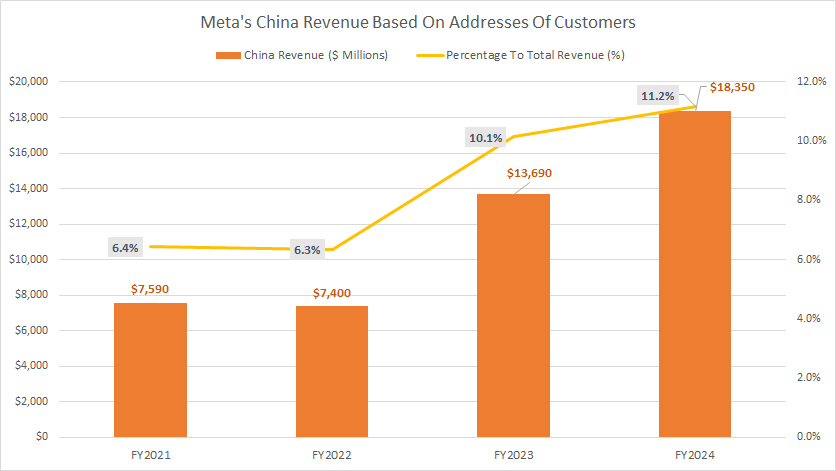
Meta disclosed revenue from China for the first time in 2023, revealing only one type of revenue — based on customer addresses.
In fiscal year 2024, Meta’s revenue from China, based on customer addresses, reached $18.4 billion, representing a significant 34% increase from $13.7 billion in fiscal year 2023.
Over the past four years, Meta’s revenue from China by customer addresses has experienced rapid growth, rising from $7.6 billion in fiscal year 2021 to $18.4 billion in fiscal year 2024, marking an impressive 142% growth rate.
From a revenue share perspective, Meta’s China revenue accounted for 11.2% of the total revenue in fiscal year 2024, up slightly from 10.1% in fiscal year 2023.
The revenue share from China has shown a similar upward trend, increasing from 6.4% in fiscal year 2021 to 11.2% in fiscal year 2024.
This substantial growth in both absolute revenue and revenue share underscores the increasing importance of the Chinese market for Meta. Factors such as a burgeoning digital economy, expanding user base, and effective localization strategies have likely contributed to this growth.
To sustain and accelerate this momentum, Meta should continue to focus on tailored content, innovative advertising solutions, and strategic partnerships in China.
The company’s ability to navigate regulatory challenges and adapt to the unique market dynamics will be crucial for further expansion.
In conclusion, Meta’s rising revenue and revenue share from China highlight the region’s growing significance as a major growth driver for the company.
With continued strategic efforts, Meta can further solidify its presence in the Chinese market and drive sustained growth in the coming years.
Rest Of World Revenue By Address
Meta’s Rest Of World revenue by address
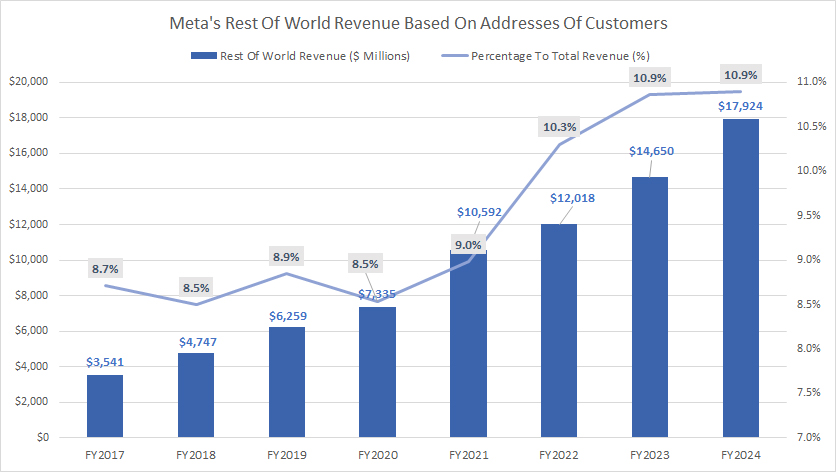
The Rest of World region, encompassing countries in Africa, Latin America, and the Middle East, has shown remarkable revenue growth for Meta Platforms.
In the fiscal year 2024, Meta reported $17.9 billion in revenue from this region, based on customer addresses. This represents a more than 20% increase from the $14.7 billion recorded in fiscal year 2023.
Despite being the smallest revenue contributor for Meta, accounting for only 10.9% of total revenue in both fiscal years 2023 and 2024, the Rest of World region’s revenue has seen significant absolute growth.
Over the past eight years, since fiscal year 2017, revenue in this region has surged from $3.5 billion to $17.9 billion, demonstrating a much faster growth rate compared to other regions.
Additionally, the revenue share from the Rest of World region, based on customer addresses, has risen from 8.7% to 10.9% over the same period. This growth underscores the increasing importance and potential of emerging markets for Meta Platforms’ overall revenue stream.
Rest Of World Revenue By Location
Meta’s Rest Of World revenue by location
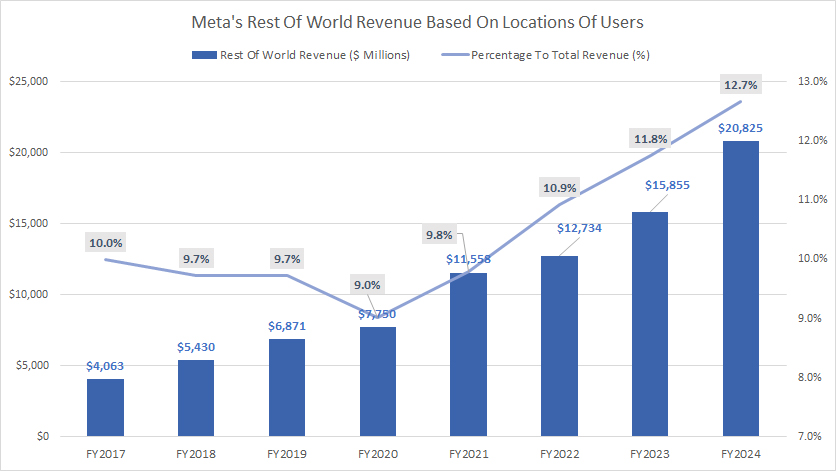
Meta’s Rest of World revenue, when considered based on user location, surpasses the figures calculated using customer addresses.
In the fiscal year 2024, Meta’s Rest of World revenue, calculated based on user location, reached an impressive $20.8 billion. This marks an astounding 30% increase, or nearly $5 billion more compared to fiscal year 2023. This revenue from user locations constituted 12.7% of Meta’s total revenue, the highest proportion since 2017.
The significant growth in both absolute value and percentage share underscores the increasing importance of the Rest of World region for Meta Platforms, Inc.
Since fiscal year 2017, the revenue from this region has demonstrated a robust upward trend, contributing notably to Meta’s overall growth. The rising revenue share from the Rest of World region highlights its potential as a future growth driver for the company.
This trend reflects the strategic focus Meta has placed on expanding its presence and user engagement in emerging markets, where digital adoption continues to accelerate.
Conclusion
In conclusion, Meta’s largest revenue stream originates from North America, with Europe contributing the second highest revenue. The U.S. alone accounted for 36% of Meta’s total revenue in fiscal year 2024, while China’s contribution was 11% during the same period, based on revenue by customer address.
Europe and the Asia Pacific regions each contributed significantly to Meta Platforms’ revenue, with figures at 23% and 27%, respectively, in fiscal year 2024. Meta’s revenue from the Rest of World region was among the smallest, at just over 11% in the same period.
While Meta’s North American and European revenue has increased in absolute terms, their revenue share has declined. This indicates a slower growth rate compared to other regions and countries. In contrast, Meta’s revenue and revenue share in the Asia Pacific and Rest of World regions have soared over time. This demonstrates the increasing importance of these regions in driving future revenue growth for the company.
The substantial growth in the Asia Pacific and Rest of World regions highlights Meta’s successful strategy in expanding its market presence and user engagement in these emerging markets. The rapid digital adoption in these regions has created new opportunities for Meta to capture a larger share of the global digital landscape.
Overall, while North America and Europe remain crucial revenue sources for Meta, the Asia Pacific and Rest of World regions are emerging as key drivers of future growth. This trend underscores the importance of focusing on these dynamic and rapidly evolving markets to sustain Meta’s long-term growth and success.
References and Credits
1. All Meta Platform, Inc., financial figures are obtained and referenfced from the company’s annual reports published on the company’s investor relations page: Meta Investor Relations.
2. Pixabay Images.
Disclosure
We may utilize the assistance of artificial intelligence (AI) tools to produce some of the text in this article. However, the data is directly obtained from original sources and meticulously cross-checked by our editors multiple times to ensure its accuracy and reliability.
If you find the information in this article helpful, please consider sharing it on social media. Additionally, providing a link back to this article from any website can help us create more content like this in the future.
Thank you for your support and engagement! Your involvement helps us continue to provide high-quality, reliable content.

This article is thought-provoking. Understanding how Meta makes a profit worldwide but does not have registered offices in each region to comply with domestic fiscal laws is fascinating. In other words, the rest of the world offers Meta opportunities to make more money. Still, Meta does not pay back to local communities via taxation to fund schooling and address some social determinants of health. Policymakers from the Third World should investigate this gap. Lastly, I recommend mentioning Africa and Latin America as geographic regions instead of countries. Indeed, Africa has 54 countries, and Latin America has 33.