Having a good time at Dave and Buster’s. Image source: Flickr Image.
Dave and Buster’s is probably a familiar place to most Americans, owing to its popularity as an entertainment and dining venue that spans across 40 states in the United States.
Dave and Buster’s operates entirely in the North American region, with stores located in not only the United States but also Puerto Rico as well as Canada.
As of fiscal 4Q 2020 ended on Jan 31, 2021, Dave and Buster’s owns 140 stores, with many of them providing a distinctive value proposition that advocates the concept “Eat Drink Play and Watch – All Under One Roof”.
Dave and Buster’s is currently traded on the NASDAQ with a ticker PLAY.
While Dave and Buster’s has grown tremendously in the past few years, the company’s growth trajectory has come to a complete stop in fiscal 2020, due mainly to the COVID-19 pandemic that has forced many of the company’s stores to temporarily shut down.
As a result, Dave and Buster’s has indefinitely suspended its share buyback and cash dividend payments since fiscal 1Q 2020.
In this article, we will look at Dave and Buster’s several cash metrics, including its cash on hand, free cash flow, cash flow from operations and cash flow from financing activities, to find out what has been going on with the company’s cash flow and why it totally stopped returning cash to shareholders.
Without further ado, let’s get moving!
Dave and Buster’s Cash Flow Topics
1. Cash On Hand
2. Ratio of Cash To Current Assets
3. Net Cash From Operations
4. Capital Expenditures
5. Free Cash Flow
6. Net Cash From Financing Activities (Including Dividends and Buybacks)
7. Net Cash From Financing Activities (Excluding Dividends and Buybacks)
8. Summary
Dave and Buster’s Cash On Hand
Dave and Buster’s cash on hand
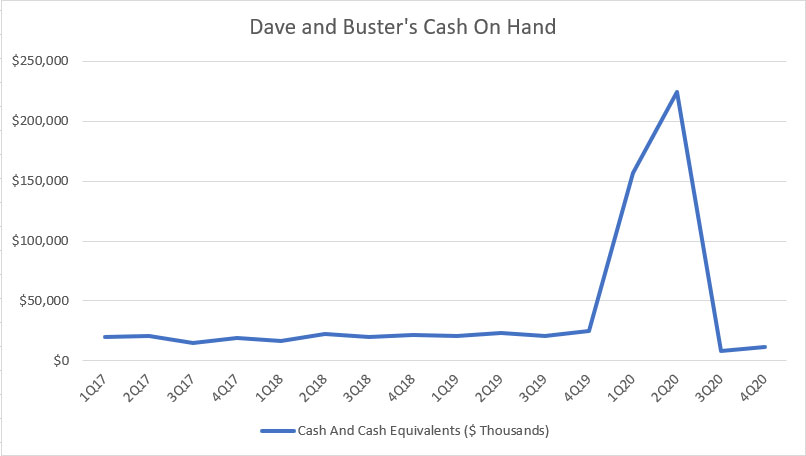
Let’s first look at Dave and Buster’s cash on hand which is shown in the chart above for the period from fiscal 2017 to fiscal 2020.
Keep in mind that Dave and Buster’s cash on hand comes entirely from the company’s cash and cash equivalents.
As a result, these assets are highly liquid and can be instantly deployed whenever they are needed.
All told, Dave and Buster’s cash on hand averaged about $20 million prior to fiscal 2020 but the figures started to rise in fiscal 1Q 2020 and jumped significantly to more than $200 million in fiscal 2Q 2020.
The dramatic rise in Dave and Buster’s cash position in FY2020 was a direct result of the COVID-19 outbreak which has temporarily shut down almost all of the company’s stores, thereby cutting off its main sources of cash flow.
Dave and Buster’s significantly increased its cash reserves during the trying period through debt takings and equity offerings in the 1st half of fiscal 2020.
In the 2nd half of fiscal 2020, Dave and Buster’s cash on hand returned to its pre-COVID level and totaled $12 million as of 4Q 2020.
While the $12 million in cash and cash equivalents may seem little, Dave and Buster’s actually can draw up to $280 million of cash under its revolving credit facilities.
All in all, Dave and Buster’s has sufficient liquidity to satisfy its obligations over the next 12 months as of fiscal 2020 Q4.
Dave and Buster’s Ratio of Cash To Current Assets
Dave and Buster’s ratio of cash on hand to current assets
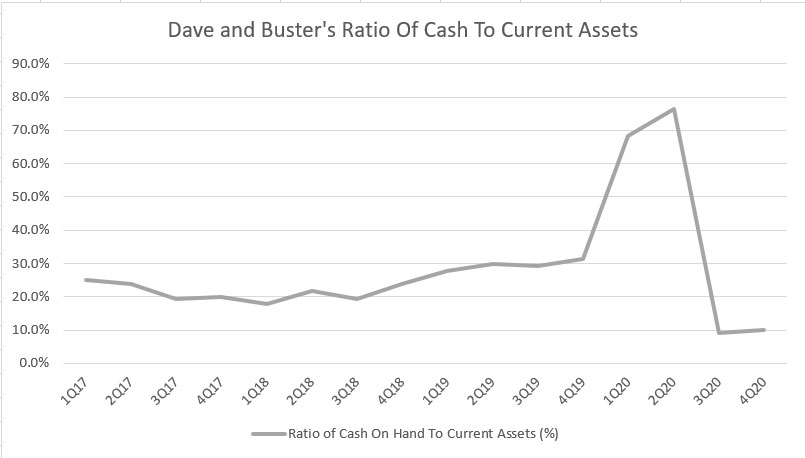
To see how Dave and Buster’s cash on hand changes with respect to current assets, the chart above shows the percentage or ratio of the company’s total cash position with respect to total current assets.
As shown, Dave and Buster’s ratio of cash to current assets averaged about 20% before fiscal 2019.
The ratio started to rise up to 30% in the 2nd half of fiscal 2019 and dramatically jumped to nearly 80% in 2Q 2020.
At 80% level, Dave and Buster’s current assets were nearly made up of cash and cash equivalents.
As of 2020 Q4, Dave and Buster’s ratio of cash to current assets has declined to only 10%, indicating that the worst may have been over for the company.
Dave and Buster’s Net Cash From Operations
Dave and Buster’s net cash from operations
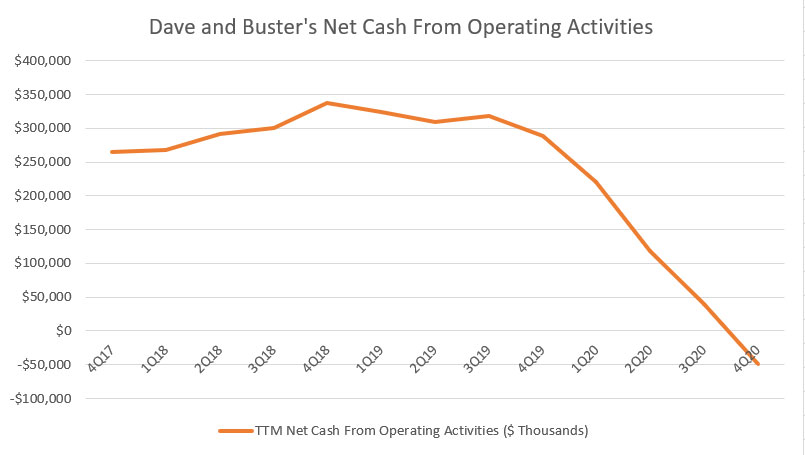
To see why Dave and Buster’s had significantly shored up its liquidity in FY2020, we can look at the company’s main sources of cash flow, which is reflected in the net cash from operations as shown in the chart above.
As shown, Dave and Buster’s net cash from operations had started to dive in fiscal 1Q 2020.
Keep in mind that the net cash from operation reflects Dave and Buster’s cash flow derived from the company’s core business operations, including its food and entertainment services.
That said, Dave and Buster’s net cash from operations continued to slide post 1Q 2020 and even reached -$50 million as of 2020 Q4.
At a negative figure, Dave and Buster’s actually had consumed more cash than the business had generated.
According to the chart, you can see the rate at which the net cash from operations had decreased in FY2020.
Prior to FY2019, Dave and Buster’s businesses were rolling in cash that totaled more than $300 million.
And, all of that had changed in FY2020.
Dave and Buster’s was actually burning cash as of fiscal 2020 Q4 from a TTM perspective.
Now, you can see why Dave and Buster’s had scrambled to add up its liquidity during FY2020.
Dave and Buster’s Capital Expenditures
Dave and Buster’s capital expenditures
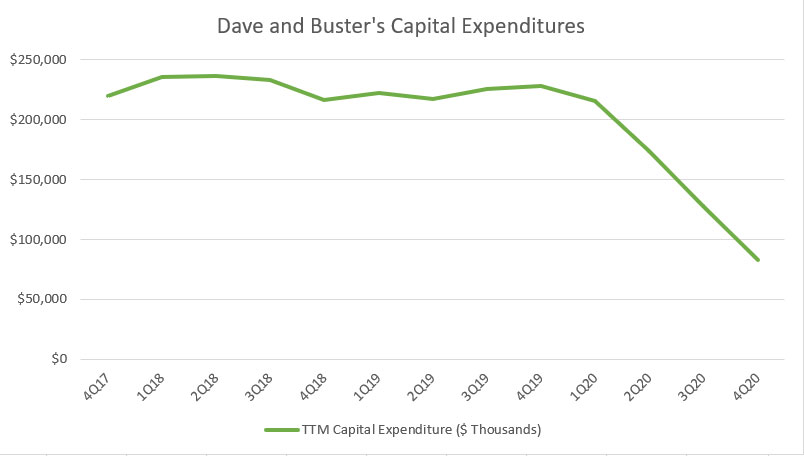
The capital expenditures chart above reflects the cash spent on hard assets such as new stores opening, renovation, operating initiatives, games and maintenance capital.
Prior to 2020, you can see that Dave and Buster’s spent quite a considerable amount on capital expenditures, averaging around $230 million on a TTM basis.
Again, all of that had changed when it comes to FY2020.
To save cash, Dave and Buster’s has significantly reduced its capital expenditures starting in 2020 1Q.
Dave and Buster’s capital expenditures continued to dive as we moved closer to 2020 4Q.
As of Q4 2020, Dave and Buster’s capital expenditures totaled slightly more than $80 million, about 65% lower than its prior highs.
Keep in mind that Dave and Buster’s still spent quite a considerable amount of cash on capital expenditures even during the height of the outbreak when its net cash from operations had significantly declined.
In this period, Dave and Buster’s had to spend money on property upkeep, maintenance, etc even though most of them had yet to open.
Dave and Buster’s Free Cash Flow
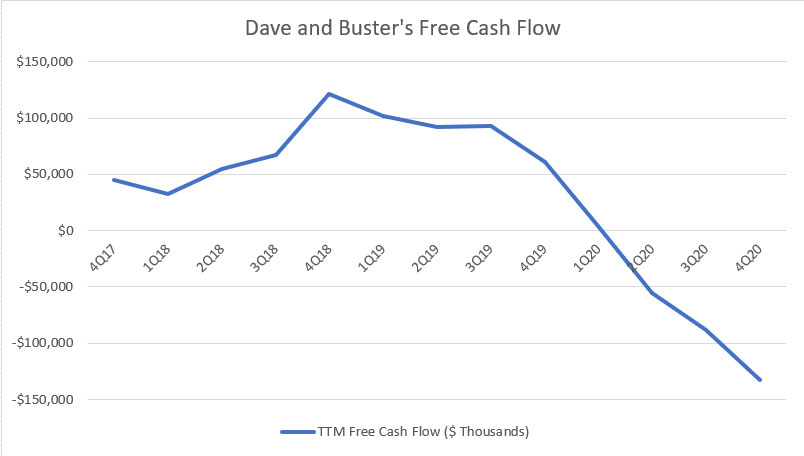
Dave and Buster’s free cash flow
Free cash flow is the difference between net cash from operations and capital expenditures.
It is the leftover cash from operations minus the cash spent on capital expenditures.
Dave and Buster’s can do freely with the leftover cash, including returning the cash to shareholders in the form of cash dividends and share repurchase.
All told, Dave and Buster’s free cash flow reached more than $100 million prior to FY2020, illustrating the huge amount of cash the company was making prior to the pandemic.
However, Dave and Buster’s free cash flow started to decline at the onset of the pandemic.
The company’s free cash flow continued to dive and the amount was in the negative at more than -$50 million in fiscal Q2 2020.
As of 2020 4Q, Dave and Buster’s free cash flow reached -$140 million, a huge amount that the company had burned.
Therefore, Dave and Buster’s was consuming free cash flow instead of generating it throughout FY2020.
Dave and Buster’s negative free cash flow in FY2020 was largely attributed to the smaller net cash from operations and yet, the company was still needed to pay for property upkeep and maintenance.
For example, in fiscal 2020 Q4, Dave and Buster’s net cash from operations was at -$50 million, and yet, its capital expenditures were still hovering at $80 million in the same quarter.
Now, you can see why Dave and Buster’s free cash flow could reach -$140 million in fiscal 4Q 2020.
Dave and Buster’s Net Cash From Financing Activities (With Dividends and Stock Buybacks)
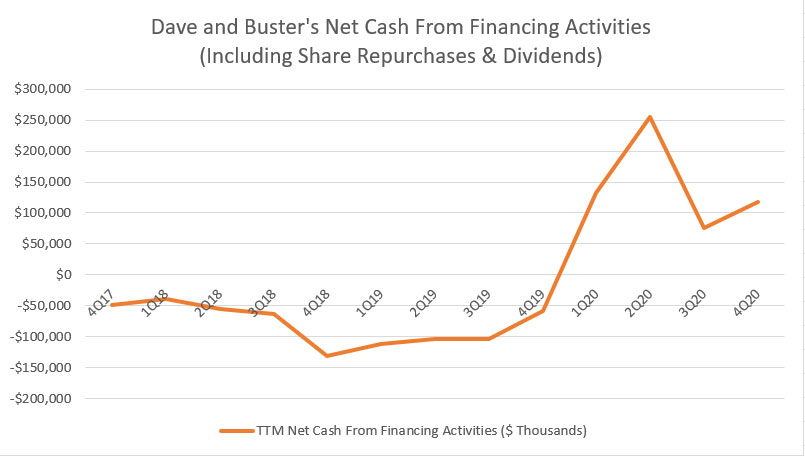
Dave and Buster’s net cash from financing activities (with dividends and buybacks)
The net cash from financing activities is the cash spent on dividend payments and stock buybacks.
Additionally, the net cash from financing activities also records the cash flow arising from capital raises and repayments such as debt and equity issuance and payments.
That said, Dave and Buster’s net cash from financing activities had been in the red prior to fiscal 2020, suggesting that the company was having a cash outflow.
In some of the fiscal periods, Dave and Buster’s net cash from financing activities was seen totaling as much as -$100 million from a TTM perspective.
In this aspect, Dave and Buster’s could be returning cash to shareholders in the form of dividends or share buyback and the company could also be paying back debts.
Whatever it was, it boded well for the company as Dave and Buster’s was returning cash to shareholders and/or paying back debts.
However, Dave and Buster’s was seen racking up cash in fiscal 2020 as seen from the positive net cash from financing activities that had jumped to $250 million.
The positive figures indicate that Dave and Buster’s was most likely raising capital either through debt or equity issuance.
At the same time, Dave and Buster’s could also be paying dividends and repurchasing stocks.
But that was highly unlikely considering that the company was already burning free cash flow instead of producing it.
As of 4Q 2020, Dave and Buster’s net cash from financing activities totaled slightly over $100 million.
Dave and Buster’s Net Cash From Financing Activities (Without Dividends and Stock Buybacks)
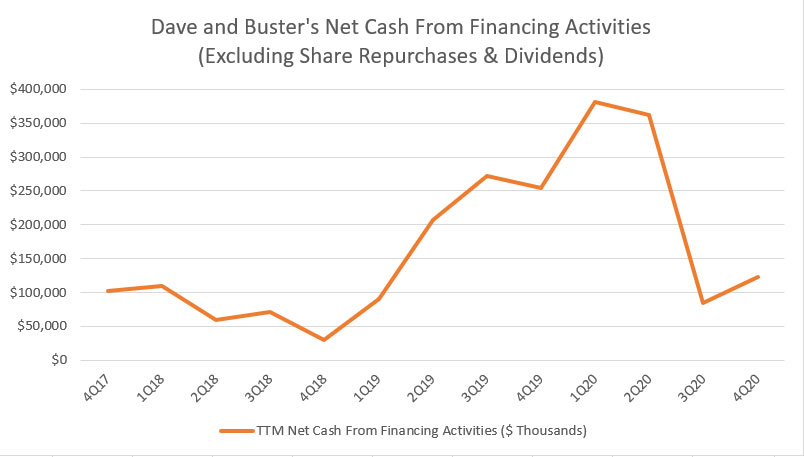
Dave and Buster’s net cash from financing activities (without dividends and buybacks)
By excluding cash flow arising from dividend payments and share repurchases, we can get a much clearer picture of Dave and Buster’s net cash from financing activities.
As shown in the chart above, Dave and Buster’s net cash from financing activities was entirely positive after excluding cash flow from dividends and share repurchases.
The positive net cash from financing activities indicates that Dave and Buster’s had been raising capital even during FY2017 when the business was free cash flow positive.
Despite making more than $100 million in free cash flow, Dave and Buster’s was still borrowing and/or issuing equity to raise cash prior to fiscal 2020.
When the pandemic hit in fiscal 2020, Dave and Buster’s net cash from financing activities rose exponentially as seen from the chart, indicating that the company borrowed even more money and raise even more equity for cash.
The figure hit its peak at nearly $400 million in 1Q 2020 and returned to about $100 million as of 2020 Q4.
The takeaway here is that Dave and Buster’s has been steadily racking up debt and diluting its shares even during good times when the business was making a boatload of cash.
Summary
Dave and Buster’s cash on hand was the highest in the 1st half of fiscal 2020 at more than $200 million, driven largely by the pandemic disruption.
Dave and Buster’s net cash from operating activities has been on a decline since fiscal 1Q 2020 and reached -$50 million as of fiscal 4Q 2020.
Despite having negative net cash during the period of mandatory shutdown, Dave and Buster’s still spent considerably on capital expenditures for property upkeep and maintenance.
A similar downtrend was observed for Dave and Buster’s free cash flow and the figures reached -$140 million as of 2020 Q4 due mainly to the near $100 million capital expenditures despite having negative net cash from operations.
Dave and Buster’s has been racking up debt and issuing stocks to raise capital during both the good and bad times as seen from the positive net cash from financing activities (after excluding the effect of dividends and stock repurchase).
But it raised even more cash during the bad time, such as during fiscal 2020.
References and Credits
1. All financial figures in this article were obtained and referenced from Dave and Buster’s financial reports available in D&B’s Investor Relations.
2. Featured images in this article are used under creative commons license and sourced from the following websites: Roy Niswanger and Mike Mozart.
Top Picks That You May Find Related
Disclosure
Readers, investors, analysts, bloggers, visitors, researchers, writers, or academicians are highly encouraged to use, copy, quote, distribute, duplicate, modify, edit, upload, download, share and link any materials on this webpage such as the charts, snapshots, texts, paragraphs, etc. in your websites, research papers, essays and so on.
You can credit back to this page by a link or a mention of the website. Thanks for sharing!
