
City in China. Pixabay Image.
General Motors (GM) is one of the largest automobile manufacturers in the world, with a rich history of over 100 years. In recent years, GM has been expanding its operations globally, and China has become one of its key markets.
GM entered the Chinese market in 1997 through a joint venture with Shanghai Automotive Industry Corporation (SAIC), one of China’s largest automobile manufacturers. Since then, GM has invested heavily in China, establishing multiple joint ventures and manufacturing plants across the country.
Today, GM is one of the leading automobile manufacturers in China, with a robust portfolio of brands and models that cater to the diverse needs of Chinese consumers.
This article looks closely at several key statistics of GM’s China joint ventures, including car sales numbers, market share, revenue, profitability, and margins.
Let’s have a look!
For other key statistics of General Motors, you may find more resources on these pages:
- GM market share by country: U.S., China, Brazil, U.K., etc.,
- GM vehicle sales by country: U.S., China, Brazil, U.K., etc., and
- General Motors cash flow analysis
Please use the table of contents to navigate this page.
Table Of Contents
Definitions And Overview
O2. GM’s Car Brands In China
O3. Popular GM’s Car Models In China
O4. GM’s Business Strategy In China
O5. GM’s Ownership Of Companies In China Joint Ventures
GM’s Sales And Market Share In China
A1. Car Sales
A2. Market Share
GM’s Revenue, Profit And Investment Value In China JVs
B1. Revenue
B2. Profit
B3. Investment Carrying Value
B4. Profit Yield
Automotive China JVs’ Results
C1. Vehicle Wholesale
C2. Revenue
C3. Profit
C4. Profit Margin
C5. Cash & Cash Equivalents
C6. Debt
Conclusion And Reference
S1. Insight
S2. References and Credits
S3. Disclosure
Definitions
To help readers understand the content better, the following terms and glossaries have been provided.
Nonconsolidated Affiliates: Nonconsolidated affiliates refer to companies where an investor has a significant interest but not a controlling interest. In other words, the investor has less than 50% of the company’s voting shares.
In general, nonconsolidated affiliates are accounted for using the equity method. Under the equity method, the investor records its share of the affiliate’s net income or loss in its financial statements. Nonconsolidated affiliates are also sometimes referred to as associates or equity-accounted investments.
In addition, revenue and expenses produced by nonconsolidated affiliates are not consolidated into the investors’ financial statements; instead, the proportionate share of the earnings of each nonconsolidated affiliate is reflected as Equity income.
Equity Income: Equity income from non-consolidated affiliates refers to the earnings that a company receives from its investments in other companies that are not wholly owned or controlled by it.
These affiliates are typically accounted for using the equity method, where the investor records its share of the affiliate’s net income as a component of its income statement.
Equity income from non-consolidated affiliates is typically reported as a separate line item on a company’s income statement. It can be an important source of recurring income for the investor.
General Motors SAIC: GM SAIC is a joint venture between General Motors Company (GM) and Shanghai Automotive Industry Corporation (SAIC). This partnership was established in 1997 and has become one of China’s largest automobile joint ventures.
The partnership involves producing and selling GM-branded vehicles in China and developing new technologies and products for the Chinese market. The GM SAIC joint venture has been instrumental in helping GM expand its presence in China, which is now one of the largest automotive markets in the world.
Vehicle Sales: GM’s vehicle sales data represents:
(1) retail sales (i.e., sales to consumers who purchase new vehicles from dealers or distributors);
(2) fleet sales (i.e., sales to large and small businesses, governments, and daily rental car companies); and,
(3) vehicles used by dealers in their businesses.
Moreover, vehicle sales data includes all sales by joint ventures on a total vehicle basis, not based on GM’s percentage ownership interest in the joint venture.
Also, GM’s vehicle sales data does not correlate directly to the revenue it recognizes during a particular period. Only the wholesale vehicle sales data link directly to the revenue GM presented in its income statements.
Investors interested in GM’s worldwide car sales may visit this page here: GM global vehicle sales.
Market Share: GM’s market share is calculated as below:
Market Share = GM’s Retail Volume / Industry Volume
Investors interested in GM’s worldwide market share may visit this page here: GM global market share.
Carrying Value: The carrying value or carrying amount is the value at which an asset or liability is recognized in an organization’s balance sheet. It is calculated as the asset’s original cost, less accumulated depreciation, amortization, or impairment charges.
Similarly, the carrying amount of a liability is the amount the organization owes to its creditors, less any payments made towards the debt principal. The carrying amount is an important financial metric that helps investors and stakeholders understand the actual value of an organization’s assets and liabilities.
GM’s Car Brands In China
GM’s China car brands include Buick, Cadillac, Chevrolet, Baojun, and Wuling. Buick has been one of the most successful brands in China, with a long history of popularity among Chinese consumers.
Cadillac is a luxury brand that has been gaining traction in the Chinese market in recent years. Chevrolet offers various models, from sedans to SUVs, that are popular among Chinese consumers.
Baojun is a local brand established in 2010 as a joint venture between GM, SAIC, and Wuling Motors. It offers affordable passenger cars and SUVs designed and manufactured in China.
Wuling is a commercial vehicle brand that specializes in light trucks and vans. It is also a joint venture between GM, SAIC, and Liuzhou Wuling Motors Co., Ltd.
Popular GM’s Car Models In China
GM’s car models in China are quite popular and have seen significant sales. For instance, the Buick Envision, a mid-size SUV, has been one of GM’s top-selling models in China. In 2020, the sales of Buick Envision in China amounted to over 175,000 units.
Another popular model is the Cadillac XT4, a compact luxury SUV. In 2020, the sales of Cadillac XT4 in China reached around 33,000 units.
The Chevrolet Equinox, a compact SUV, has also been well-received in China, with sales of nearly 60,000 units in 2020.
Moreover, the Baojun 510, a subcompact SUV, has been one of GM’s best-selling models in China. In 2020, the sales of Baojun 510 in China amounted to over 200,000 units.
Overall, GM’s car models have seen significant sales numbers in China, indicating their popularity among Chinese consumers.
GM’s Business Strategy In China
General Motors (GM) has been operating in China for several decades and has established a strong presence in the country. The company’s strategy in China has been focused on expanding its market share and building long-term relationships with Chinese partners.
One of GM’s key strategies in China is collaborating with Chinese automakers to produce and sell vehicles that appeal to local customers. The company has joint ventures with several Chinese automakers, including SAIC Motor and Wuling Motors, which have helped GM to increase its market share in China.
Another important part of GM’s strategy in China is to invest in research and development to develop new technologies and products that meet the needs of Chinese consumers. The company has established several innovation centers in China to develop new electric and autonomous vehicles and advanced manufacturing technologies.
According to a report by Reuters in 2020, General Motors has invested over $14 billion in China since the 1990s.
In addition to these strategies, GM has expanded its distribution network in China by opening new dealerships and increasing its online presence. The company has been using digital marketing and e-commerce platforms to reach consumers in China, which has helped it build a strong brand and increase its sales there.
For example, GM focuses strongly on social media platforms such as WeChat, Weibo, and Douyin. The company has official accounts on these platforms, regularly posting updates on its products and services and engaging with customers through comments and direct messages.
GM also operates a dedicated website for its Chinese operations, where customers can learn more about the company’s offerings and locate dealerships in their area. Additionally, GM hosts various online events and promotions to engage with its audience and increase brand awareness.
Overall, GM’s strategy in China is focused on building strong partnerships, developing innovative products, and expanding its distribution network to capture a larger share of the Chinese market.
GM’s Ownership Of Companies In China Joint Ventures
The following table summarizes GM’s direct ownership interests in its China JVs:
| Percentage Of Ownership Interest (%) | ||
|---|---|---|
| Dec 31, 2024 | Dec 31, 2023 | |
| Automotive China JVs | ||
| SAIC General Motors Corp., Ltd. (SGM) | 50% | 50% |
| Pan Asia Technical Automotive Center Co., Ltd. | 50% | 50% |
| SAIC General Motors Sales Co., Ltd. (SGMS) | 49% | 49% |
| SAIC GM Wuling Automobile Co., Ltd. (SGMW) | 44% | 44% |
| Shanghai OnStar Telematics Co., Ltd. (Shanghai OnStar) | 40% | 40% |
| SAIC GM (Shenyang) Norsom Motors Co., Ltd. (SGM Norsom) | 25% | 25% |
| SAIC GM Dong Yue Motors Co., Ltd. (SGM DY) | 25% | 25% |
| SAIC GM Dong Yue Powertrain Co., Ltd. (SGM DYPT) | 25% | 25% |
| Other Joint Ventures | ||
| SAIC-GMAC Automotive Finance Company Limited (SAIC-GMAC) | 35% | 35% |
| SAIC-GMF Leasing Co., Ltd. | 35% | 35% |
As shown in the table above, GM owned up to 50% of most of the companies in China Joint Ventures. General Motors’ 50% ownership in China JVs applies to only two of the ten companies in the table above.
For the rest of the companies in China Joint Ventures, GM’s ownership interest in these companies is much smaller, from 40% to 25%.
As a result, GM does NOT have a controlling interest in all of the companies in China Joint Ventures. However, GM has a significant influence over decisions relating to these companies’ operating and financial affairs.
Since GM does not have a controlling interest but have a significant influence on companies within the China JVs, they are considered as non-consolidated affiliates to GM. The definition of non-consolidated affiliates can be found here: non-consolidated affiliates.
Car Sales
GM-China-vehicle-sales
(click image to expand)
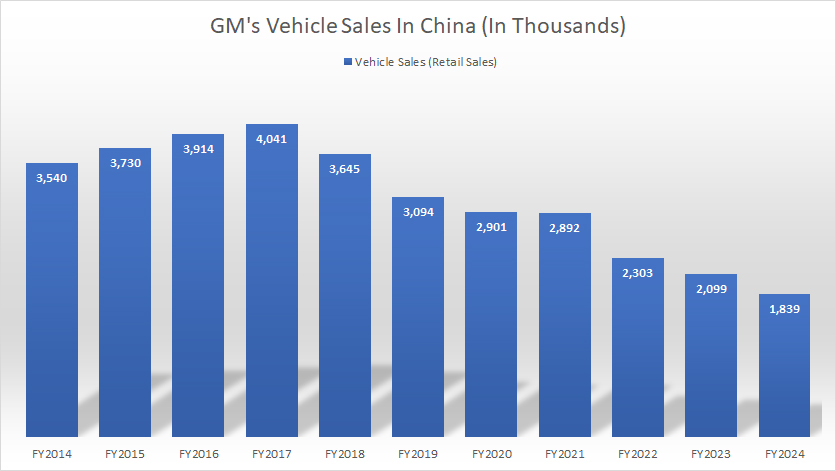
The car sales numbers presented here represent GM’s retail sales in China. The definition of GM’s car sales can be found here: GM’s car sales. Please note that this statistics depicts the direct sales from GM’s dealers to consumers, as defined in the definitions.
That said, GM’s vehicle retail volume in China declined to only 1.8 million as of the end of fiscal year 2024, down 14% from 2.1 million vehicles sold in 2023, and more than 50% from the peak figure of 4 million vehicle sold in 2017.
GM’s car sales in China peaked at 4 million vehicles in 2017. Since then, its vehicle sales in China have been on the decrease. GM’s 2024 vehicle sales of 1.8 million in China was an all-time low over the past decade.
Market Share
GM-China-market-share
(click image to expand)
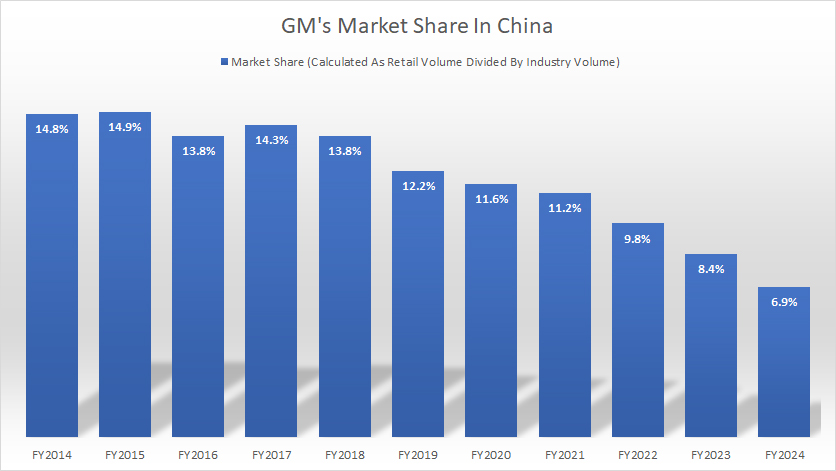
The definition of GM’s market share can be found here: GM’s market share.
GM had approximately 9.8% of the market share in China as of 2022. This figure has been on the decline since 2014.
GM’s market share in China totaled 14.8% in 2014. However, this figure decreased to only 6.9% as of the end of fiscal year 2024, down by more than half over the past decade.
Revenue
General Motors does not consolidate the revenue earned by the companies under the China Joint Ventures because it does not have a controlling interest in these companies.
As mentioned in the ownership interest section, the companies under the China Joint Ventures are considered as non-consolidated affiliates to General Motors.
The revenue and expenses of non-consolidated affiliates are not consolidated into GM’s financial statements; instead, the proportionate share of the earnings of each nonconsolidated affiliate is reflected as Equity income, which we will see in the next discussion.
As a result, GM does not earn any revenue from its China Joint Ventures.
Investors interested in GM’s global revenue may visit this page here: GM revenue breakdown: sales of new and old vehicles and services.
Profit
GM-China-profit
(click image to expand)
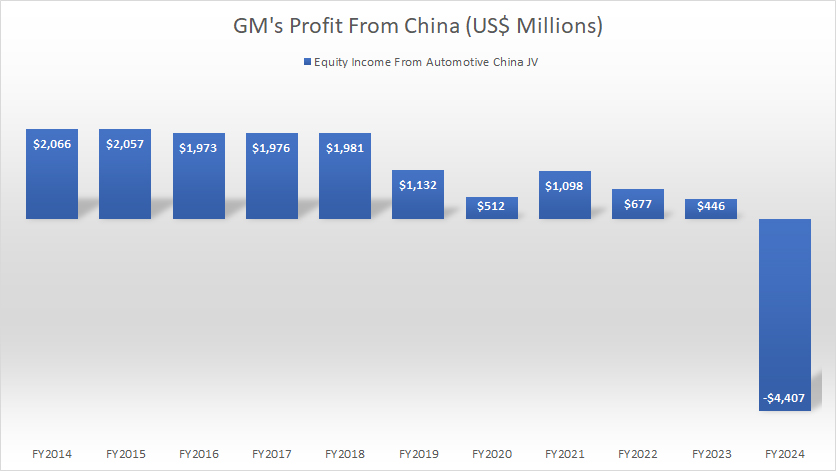
Although GM does not consolidate the revenue from its China Joint Ventures, it does receive profit from its non-consolidated affiliates.
GM’s profit from its China Joint Ventures is in the form of equity income.
The reason is that GM does not have a controlling interest in the companies within the China Joint Ventures.
That said, GM’s profit from China declined to only $446 million in fiscal year 2024, the lowest level ever recorded over the past decade.
In fiscal year 2024, GM’s China JV incurred a loss of more than $4 billion, the loss ever recorded since 2014.
Investment Carrying Value
GM-China-investment-carrying-value
(click image to expand)
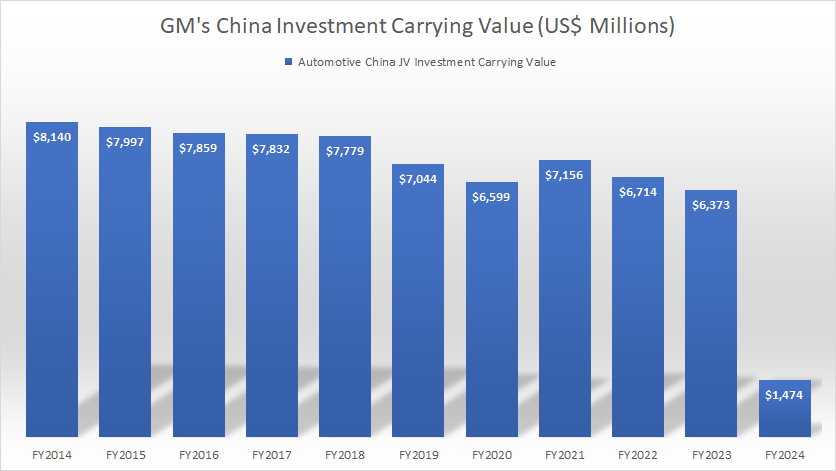
How much is GM’s JV investment in China worth?
According to the latest annual report dated Dec 31, 2024, the carrying value of GM’s China JV investment was down to only $1.5 billion as of the end of fiscal year 2024.
The 2024 figure was reduced by more than 70% from the $6.4 billion reported in fiscal year 2023.
Since 2014, the carrying value of GM’s China JV investment has significantly decreased, down from $8.1 billion in 2014 to less than $1.5 billion as of 2024, representing a drop of 80% over the past ten years.
Profit Yield
GM-China-profit-yield
(click image to expand)
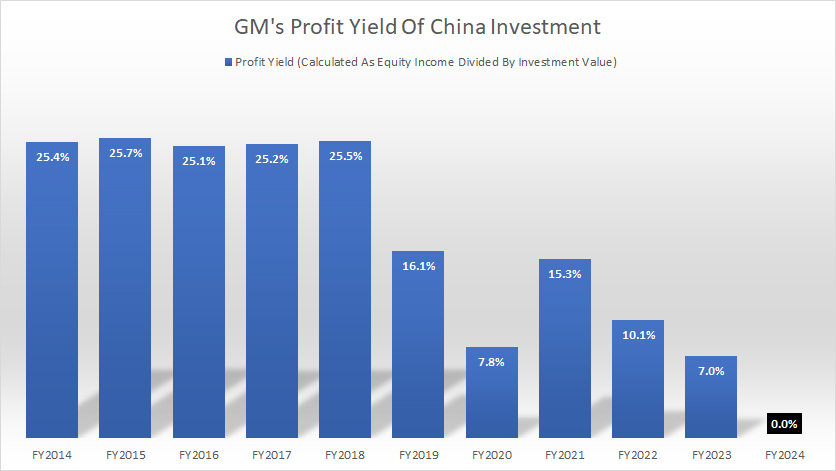
The profit yield of GM’s China JV investment came in at 0.0% in fiscal year 2024 compared to 7% measured a year earlier. The latest 0% yield was due to the negative profit generated by the China JV, which we saw earlier.
Historically, GM China JV generated investment yield of as much as 25%. However, this figure has significantly declined in recent years, driven primarily by the decrease in the equity income that GM received from the China JV.
Vehicle Wholesale
GM-China-JV-vehicle-wholesale
(click image to expand)
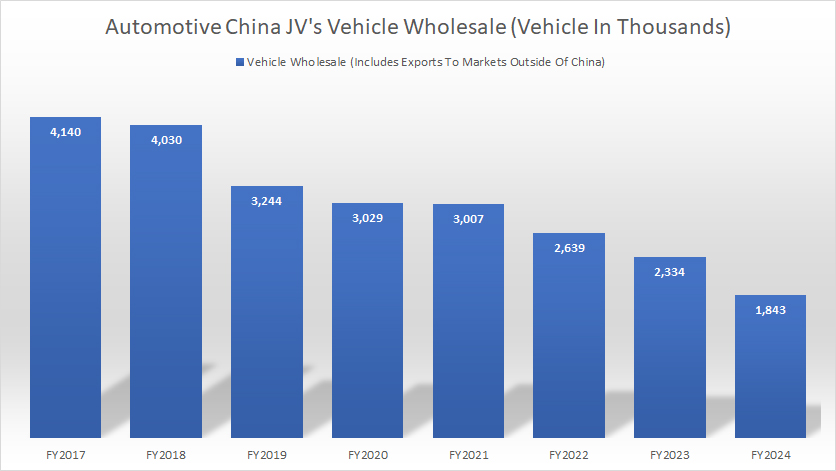
The vehicle wholesale presented here depicts the vehicle wholesale delivered by GM’s non-consolidated affiliates under the Automotive China Joint Ventures. This statistics is different from the retail sales which we saw earlier, but they are nearly at the same levels. Please note that this wholesale statistics depicts the direct sales from GM China Jv to dealerships.
As of fiscal year 2024, GM’s non-consolidated affiliates within the Automotive China JVs delivered a record low of 1.8 million vehicles, down by over 20% from a year earlier.
Since 2017, vehicle wholesale of GM’s non-consolidated affiliates under the Automotive China JVs has significantly decreased, down from over 4 million vehicles in 2017 to 1.8 million in the latest result, representing a decline of more than 50% in the past decade.
Revenue
GM-China-JV-revenue
(click image to expand)
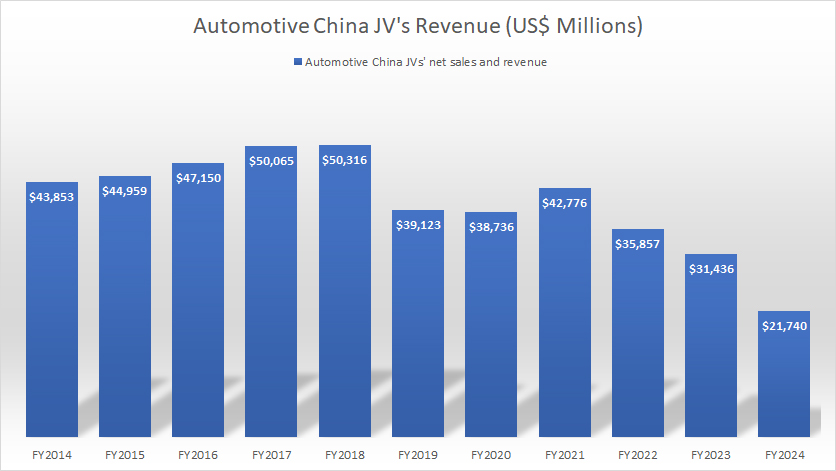
Similarly, the revenue presented here represents the net sales generated by GM’s non-consolidated affiliates under the Automotive China Joint Ventures. It is correlated with the vehicle wholesale that we saw in the previous discussion.
In other words, the revenue rises with the increase in vehicle wholesale and vice versa.
That said, the revenue of GM’s non-consolidated affiliates topped $21.7 billion in fiscal year 2024, an all-time low and more than 30% lower than the $31.4 billion reported a year earlier. This figure peaked at over $50.3 billion in revenue achieved in fiscal year 2018.
After fiscal 2018, the revenue of GM’s non-consolidated affiliates under the Automotive China JVs has significantly decreased, reaching the record low in the latest result.
Profit
GM-China-JV-profit
(click image to expand)
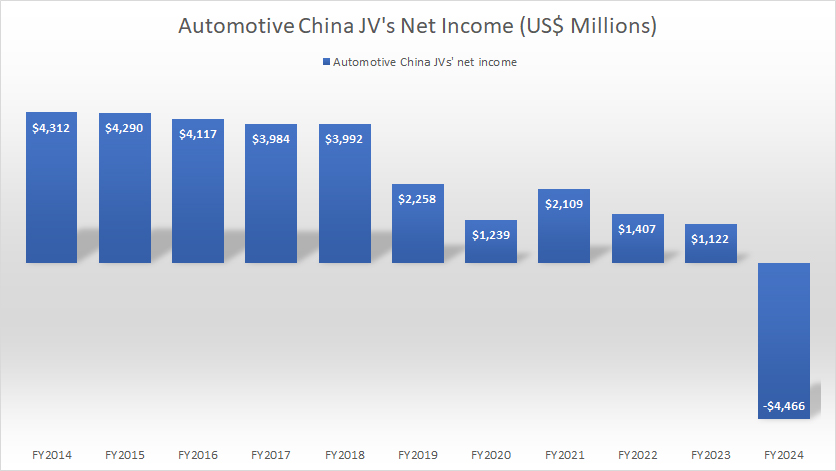
GM’s non-consolidated affiliates within the Automotive China JVs made a profit of $1.12 billion in fiscal year 2023. However, this figure turned to a loss of $4.5 billion in fiscal year 2024.
Since 2014, the profit of GM’s non-consolidated affiliates under the Automotive China JVs has significantly declined, suggesting an increasingly challenging environment of the automobile market in China and overseas.
Profit Margin
GM-China-JV-profit-margin
(click image to expand)
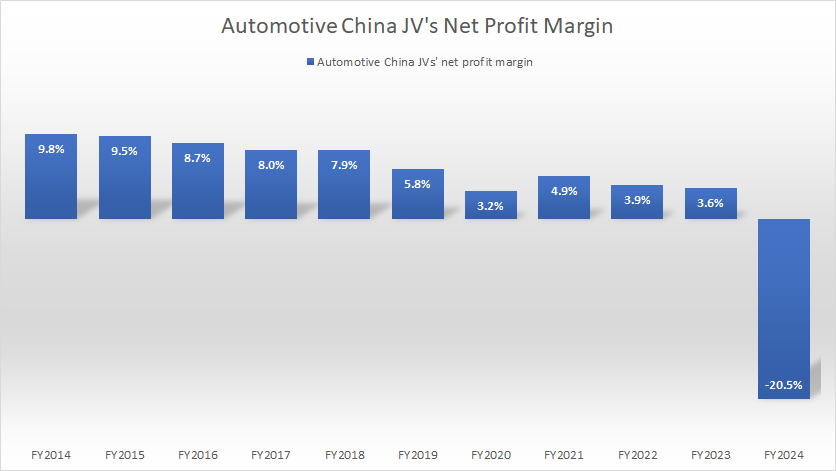
As the profit of GM’s non-consolidated affiliates under the Automotive China JVs is down, the profit margin also decreases.
As seen in the chart above, the profit margin of GM’s non-consolidated affiliates in China has decreased to only 3.6% in fiscal year 2023, a record low since 2014.
However, in fiscal year 2024, it turned to a negative ratio of -20.5%, indicating a loss.
Cash & Cash Equivalents
GM-China-JV-cash-and-cash-equivalents
(click image to expand)
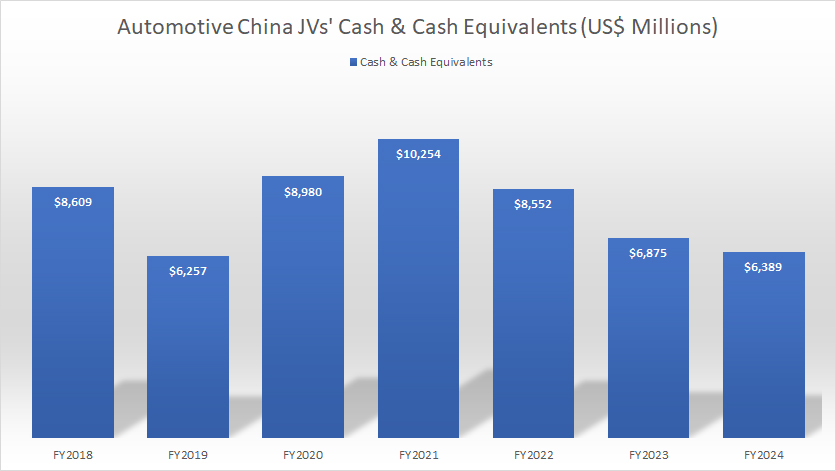
The profit and profit margin of GM’s non-consolidated affiliates in China may have been down, but they are flushed with cash.
As shown in the chart above, they have cash and cash equivalents of up to $6.4 billion as of the end of fiscal year 2024. However, this figure was significantly lower than the peak figure of $10.3 billion reported in fiscal year 2021.
On average, GM’s China non-consolidated affiliates carry cash & cash equivalents exceeding $6 billion.
Debt
GM-China-JV-debt
(click image to expand)
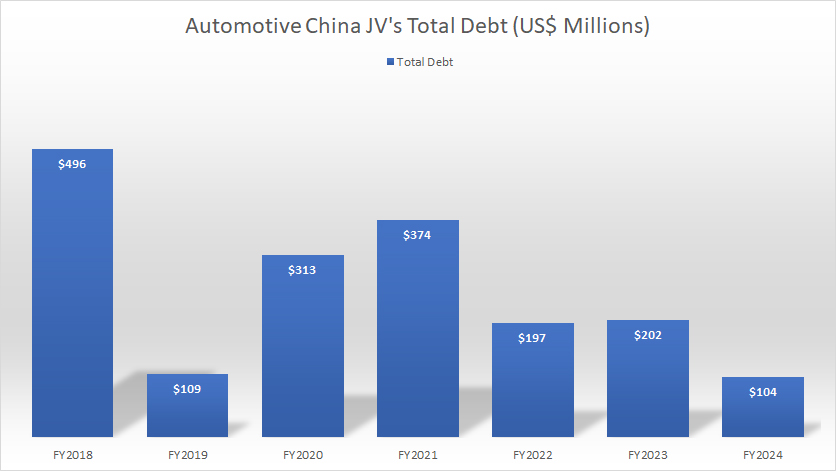
GM’s China non-consolidated affiliates are not only flush with cash, but they also carry little to no debt.
For example, as of 2024, they had a total debt of only $104 million, a significantly small figure compared to its available cash.
In other words, GM’s China non-consolidated affiliates are debt-free.
Insight
General Motors (GM) has established several joint ventures in China to strengthen its market presence. While these partnerships have historically bolstered GM’s position as a leading foreign automaker in the region, recent statistics highlight significant challenges.
GM’s vehicle wholesale, revenue, and profit margins from its Chinese joint ventures have seen notable declines over the years. Additionally, the equity income that GM receives from these ventures has diminished sharply, underscoring the growing complexities of operating in the Chinese automotive market.
References and Credits
1. All financial figures presented were obtained and referenced from GM’s quarterly and annual reports published on the company’s investor relations page: GM SEC Filings.
2. Pixabay Images
Disclosure
We may use artificial intelligence (AI) tools to assist us in writing some of the text in this article. However, the data is directly obtained from original sources and meticulously cross-checked by our editors multiple times to ensure its accuracy and reliability.
If you find the information in this article helpful, please consider sharing it on social media. Additionally, providing a link back to this article from any website can help us create more content like this in the future.
Thank you for your support and engagement! Your involvement helps us continue to provide high-quality, reliable content.

Your blog is a true hidden gem on the internet. Your thoughtful analysis and engaging writing style set you apart from the crowd. Keep up the excellent work!