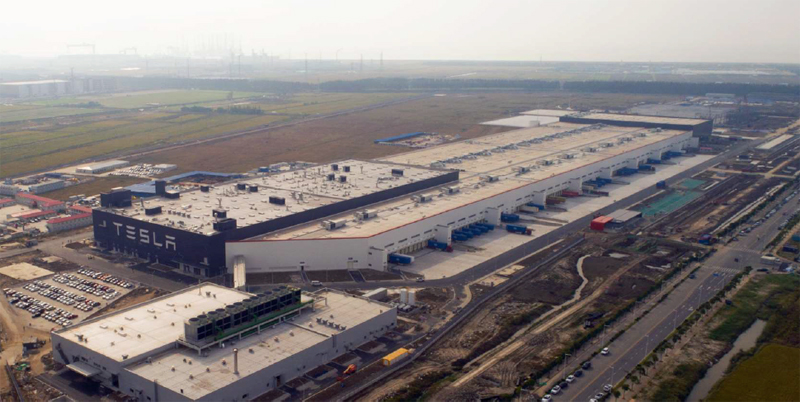
Tesla Gigafactory Shanghai. Source: Tesla Q3 2019 Update Letter
Cash is the lifeline of a business.
For this reason, Tesla’s (NASDAQ: TSLA) cash flow has always been a hot topic, not just among investors but also creditors.
Most parties are eager to find out about Tesla’s cash position, and they want to know if the company has enough liquidity to operate its businesses.
For your information, Tesla has been not only profitable but also cash flow positive. As a result, Tesla’s cash on hand has massively expanded in recent years.
In the following discussion, we will look into Tesla’s cash position and analyze the respective cash reserves over some time to see how the numbers have changed. In addition, we will also take a look at the operating cash flow and the respective cash margins.
Also, we will compare Tesla’s cash position with free cash flow to see how the two cash metrics correlate. Finally, we explore Tesla’s net cash from financing activities to see what the company does with the cash.
Let’s take a look!
Investors interested in other key statistics of Tesla may find more resources on these pages:
- Tesla stock dilution,
- Tesla revenue streams: automotive vs energy, and
- Tesla gross margin analysis: automotive vs energy.
Please use the table of contents to navigate this page.
Table Of Contents
Definitions And Overview
O2. How Does Tesla Use Its Cash
Consolidated Results
A1. Cash On Hand
A2. Cash On Hand Breakdown
Digital Assets
B1. Digital Assets (Bitcoin & Others)
B2. Cash On Hand + Digital Assets
Cash Flow
C1. Operating Cash Flow
C2. Free Cash Flow
Cash Flow Margin
C3. Operating Cash Flow Margin
C4. Free Cash Flow Margin
Cash Flow Correlation
D1. Cash Position Vs Free Cash Flow
Cash From Debt Borrowing And For Repayment
E1. Net Cash From Financing Activities
Conclusion And Reference
S1. Conclusion
S2. References and Credits
S3. Disclosure
Definitions
To help readers understand the content better, the following terms and glossaries have been provided.
Cash Flow Margin: Cash flow margin is a financial metric that assesses a company’s ability to generate cash from its operations. It is calculated by dividing a company’s operating cash flow by revenue. The resulting percentage represents the cash a company generates from every dollar of revenue it earns.
A higher cash flow margin indicates that a company efficiently manages its cash flow and is better equipped to meet its financial obligations. Investors and analysts often use it to evaluate a company’s financial health and profitability.
Carrying Value: Carrying value is the net value of an asset or liability on a company’s balance sheet. This value is calculated by subtracting accumulated depreciation or amortization from the asset’s original cost or by subtracting the principal balance of liability from the original amount borrowed.
The carrying value is sometimes referred to as the book value or the net carrying value. It represents the remaining value of an asset or liability after accounting for any depreciation, amortization, or principal payments made over time.
Fair Market Value: Fair market value is the estimated price that an asset or property would sell on the open market. It is the price at which a willing buyer and a willing seller, both having reasonable knowledge of the relevant facts, would agree to a transaction.
Fair market value takes into account various factors, such as the current market conditions, the condition and location of the asset or property, and other relevant economic factors. It is often used in tax assessments, legal disputes, and financial reporting to determine the value of an asset or property.
Net Cash From Financing Activities: Net cash from financing activities is a section of a company’s cash flow statement that shows the amount of cash inflows and outflows related to financing activities, such as issuing or repurchasing stocks and bonds, paying dividends, and taking out or repaying loans.
It represents the net change in a company’s cash position due to these financing activities during a specific period, typically a quarter or a year.
A positive net cash from financing activities indicates that a company has raised more cash through financing than it has paid out, while a negative net cash from financing activities suggests that a company has paid out more cash for financing than it has received.
How Does Tesla Use Its Cash
Tesla uses its cash for various purposes, including research and development of new technologies, expanding its production capacity, building new factories and facilities, investing in energy storage solutions, and acquiring other companies to help it achieve its goals.
Additionally, Tesla has also been known to use its cash to repay debt and fund acquisitions of other companies that can help it expand its capabilities. Overall, Tesla’s strategic use of cash has been a key driver of its success in the automotive and energy industries.
Cash On Hand
Tesla’s cash on hand
(click image to expand)
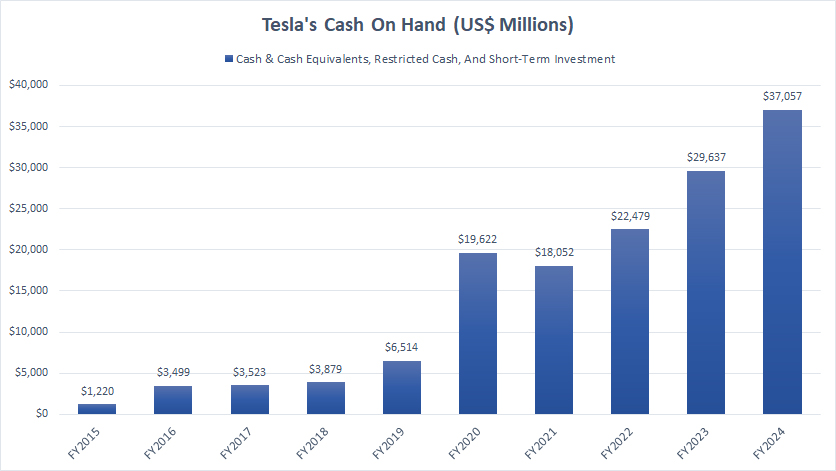
Tesla’s cash on hand has massively expanded in recent years and totaled more than $37 billion as of the end of 2024. Of this amount, over $16 billion was cash and cash equivalents, while short-term investment contributed over $20 billion.
It makes sense for Tesla to expand its cash position as it runs a capital-intensive operation and requires significant working capital to grow.
Cash On Hand Breakdown
tesla-cash-on-hand-breakdown
(click image to expand)
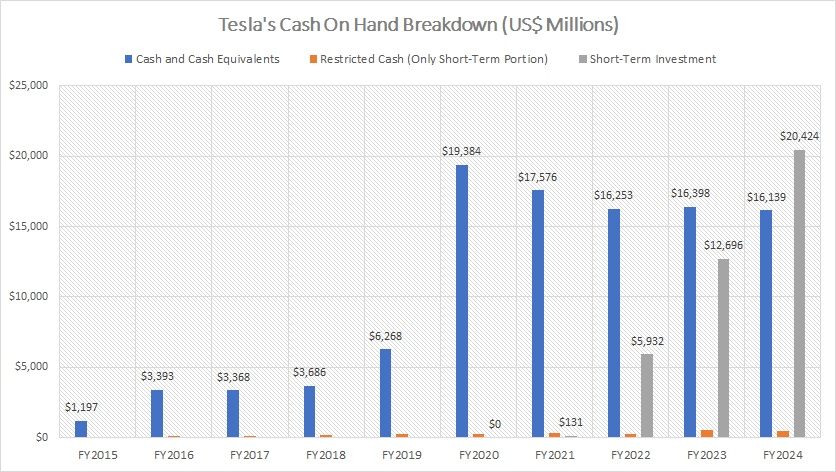
Tesla’s total cash on hand consists of cash & cash equivalents, restricted cash (short-term portion), and short-term investments. As of the end of fiscal year 2024, Tesla has over $16 billion in cash & cash equivalents, $20 billion in short-term investment, and just $500 million in restricted cash (short-term portion).
Among all cash components, the short-term investment has increased the fastest. Tesla’s total short-term investment surpassed its cash & cash equivalents in the latest result.
Digital Assets (Bitcoin & Others)
tesla-digital-assets
(click image to expand)
Aside from cold hard cash, Tesla also holds digital assets such as bitcoin and other digital currencies.
However, digital assets are not recognized as cash in the balance sheets and, therefore, are not considered current assets. Instead, digital assets are recognized as indefinite-lived intangible assets or simply digital assets under the long-term asset section.
That said, Tesla bought $1.5 billion worth of digital assets in 2021. Here is an excerpt from the 2023 and 2022 annual reports regarding Tesla’s investment in digital currency.
-
Tesla Investments In Digital Currency
During the years ending December 31, 2023, and 2022, we purchased and/or received an immaterial amount of digital assets. During the year ended December 31, 2021, we purchased and/or received $1.50 billion of digital assets.As of December 31, 2022, we have converted approximately 75% of our purchases into fiat currency. As of December 31, 2022, and 2021, the carrying value of our digital assets held was $184 million and $1.26 billion, which reflects cumulative impairments of $204 million and $101 million in each period, respectively.
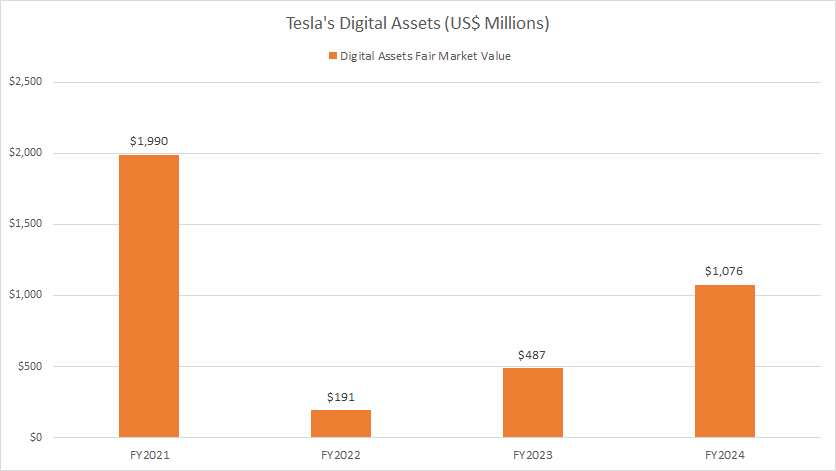
As of December 31, 2023, the carrying value of our digital assets was $184 million. The fair market value of such digital assets held as of December 31, 2023, was $487 million.
The definitions of carrying value and fair market value are available here: carrying value and fair market value.
As of Dec 31, 2024, the carrying value of Tesla’s digital assets was worth $387 million. Although the carrying value has remained relatively flat, the fair market value has increased and climbed to $1,076 million as of the end of 2024, as shown in the plot above.
The abrupt decrease in the fair market value of Tesla’s digital assets shown in the chart above is due to the liquidation of some of its digital currency. As of the end of 2024, Tesla’s digital currency holdings were worth $1,076 million on the open market.
Cash On Hand + Digital Assets
tesla-cash-on-hand-including-digital-assets
(click image to expand)
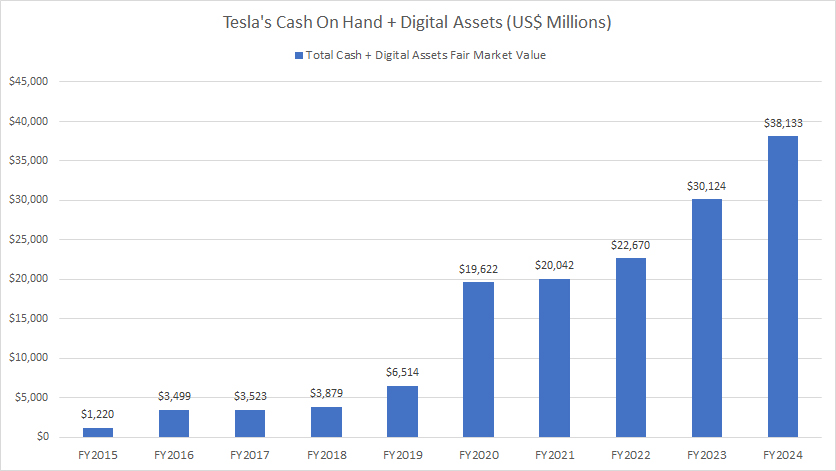
If we consider the digital assets’ fair market value, Tesla’s cash on hand totaled over $38 billion ($37 billion + $1 billion) by the end of fiscal year 2024.
This amount rose more than 26% from a year ago.
Operating Cash Flow
Tesla’s operating cash flow
(click image to expand)
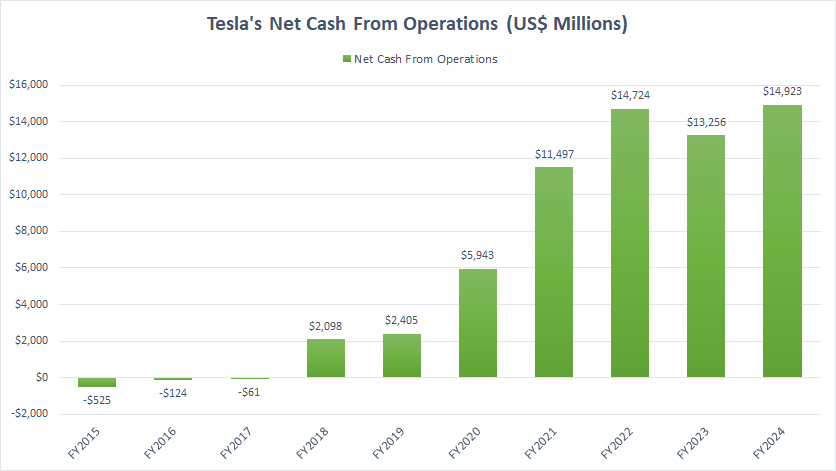
A discussion of Tesla’s cash without including its net cash from operations is deemed incomplete. As such, I had a chart above to depict Tesla’s net cash from operations.
As seen, Tesla’s net cash from operations has significantly risen over time. In fact, Tesla has become cash flow positive since 2018, as shown in the chart above.
Over the past three years, Tesla’s net cash from operations averaged $14 billion, and the latest figure came in at $14.9 billion, a record high in over a decade.
At an average net cash from operating activities of over $14 billion, Tesla is literally printing cash.
Free Cash Flow
Tesla’s free cash flow
(click image to expand)
In general, free cash flow is derived from the following equation:
Free cash flow = net cash from operations – capital expenditures
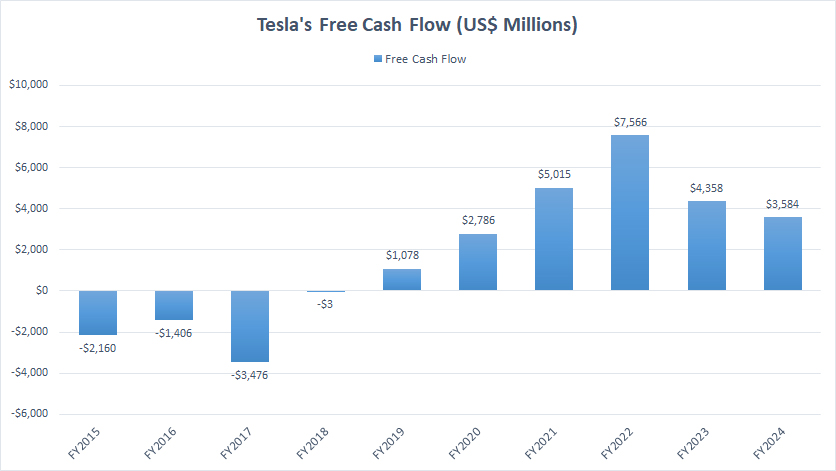
After accounting for capital expenditures, Tesla has an incredible free cash flow run. For the past three years, Tesla’s free cash flow averaged $5 billion, with the latest number landing at $3.6 billion.
On average, Tesla generates $5 billion in free cash flow annually, making it a cash cow.
Operating Cash Flow Margin
Tesla’s operating cash flow margin
(click image to expand)
The definition of operating cash flow margin is available here: cash flow margin.
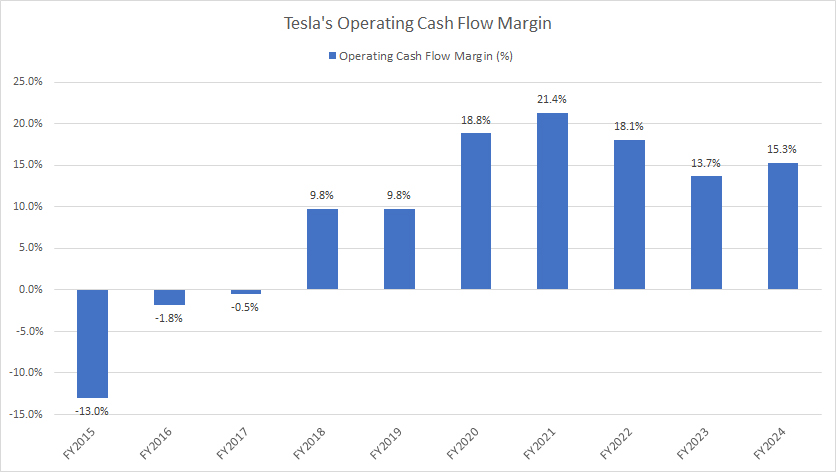
Tesla’s operating cash flow margin has significantly declined over the last several years. In 2022, it average over 20%. However, the average figure came at 15% in 2024.
As of 2024, Tesla’s operating cash flow margin totaled 15%, down considerably from the 21% recorded in 2021 but still an impressive figure by all measures.
At this ratio, Tesla’s operating cash flow margin is comparable to and even exceeds General Motors, as shown in this article – General Motors operating cash flow.
At a margin of 15%, Tesla is capable of converting 1 dollar of sales to 0.15 dollars of net cash from operations.
Free Cash Flow Margin
Tesla’s free cash flow margin
(click image to expand)
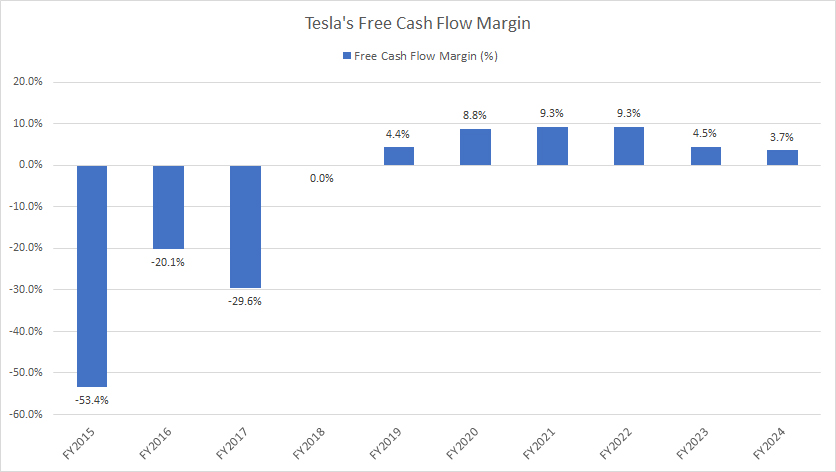
The definition of free cash flow margin is available here: cash flow margin.
Similar to the operating cash flow margin, Tesla’s free cash flow margin has also significantly come down in recent years, implying a lower efficiency in converting revenue to free cash flow. The average figure came at 6% for the past three years.
As of 2024, Tesla’s free cash flow margin clocked only 3.7%, down considerably from the peak figure of 9.3% recorded three years ago. The figure below 5% is considered poor.
Therefore, Tesla has poor conversion of revenue to free cash flow. At a ratio of 4%, Tesla can only convert 1.00 dollars of sales to about 0.04 dollars of free cash flow.
Cash On Hand Vs Free Cash Flow
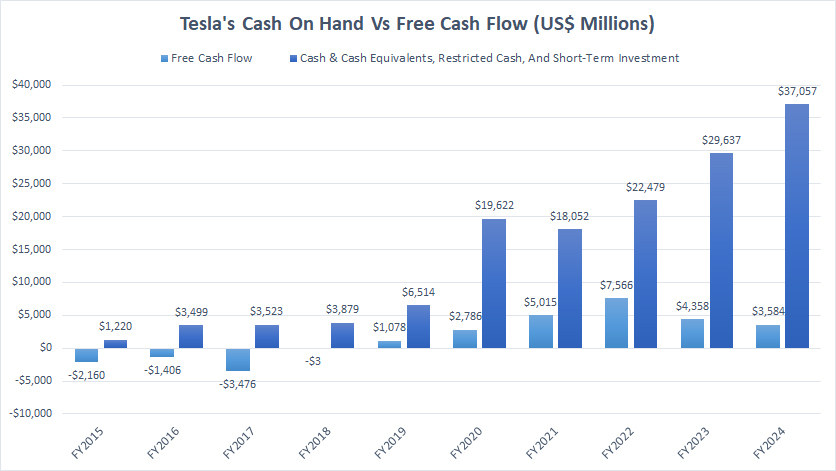
Tesla’s cash on hand vs free cash flow
(click image to expand)
Tesla’s cash on hand correlates closely with free cash flow. As shown in the chart, Tesla’s positive free cash flow tends to increase its cash on hand.
Net Cash From Financing Activities
Tesla’s net cash from financing activities
(click image to expand)
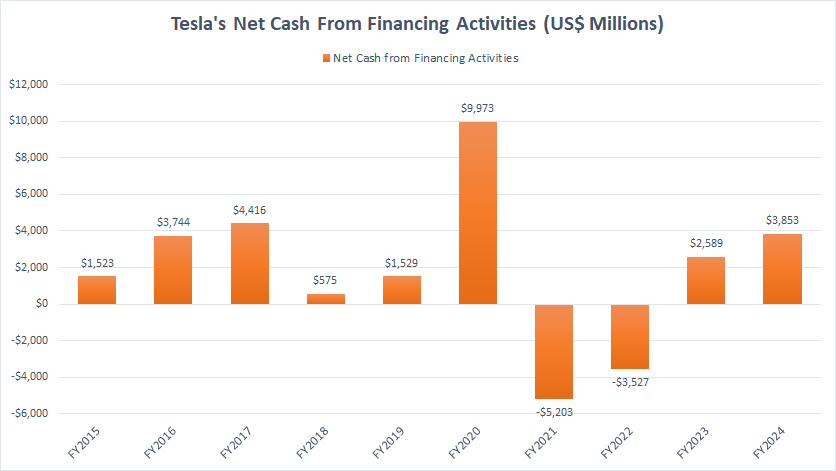
The net cash from financing activities depicts whether cash is used for debt repayment (negative numbers) or cash is added from debt borrowings (positive numbers). The definition of net cash from financing activities is available here: net cash from financing activities.
As depicted in the chart above, Tesla’s net cash from financing activities has been mostly positive historically, which suggests that the company has been borrowing more debt.
However, it turned negative in fiscal year 2021 and 2022, implying cash outflow for debt repayment, as the company does pay dividends and buy back shares. The debt repayment has significantly reduced its total debt.
In fiscal year 2023 and 2024, Tesla’s net cash from financing activities turned positive again, suggesting more debt borrowings. In other words, Tesla has started taking on debt in recent periods.
Conclusion
Tesla carries a significant amount of cash. This figure has significantly risen in the last several years, primarily driven by the company’s positive operating cash flow, which started in fiscal 2018.
Tesla’s positive operating cash flow has led to positive free cash flow, which drives the growth in Tesla’s cash position.
In short, Tesla is a cash cow and knows how to print cash.
References and Credits
1. All financial figures presented were obtained and referenced from Tesla’s quarterly and annual reports published on the company’s investor relations page: Tesla Press Releases.
2. Flickr Images.
Disclosure
We may use artificial intelligence (AI) tools to assist us in writing some of the text in this article. However, the data is directly obtained from original sources and meticulously cross-checked by our editors multiple times to ensure its accuracy and reliability.
If you find the information in this article helpful, please consider sharing it on social media. Additionally, providing a link back to this article from any website can help us create more content like this in the future.
Thank you for your support and engagement! Your involvement helps us continue to provide high-quality, reliable content.

Very helpful.