Tesla Model S. Flickr Image.
Tesla’s market capitalization or market cap has reached an insane level of as much as $1 trillion as of this article was published. The stock market has given Tesla a market valuation that is bigger than the combined value of all automobile companies on earth.
That said, you might wonder how Tesla’s market cap could reach such enormous value in as little as a year or maybe shorter? What has been driving the company’s market cap to reach more than $1 trillion?
The stock price is one factor but there is another factor that you may have missed out on.
The answer to this question can be found in Tesla’s shares outstanding or common stocks outstanding to be exact.
Let’s take a look!
Tesla Market Capitalization Topics
1. Share Outstanding
2. Market Capitalization
3. Market Cap At 50% Of Shares Outstanding Growth
4. Market Cap At 0% Of Shares Outstanding Growth
5. Conclusion
Tesla’s Share Outstanding
Tesla common stocks outstanding
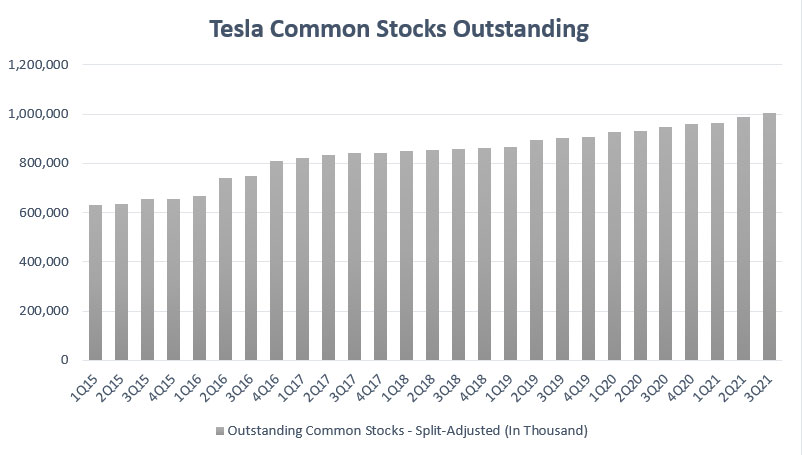
Let’s first check on Tesla’s outstanding common stocks which is shown in the chart above for the period from 2015 to 2021.
According to the chart, Tesla’s common shares outstanding have been on a rise since 2015, reaching a record high of more than 1 billion outstanding shares as of 3Q21.
Over the years, the company’s shares outstanding have grown from 600 million in 2015 to more than 1 billion as of 2021, representing a growth rate of more than 60% in the last 6 years.
The growth of Tesla’s shares outstanding has created advantages as well as disadvantages to the company.
For a detailed discussion of the effect of Tesla’s shares outstanding, this article, Tesla’s common shares outstanding, explains what has been driving the company’s share count to such a high level.
Tesla’s Market Capitalization
Tesla market cap
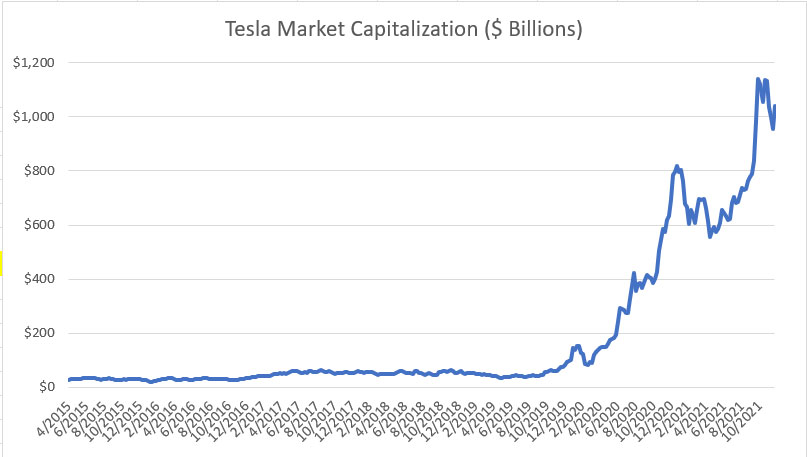
The chart above shows Tesla’s market capitalization in the last 6 years from 2015 to 2021.
According to the chart, Tesla’s market cap has not changed much prior to 2020, maintaining at roughly the $30 billion level since 2015.
Tesla’s market cap only started to surge dramatically in 2020 or the end of 2019.
By the end of 2020, Tesla’s market capitalization has already reached over half a trillion US dollars from about $30 billion seen a year ago.
Again, in just over a year from Dec 2020, Tesla’s market cap doubled to more than $1 trillion USD by the end of 2021, a new high for the company’s market valuation.
Thanks to the company’s increasing common stocks outstanding, Tesla’s market cap managed to surge more than 30X within just 3 years from 2019.
Therefore, most of Tesla’s market capitalization growth had only occurred in the last 3 years from 2019.
If you had bought Tesla’s stock in 2019, your investment would have surged at least 20X in just 3 years after excluding the effect of the growth of common stocks outstanding.
Tesla’s Market Capitalization At 50% Of Shares Outstanding Growth
Tesla market cap with reduced shares growth
What would happen to the market capitalization if the growth of Tesla’s shares outstanding were to be reduced by 50%?
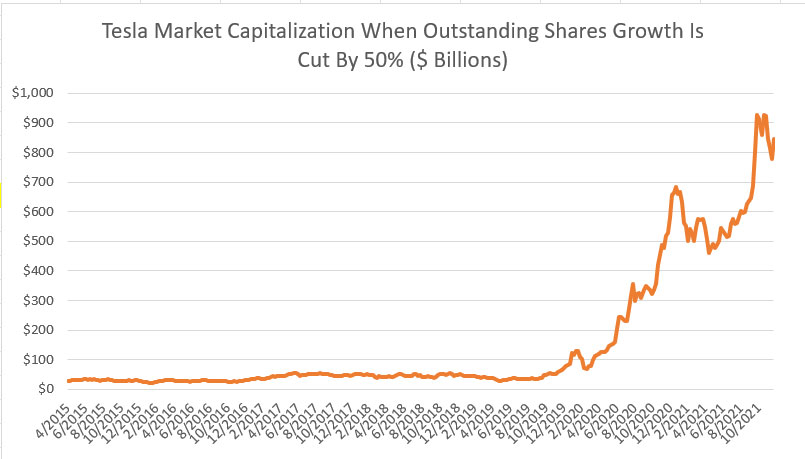
In this scenario, I have plotted a chart above that shows Tesla’s market cap when the company’s common stock outstanding growth is reduced by half while maintaining the same stock prices as in the prior chart.
According to the current chart, Tesla can only achieve a market cap of slightly over $900 billion at its best in 2021.
As of Dec 2021, Tesla’s market capitalization would have gone lower to slightly above $800 billion.
Instead of reaching $1 trillion of market capitalization, Tesla’s market valuation could only reach $800 billion, a $200 billion lower when common stock outstanding growth is cut by half.
In short, Tesla’s common shares outstanding growth has greatly contributed to the surge in the company’s market valuation.
Tesla’s Market Capitalization At 0% of Shares Outstanding Growth
Tesla market cap with zero shares growth
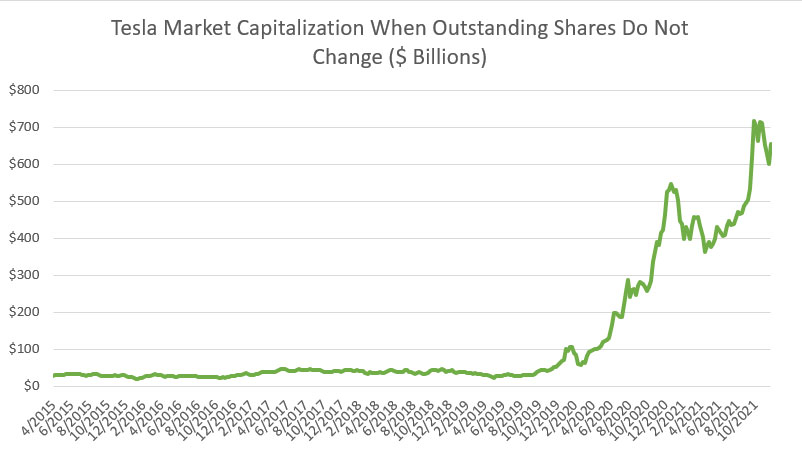
What would happen to Tesla’s valuation if Tesla’s stock count remains the same as it was back in 2015? This scenario highlights a no-growth situation of the company’s shares outstanding.
According to the chart above, when the shares outstanding remained the same as the number in 2015, Tesla’s market capitalization would only reach $650 billion in Dec 2021, a far lower figure than the current market valuation of over $1 trillion USD.
Therefore, the growth of Tesla’s common stocks all these years has created an extra of nearly $400 billion in market capitalization for the company.
In other words, in a no-growth scenario for the company common shares outstanding, Tesla can only achieve a market value of $650 billion in Dec 2021.
Still, Tesla’s market cap of $650 billion is quite massive compared to most automobile companies in the world.
At a market cap of $650 billion USD, Tesla is still the biggest automobile company in the world.
Conclusion
To recap, Tesla’s market cap has reached an insane value of $1 trillion USD as of Dec 2021.
The growth in Tesla’s market valuation has been mainly driven by two factors and they are (i) growth of stock prices and (ii) growth of common stocks outstanding.
While the growth of stock prices did contribute significantly to the growth of Tesla’s market valuation, the growth of common stocks cannot be ignored.
As seen in the chart, Tesla managed to gain an extra $400 billion in valuation just from the growth of its common shares.
References and Credits
1. All numbers in this article were obtained and referenced from Tesla’s financial statements available in Tesla Investors Days.
2. Featured images were used under Creative Common License and were obtained from Steve Jurvetson and Herman Caroan.
Other Useful Statistics
Disclosure
The content in this article is for informational purposes only and is neither a recommendation nor a piece of financial advice to purchase a stock.
If you find the information in this article helpful, please consider sharing it on social media and also provide a link back to this article from any website so that more articles like this one can be created in the future. Thank you!


