Employees. Pexels Image.
This article presents Tesla’s profit per employee.
For other key statistics of Tesla, you may find more resources on these pages:
Sales
Revenue
Energy
Profit Margin
- Profit margin breakdown: automotive, energy, and services,
- Gross profit and gross margin per vehicle,
R&D Comparison
Debt, Cash, and Liquidity
- Financial health: total debt, payment due, and liquidity,
- Cash flow and cash on hand analysis,
- Debt Ratios: debt to equity, capital structure, and more,
- Liquidity check: current ratio, working capital, and quick ratio,
Comparison With Peers
- Marketing, advertising, and promotional expenses,
- Tesla vs GM: profit margin analysis,
- Tesla vs Ford: vehicle profit and margin,
- Tesla vs BYD: profit margin comparison,
Other Statistics
- Interest expense and interest coverage ratio,
- Infrastructure expansion: supercharger stations, service fleets, and stores,
- Operating expenses breakdown analysis,
- Inventory breakdown analysis
Please use the table of contents to navigate this page.
Table Of Contents
Definitions And Overview
Employee Numbers
Profitability Metrics
A2. Gross Profit, Operating Profit, Pre-Tax Profit, And Net Profit
Profit Per Employee
Conclusion And Reference
S1. Insight
S2. References and Credits
S3. Disclosure
Definitions
To help readers understand the content better, the following terms and glossaries have been provided.
Profit Per Employee Calculation: Tesla’s profit per employee is defined as the company’s profitability metrics, which consist of gross profit, operating profit, profit before tax, and net profit, divided by the number of full-time employees worldwide.
Here is the formula:
Profit Per Employee = { Profitability Metrics } / Total Number Of Full-Time Employees Worldwide
* Profitability Metrics = Gross Profit | Operating Profit | Pre-Tax Profit | Net Profit
Total Employees Worldwide
Tesla-total-employees-worldwide
(click image to expand)
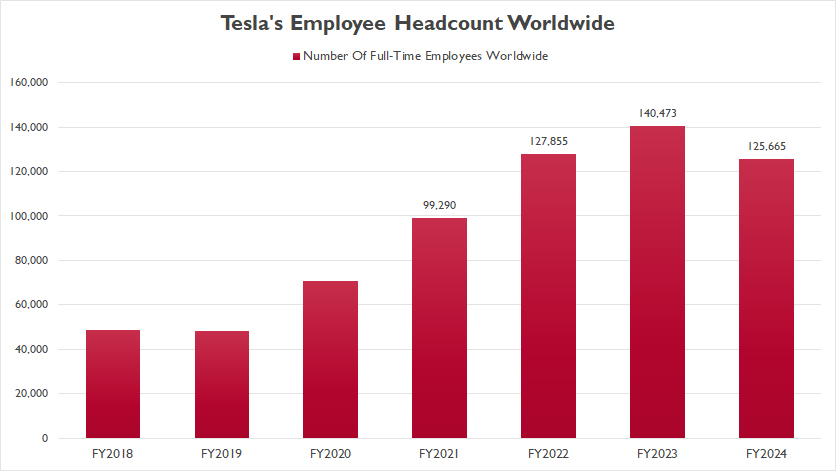
Let’s first look at Tesla’s employee headcount worldwide.
By the end of fiscal year 2024, Tesla employed approximately 125,665 full-time workers globally. This figure reflects a 10% decline from 2023, equating to a reduction of nearly 15,000 employees in just one year.
Despite this recent decrease, Tesla’s workforce has expanded dramatically over the past seven years.
Since fiscal year 2018, the company’s total employee count has surged by 180%, growing from around 50,000 to an impressive 126,000 in the latest report.
Gross Profit, Operating Profit, Pre-Tax Profit, And Net Profit
Tesla-profitability-metrics
(click image to expand)
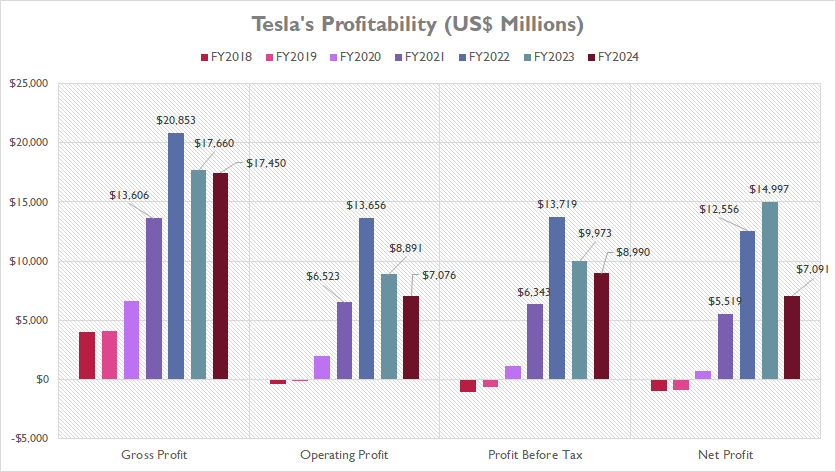
Tesla has remained largely profitable over the years, as reflected in its financial performance.
Many of its key profitability metrics — including gross profit, operating profit, pre-tax income, and net income — reached record highs in fiscal year 2022. However, since then, these figures have declined significantly.
For instance, Tesla’s gross profit fell from $20.9 billion in 2022 to $17.4 billion in 2024. Operating profit saw an even sharper drop, decreasing by more than 40% to $7.1 billion in the latest results.
Pre-tax income declined by 27%, from $13.7 billion to $9 billion. Meanwhile, net income shrank to just $7.1 billion as of fiscal year 2024.
Despite this downward trend, Tesla remained profitable and continued to generate substantial earnings.
Profit Per Employee
Tesla-profit-per-employee
(click image to expand)
The formula for the calculation of Tesla’s profit per employee is available here: profit per employee.
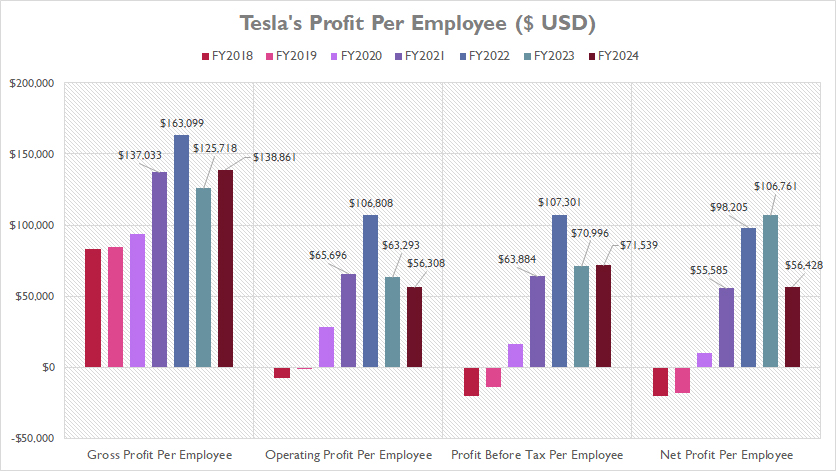
Since Tesla’s profitability metrics have declined significantly since 2022, its profit per employee has also dropped. However, due to a reduction in the company’s workforce, profit per employee actually rose in 2024 compared to 2023.
As illustrated in the chart, Tesla’s gross profit per employee increased to $138,900 in fiscal year 2024, up from $125,700 in 2023.
Other profitability metrics, such as operating income, pre-tax income, and net income, experienced declines, largely due to the sharper drop in overall profitability compared to workforce reduction.
For instance, Tesla’s operating profit per employee fell to $56,300 in 2024, down from $63,300 the previous year.
Net profit per employee followed a similar trend, decreasing from $106,800 in 2023 to $36,400 in 2024. Meanwhile, Tesla’s pre-tax income per employee remained unchanged at $71,500 in both years.
On average, Tesla generated a gross profit of $146,600 per employee between fiscal years 2022 and 2024.
Over the same period, average operating profit per employee stood at $75,500, while pre-tax income per employee averaged $83,300.
Tesla’s net income per employee averaged $87,100 across these three years.
Insight
Despite the downward profitability trend, Tesla continues to generate significant earnings per employee, reflecting its capacity to scale operations efficiently.
The company’s approach to workforce management and cost optimization will play a crucial role in its future profitability trends.
References and Credits
1. All financial figures presented were obtained and referenced from Tesla’s quarterly and annual reports published on the company’s investor relations page: Tesla Annual and Quarterly Results.
2. Pexels Images.
Disclosure
We may use artificial intelligence (AI) tools to assist us in writing some of the text in this article. However, the data is directly obtained from original sources and meticulously cross-checked by our editors multiple times to ensure its accuracy and reliability.
If you find the information in this article helpful, please consider sharing it on social media. Additionally, providing a link back to this article from any website can help us create more content like this in the future.
Thank you for your support and engagement! Your involvement helps us continue to provide high-quality, reliable content.


