Marlboro cigarettes. Source: Flickr Image
Altria Group, or Altria (NYSE: MO), is a highly profitable company.
Altria’s profit margins are the envy of most companies.
For example, on a consolidated basis, its gross margin is north of 60%.
Even more impressive is that its operating margins exceeded 50% in 2020.
This was achieved amid a severe pandemic outbreak.
While Altria has done an excellent job running the business, its stock price has told a different story as of late.
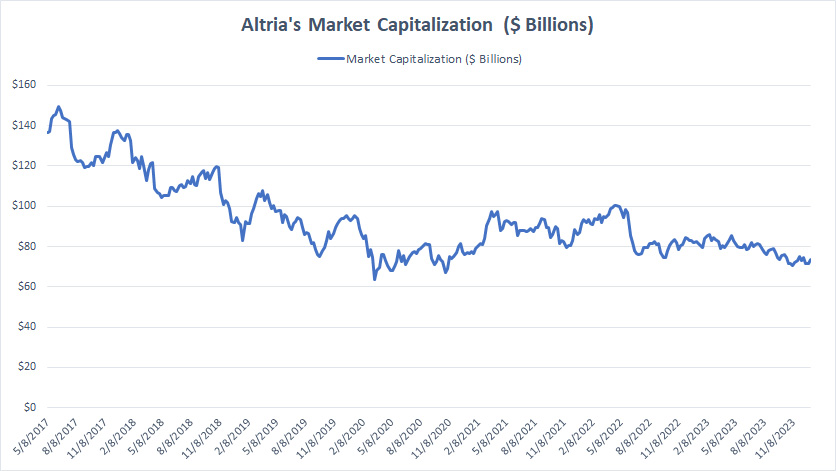
Between 2017 and 2024, Altria’s market capitalization has plunged by nearly 50%.
Altria used to be a US$150 billion company.
However, its recent valuation suggests it is worth only about US$70 billion as of Jan 2024.
Is Altria worth this low?
Let’s take a look.
In this article, we look at Altria’s market valuation from a historical perspective and do a comparison with peers.
Please use the table of contents to navigate this page.
Table Of Contents
Market Cap
Share Price Vs Fair Value
A1. Share Price Based On Discounted Cash Flow
Historical Valuation
B1. Price To Sales Ratio
B2. Price To Earnings Ratio
B3. Price To Book Ratio
Valuation Vs Peers
C1. PS Ratio Vs Peers
C2. PE Ratio Vs Peers
Valuation Vs Industry
D1. PS Ratio Vs Industry
D2. PE Ratio Vs Industry
Analyst Forecast
E1. Share Price Vs Price Target
Conclusion And Reference
S1. Conclusion
S2. References and Credits
S3. Disclosure
Market Capitalization
Altria market capitalization
(click image to expand)
Altria was once worth US$150 billion in market cap. However, the market cap has plunged from around $150 billion in mid-2017 to only $70 billion as of Jan 2024.
Altria’s 50% decline in market cap is driven primarily by falling stock prices.
Altria’s stock was valued at around $70 per share in May 2017.
However, this figure has fallen by more than 40% in the last six years and was worth only $40 per share as of Jan 2024.
Share Price Based On Discounted Cash Flow
Altria-share-price-based-on-discounted-cash-flow
(click image to expand)
* Data comes from Simpy Wall St.
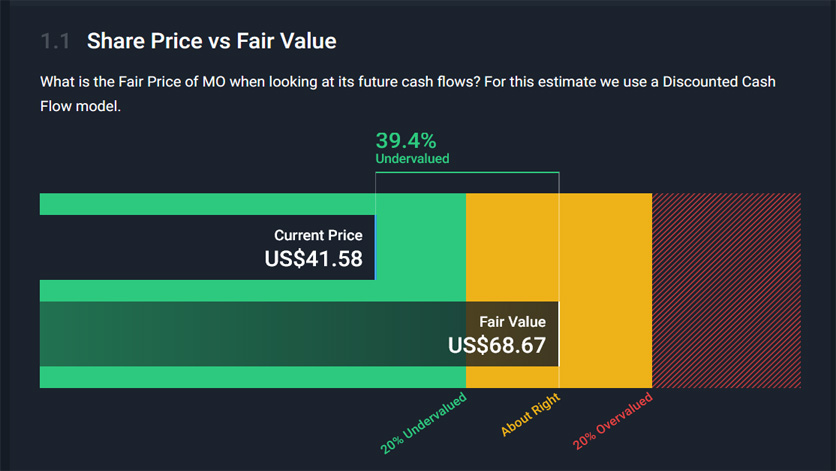
MO’s share price was traded at US$41.5 as of Jan 2024.
MO’s current share price was significantly undervalued by 39% compared to the fair value estimated based on discounted cash flow.
Price To Sales Ratio
Altria Group’s price-to-sales ratio as of Jan 2024.
| Date | Trailing Price To Sales Ratio |
|---|---|
| 1/2/2024 | 3.6X |
| 2023 | 3.75X |
| 2022 | 3.90X |
| 2021 | 4.1X |
| 2020 | 3.58X |
| 2019 | 4.68X |
| Average | 4.0X |
Regarding the price-to-sales ratio, Altria was valued at 3.6X its trailing 12-month (TTM) revenue as of Jan 2024.
On average, Altria’s price-to-sales ratio was 4.0X between 2019 and 2024.
Since 2019, Altria’s market valuation with respect to revenue has significantly declined.
Price To Earnings Ratio
Altria Group’s price-to-earnings ratio as of Jan 2024.
| Date | Trailing Price To Earnings Ratio |
|---|---|
| 1/2/2024 | 8.4X |
| 2023 | 10.78X |
| 2022 | 26.20X |
| 2021 | 26.80X |
| 2020 | -11.48X |
| 2019 | 0.80X |
| Average | 10.62X |
Altria’s price-to-earnings ratio, or PE ratio, was 8.4X as of Jan 2024.
Altria’s price-to-earnings ratio averaged 10.62X between 2019 and 2024.
Since 2019, Altria’s market valuation with respect to earnings has significantly declined.
Price To Book Ratio
Altria Group’s price-to-book ratio as of Jan 2024.
| Date | Trailing Price To Book Ratio |
|---|---|
| 1/2/2024 | -21.60X |
| 2023 | -21.30X |
| 2022 | -30.80X |
| 2021 | -15.20X |
| 2020 | 18.38X |
| 2019 | 8.98X |
| Average | -7.99X |
Altria’s negative price-to-book ratio was due to the company’s negative equity or book value.
As of the 3rd quarter of 2023, Altria’s equity or net worth was valued at -US$3.4 billion, one of the largest deficits ever recorded.
Altria had an equity or book value of $12 billion in 2017.
Over the years, Altria’s huge cash dividends and shares buyback has shrunk the equity or net worth of the company.
Altria’s shrinking equity has been further worsened by the drop in profitability in 2020 when the company suffered record losses driven by massive write-offs due to its investment loss in JUUL and Cronos as well as ABI.
PS Ratio Vs Peers
Altria-price-to-sales-ratio-vs-peers
(click image to expand)
* Data comes from Simpy Wall St.
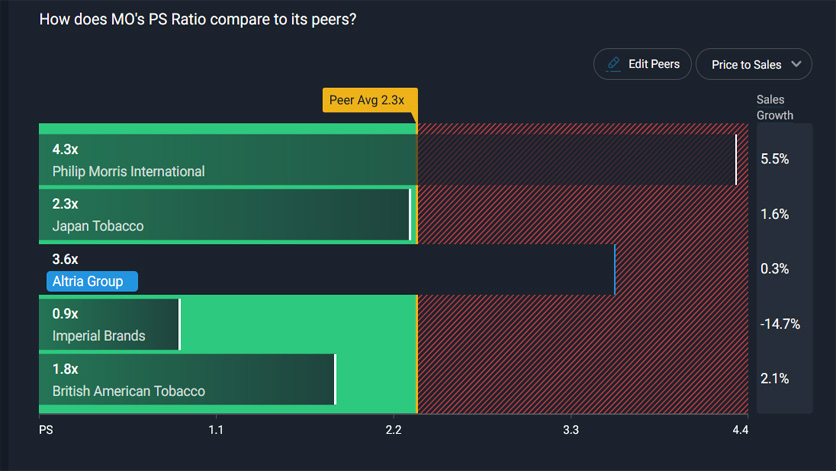
Compared to peers, Altria’s price-to-sales ratio is slightly higher than Japan Tobacco, Imperial Brands, and British American Tobacco, but is lower than Philip Morris International.
Among all tobacco companies in comparison, Philip Morris International has the highest price-to-sales ratio, probably due to the higher forecasted sales growth of 5.5%.
On the other hand, Alria’s forecasted sales growth came in at only 0.3%.
PE Ratio Vs Peers
Altria-price-to-earnings-ratio-vs-peers
(click image to expand)
* Data comes from Simpy Wall St.
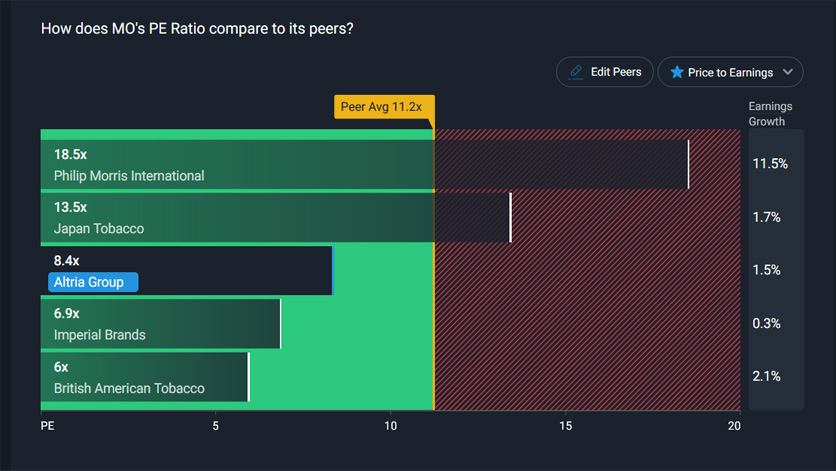
Altria’s PE ratio of 8.4X sits in the middle among its peers.
For example, Altria’s PE ratio of 8.4X is lower than Philip Morris International and Japan Tobacco but higher than Imperial Brands and British American Tobacco.
Again, Philip Morris International commands the highest valuation with respect to earnings, primarily due to the forecasted earnings growth rate of 11.5%, the highest among all tobacco companies in comparison.
PS Ratio Vs Industry
Altria-price-to-sales-ratio-vs-industry
(click image to expand)
* Data comes from Simpy Wall St.
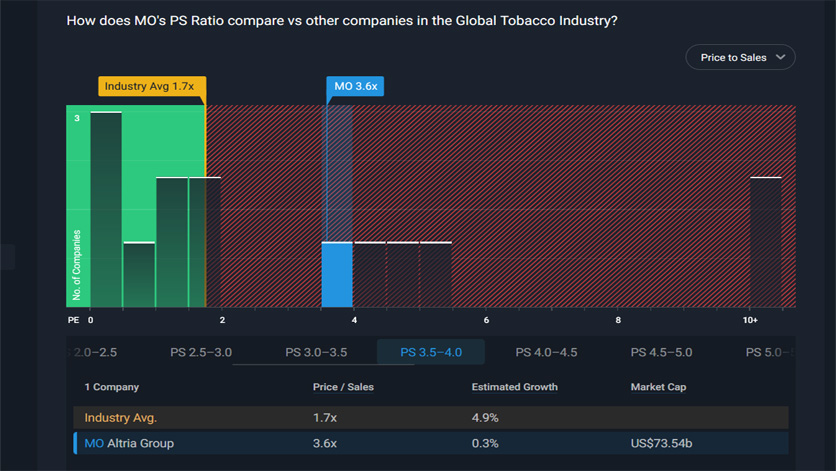
Against the global tobacco industry, Altria’s valuation with respect to revenue or sales was 2X higher than the industry average of 1.7X.
However, the forecasted sales growth for Altria was only 0.3% compared to the industry growth of 4.9%.
PE Ratio Vs Industry
Altria-price-to-earnings-ratio-vs-industry
(click image to expand)
* Data comes from Simpy Wall St.
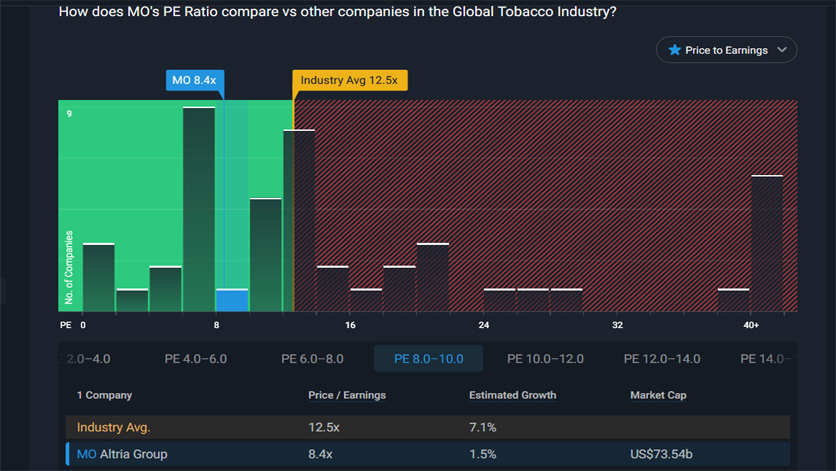
Against the global tobacco industry, Altria’s valuation with respect to earnings or profit was lower than the industry average of 12.5X.
However, the projected earnings or profit growth for Altria was only 1.5% compared to the industry growth of 7.1%.
Share Price Vs Price Target
Analyst price target of Altria (MO) as of Jan 2024.
| Types Of Share Price | Dates | ||
|---|---|---|---|
| Jan 2025 | Jan 2024 | Jan 2023 | |
| Average Price Target | US$46.7 | US$49.3 | US$52.3 |
| Potential Upside At The Time Of Forecasting | +12.7% | +7.7% | +11.0% |
| 1-Year Actual Share Price | NA | US$41.4 | US$45.7 |
| Actual Share Price At The Time Of Forecasting | US$41.4 | US$45.7 | US$47.4 |
| Number Of Analysts | 16 | 16 | 16 |
| Analysts’ Highs | US$70.0 | US$68.0 | US$68.0 |
| Analysts’ Lows | US$37.0 | US$37.0 | US$45.0 |
* Data comes from Simpy Wall St.
Altria’s share price is projected to hit US$46.7 on average by Jan 2025, a gain of roughly 12.7% based on the forecast of 16 analysts.
However, most analysts have missed their forecasted targets based on historical records.
For example, Altria’s share price should hit US$49.3 as of Jan 2024 based on the projections of 16 analysts.
The 1-year actual share price shows that Altria’s share price was US$41.4 as of Jan 2024, 16% below the average price target for the year.
Also, the average price targets from analysts have significantly declined since Jan 2023, from US$52.3 in Jan 2023 to US$46.7 by Jan 2025, suggesting a declining market valuation in the long term.
In short, based on analysts’ forecasts, things are not that optimistic for Altria.
Conclusion
Altria has been facing challenges in recent years, with declining cigarette sales and increased regulatory scrutiny.
As a result, Altria has been diversifying its product portfolio, investing in new technologies and acquisitions to expand its presence in the cannabis and e-cigarette markets.
Altria’s share price has been under pressure due to these challenges.
As of January 2024, the share price was $41.4, 16% below the average price target for the year. This indicates that analysts are not optimistic about the company’s near-term prospects.
However, Altria is still profitable, with over $70 billion market capitalization.
It has a dividend yield of over 9% as of Jan 2024, making it an attractive investment for income-seeking investors.
Altria also has a strong balance sheet, with a debt-to-equity ratio of 1.77, indicating sufficient cash flow to service its debt obligations.
Overall, Altria’s market valuation reflects the challenges that it is facing in the tobacco industry.
Still, the company’s efforts to diversify its portfolio and its strong financial position provide some reasons for optimism among investors.
References and Credits
1. All financial figures presented in this article were obtained and referenced from Yahoo Finance and Simply Wall St, which can be accessed at these links: Yahoo Finance and Simply Wall St – Altria Valuation.
2. Featured images in this article are used under Creative Commons licenses and sourced from the following websites: SoQ and South Bend Voice.
Disclosure
References and examples such as tables, charts, and diagrams are constantly reviewed to avoid errors, but we cannot warrant the total correctness of all content.
The content in this article is for informational purposes only and is neither a recommendation nor a piece of financial advice to purchase a stock.
If you find the information in this article helpful, please consider sharing it on social media and provide a link to this article from any website so that more articles like this can be created.
Thank you!
