
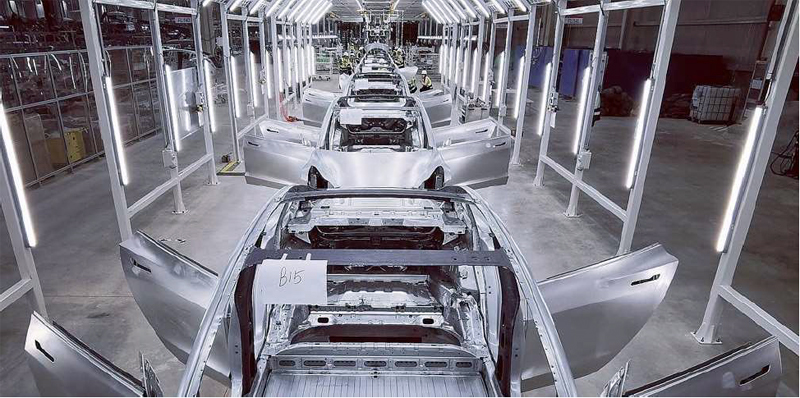
Tesla Gigafactory Shanghai. Source: Tesla Q3 2019 Update Letter.
Tesla’s automotive revenue refers to the income generated from its core business of designing, manufacturing, and selling electric vehicles.
This segment includes revenue from new vehicle sales, leasing, and automotive regulatory credits.
Additionally, it encompasses revenue from related services such as used vehicle sales, non-warranty after-sales services, paid supercharging, vehicle insurance, and retail merchandise.
However, in this article, we exclude the services income, focusing only on the automotive segment, which includes only vehicle sales and leasing, as well as automotive regulatory credits.
Let’s take a deeper look!
For other key statistics of Tesla, you may find more resources on these pages:
Sales
Revenue
Energy
Profit Margin
- Gross profit breakdown: automotive, energy, and services,
- Profit margin by segment: automotive, energy, and services,
- Gross profit and gross margin per car,
- Profit per employee,
R&D Comparison
Debt, Cash, and Liquidity
- Financial health: debt level, payment due, and liquidity,
- Cash flow and cash on hand analysis,
- Debt to equity, capital structure, and more,
- Liquidity check: current ratio, working capital, and quick ratio,
Comparison With Peers
- Marketing, advertising, and promotional spending,
- Tesla vs GM: profit margin comparison,
- Tesla vs Ford: vehicle profit and margin,
- Tesla vs BYD: profit margin comparison,
Other Statistics
- Interest expense and interest coverage ratio,
- Infrastructure expansion: supercharger stations, service fleets, and stores,
- Operating expenses breakdown analysis,
- Inventory breakdown analysis
Please use the table of contents to navigate this page.
Table Of Contents
Definitions And Overview
O2. Automotive Segment Overview
Insight & Summary of Observed Trends
Z1. Insight & Summary of Tesla’s Automotive Revenue
Revenue Statistics
Revenue
A1. Automotive Revenue (with and without Regulatory Credits)
A2. YoY Growth and Ratio to Total Revenue
Profitability
A3. Automotive Gross Margin (with and without Regulatory Credits)
Per Car Result
A4. Vehicle Sales and Revenue Per Car
Reference, Credits, and Disclosure
S1. References and Credits
S2. Disclosure
Definitions
To help readers understand the content better, the following terms and glossaries have been provided.
Automotive Revenue: Tesla’s automotive revenue refers to the financial income generated by the sales and leasing of Tesla’s electric vehicles. This includes revenue from selling and leasing their Model S, Model X, Model 3, and Model Y vehicles and any other automotive products or services the company offers.
Precisely, Tesla’s automotive revenue consists of two components: automotive sales and automotive leasing.
Investors interested in Tesla’s automotive sales revenue may find more information on this page: Tesla Car Sales Revenue.
Investors interested in Tesla’s leasing revenue may find more information on this page: Tesla Leasing Revenue And Leased Vehicle Sales.
Automtoive Revenue Per Car: Tesla’s automotive revenue per vehicle is calculated as:
Automotive Revenue Per Car = Total Revenue From The Automotive Segment / Total Car Deliveries
Automotive Segment Overview
The following diagram sums up Tesla’s automotive business segment.
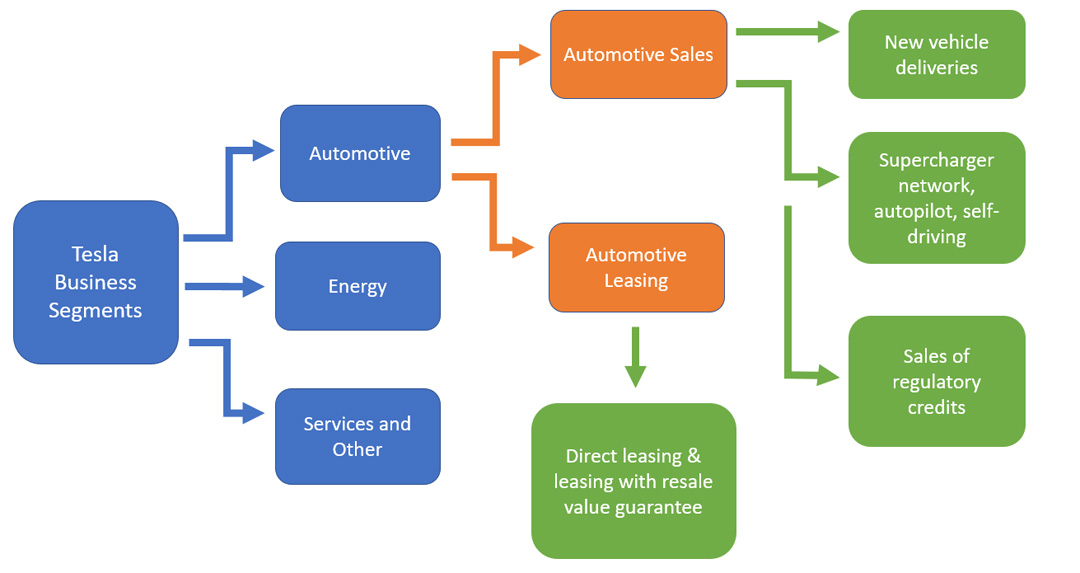
Tesla automotive business segment (click to enlarge)
Basically, Tesla’s automotive sector consists of two major segments: automotive sales and automotive leasing.
The automotive sales segment gets its revenue from new vehicle deliveries, charging and self-driving services, as well as the sale of carbon credits.
On the other hand, the automotive leasing segment gets its revenue from vehicle leasing, which is further divided into direct leasing and leasing with a resale value guarantee.
Insight & Summary of Tesla’s Automotive Revenue
The following analysis consolidates the trends observed across Tesla’s automotive revenue for the 2016–2025 period.
-
Tesla’s automotive revenue expanded at a remarkable pace from $6.4B in 2016 to a peak of $82.4B in 2023, driven by aggressive volume scaling — deliveries grew from approximately 76,000 units in 2016 to over 1.8 million by 2023.
-
However, the business entered a period of contraction in 2024 and 2025, with revenue declining 6.5% and 9.8% respectively, reflecting intensifying competitive pressure, sustained price cuts, and softening demand — a notable reversal after nearly a decade of uninterrupted growth.
-
The pricing strategy underpinning this volume expansion has come at a measurable cost to unit economics. Revenue per car has declined persistently, from approximately $94,000 in 2014 to $42,500 in 2025, a compression of more than 55%, as Tesla prioritized market share over per-unit pricing power.
-
This dynamic, combined with elevated cost structures, drove automotive gross margins down sharply from their peak of 29.3% in 2021 to 17.8% in 2025 — and stripping out regulatory credits, which have grown to $2.8B at peak but remain structurally volatile, the underlying margin of 15.4% in 2025 signals a business under meaningful profitability pressure.
-
Regulatory credits have provided a consistent but ultimately modest buffer, contributing between 1.5% and 4.0% of gross margin depending on the year, and are not a reliable foundation for sustained profitability.
-
Meanwhile, automotive revenue as a share of Tesla’s total has declined from over 90% in 2016 to 73% in 2025, reflecting the growing contribution of energy generation and services — a diversification that is strategically positive but also indicates that the core automotive segment is no longer the sole driver of the Tesla growth narrative.
The table below combines Tesla’s automotive metrics into a single view for the latest three fiscal years.
Tesla Consolidated Automotive Revenue Metrics 3-Year Averages (FY2023–2025)
| Metric | Average (Latest 3 Periods) |
|---|---|
| Automotive Revenue with Regulatory Credits ($ Millions) | $76,338 |
| Automotive Revenue without Regulatory Credits ($ Millions) | $74,156 |
| Automotive Revenue YoY Growth Rates (%) | -0.3% |
| Automotive to Total Revenue Ratio (%) | 79.1% |
| Automotive Gross Margin with Regulatory Credits (%) | 18.5% |
| Automotive Gross Margin without Regulatory Credits (%) | 16.2% |
| Total Delivery (Vehicles) | 1,744,645 |
| Revenue Per Car ($) | $43,713 |
Automotive Revenue (with and without Regulatory Credits)
More information about Tesla’s automotive revenue is available here: automotive revenue.
Tesla experienced the first decline in automotive revenue in fiscal year 2024, down by 6.5% year-over-year, as shown in the chart above.
Automotive Revenue Average (FY2023–2025)
| Metric | Average |
|---|---|
| Automotive Revenue with Regulatory Credits ($ Millions) | $76,338 |
| Automotive Revenue without Regulatory Credits ($ Millions) | $74,156 |
YoY Growth and Ratio to Total Revenue
Tesla recorded its first automotive revenue decline in a decade during fiscal year 2024, as illustrated in the chart above.
Automotive Revenue Growth & Ratio Average (FY2023–2025)
| Metric | Average |
|---|---|
| Automotive Revenue YoY Growth Rates (%) | -0.3% |
| Automotive to Total Revenue Ratio (%) | 79.1% |
Automotive Gross Margin (with and without Regulatory Credits)
Tesla’s automotive gross margin reached its lowest level of 17.8% in fiscal year 2025, down significantly from its peak level of over 29% measured in fiscal year 2021.
Automotive Gross Margin Average (FY2023–2025)
| Metric | Average |
|---|---|
| Automotive Gross Margin with Regulatory Credits (%) | 18.5% |
| Automotive Gross Margin without Regulatory Credits (%) | 16.2% |
Vehicle Sales and Revenue Per Car
More information about Tesla’s automotive revenue per car is available here: automotive revenue per car.
Tesla’s automotive revenue per vehicle has significantly been on the decline, even though the total sum of automotive revenue has considerably risen, as shown in the chart above.
Vehicle Deliveries & Pricing Average (FY2023–2025)
| Metric | Average |
|---|---|
| Total Delivery (Vehicles) | 1,744,645 |
| Revenue Per Car ($) | $43,713 |
References and Credits
1. All financial figures presented were obtained and referenced from Tesla’s quarterly and annual reports, and update letters published on the company’s investor relations page: Tesla Investor Overview.
2. Flickr Images.
Disclosure
We may use artificial intelligence (AI) tools to assist us in writing some of the text in this article. However, the data is directly obtained from original sources and meticulously cross-checked by our editors multiple times to ensure its accuracy and reliability.
If you find the information in this article helpful, please consider sharing it on social media. Additionally, providing a link back to this article from any website can help us create more content like this in the future.
Thank you for your support and engagement! Your involvement helps us continue to provide high-quality, reliable content.