GM Renaissance Center. Flickr Image.
General Motors (NYSE:GM) automobile business in China has sold more vehicles than any other markets in the world.
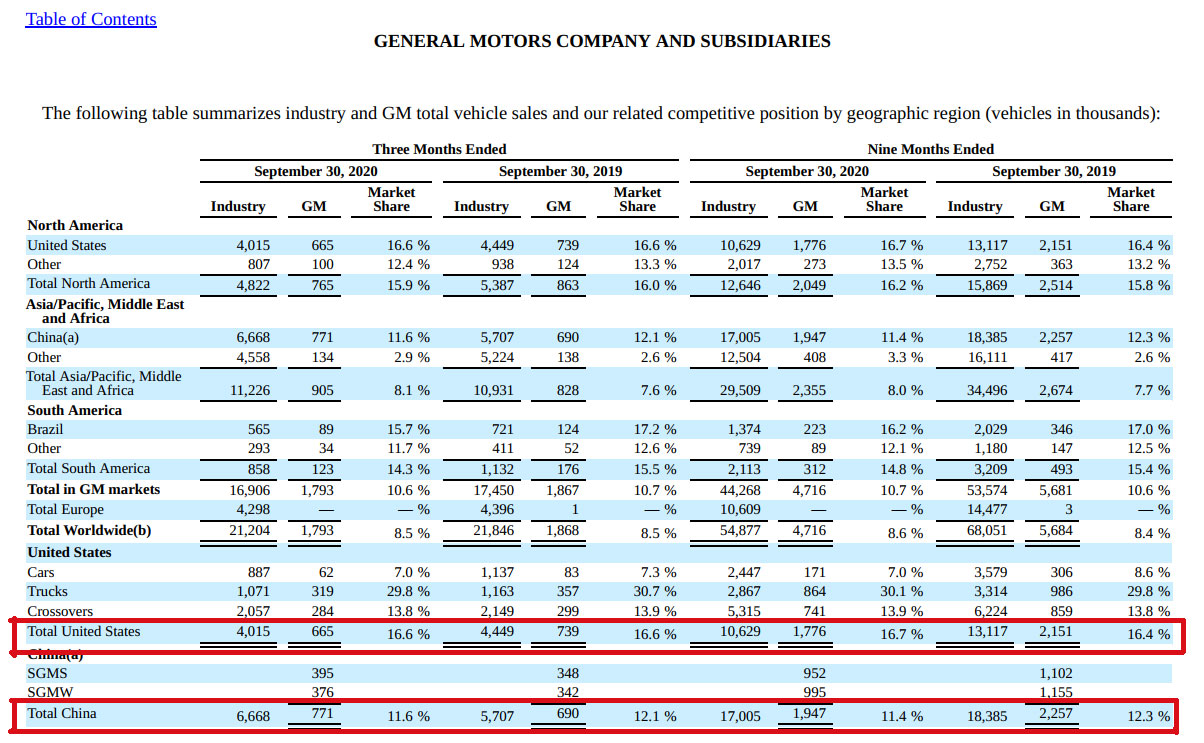
For the period ended on Sept 30, 2020, GM sold a total of 1.95 million vehicles in China alone.
When you compare that figure from other countries, China easily represents GM’s largest market.
The following snapshot shows GM’s total vehicle sales by region.
GM vehicle sales 3Q 2020
As seen from the table above, GM sold roughly 1.78 million vehicles in the United States and only 312,000 vehicles in South America for the 9 months ended on Sept 30, 2020.
In the same table, GM sold slightly more vehicles in China than in America which makes China the largest market for GM in 2020.
GM’s Joint Ventures in China
With millions of vehicles sold in China, you must be thinking that the revenue streams from China would represent GM’s largest revenue source.
The fact is that all the vehicles sold in China did not directly translate to GM sales revenue.
This is due to how GM is doing business in China. When GM first started its automobile business in the Chinese market, it did so through joint ventures with local Chinese companies.
The joint ventures approach has been a requirement for a foreign company to enter the Chinese market. (Source: Wikipedia and the New York Times)
Although GM is allowed to do business in China through joint ventures, the company is doing so without owning more than 50% of all the subsidiaries in China.
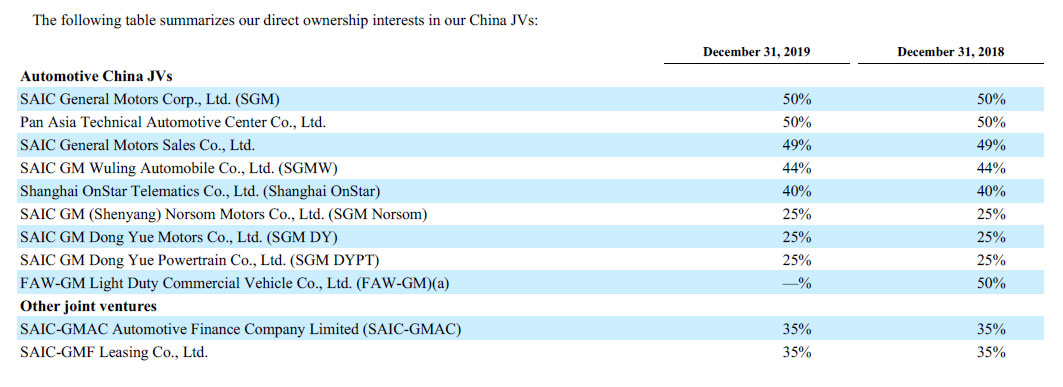
As the following snapshot shows, of all the joint ventures in China, GM owns up to only 50% or less.
GM automotive China joint ventures
The above snapshot was extracted from the Q4 2019 annual filing to show readers the direct interest GM has in China’s automotive joint ventures.
With up to a maximum of only 50% stake, GM has basically no controlling interest in all of the China joint ventures.
Revenue Streams from China
Due to GM not owning more than 50% of its businesses in China, all of the vehicle sales in China does not actually contribute to GM’s coffers in the form of revenue.
However, vehicle sales in China does contribute something to GM in the form of Equity Income.
As pointed out by Investopedia, for joint ventures that are in between 20% and 50% of equity interest, GM recognizes the sales from China joint ventures as something called “Equity Income” in its income statements.
As shown in the following snapshot extracted from GM’s Q3 2020 quarterly filing, GM’s equity income from China totals about $264 million for the 9 months ended on Sept 30, 2020.
GM equity income
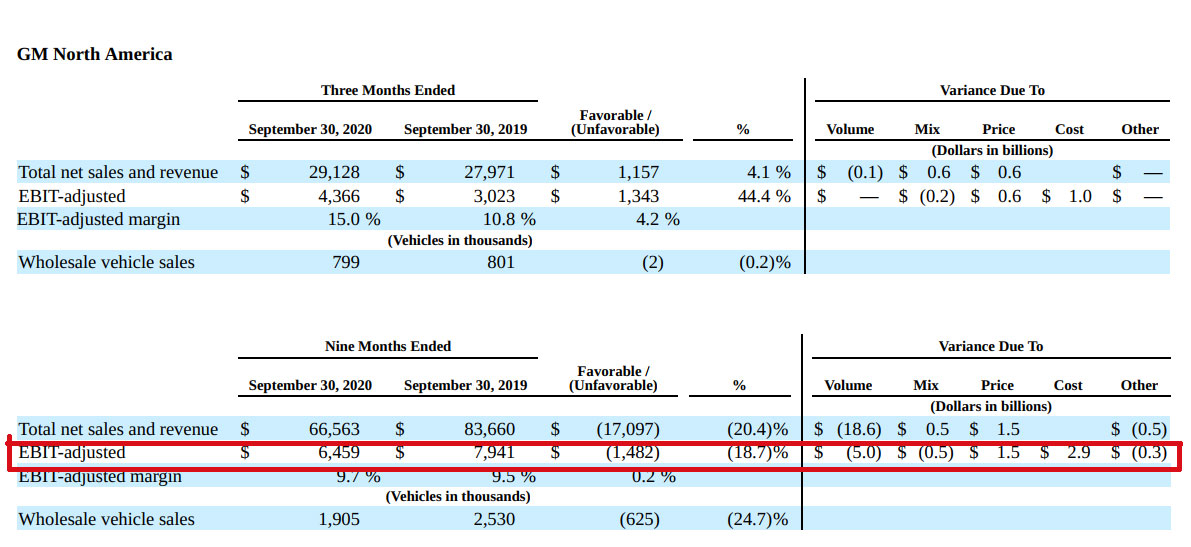
While China contributed over $264 billion of profit to GM in the form of equity income as shown in the snapshot above, GM’s equity income from China was far less than the $6.4 billion adjusted operating income which came largely from the United States.
The following snapshot shows GM’s adjusted operating income that came from North America.
GM North America EBIT (operating income)
In short, GM made only a tiny bit of profit from China despite selling the most number of vehicles there than any other country in the world.
GM’s Largest Revenue Streams
Since China’s automotive joint ventures do not contribute a single dime to GM revenue streams, what makes up GM largest revenue source then?
As mentioned earlier, GM sold about 1.78 million vehicles in the United States of America for the 9 months ended on Sept 30, 2020.
Without doubt, the United States of America contributes the largest stream of revenue to GM’s coffers.
As you will see in the following charts, GM North America (inclusive of USA and Canada) has been the single largest revenue as well as profit contributor to General Motors over the past 5 years.
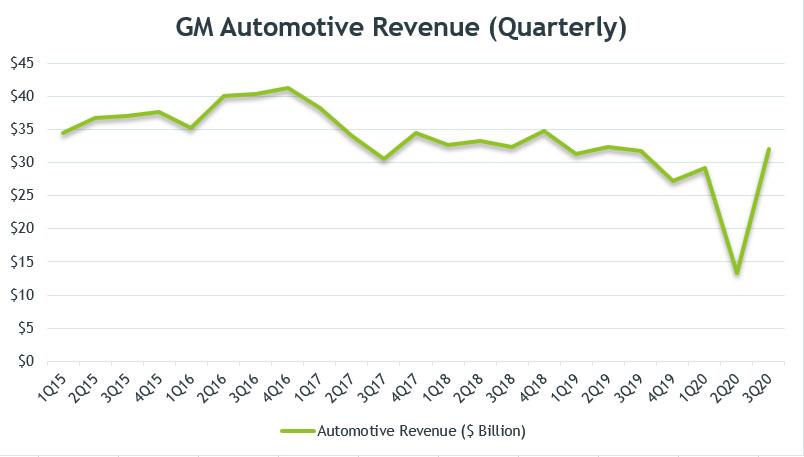
GM’s Automotive Revenue (Quarterly)
GM automotive revenue (quarterly)
The chart above shows GM’s quarterly automotive revenue over the past 5 years from 2015 to 2020.
GM’s automotive revenue plotted in the above chart is the aggregate of multiple revenue streams from such regions as GM North America (GMNA), GM International (GMI), GM Europe (GME) and GM Corporate.
As seen in the chart above, GM’s automotive revenue increased slightly prior to 2017 and reached the highest at $41 billion in 4Q16 but has since declined to only $32 billion as of 3Q 2020 on a quarterly basis.
Automotive revenue remained flat between 2017 and 2020 when GM’s global vehicle sales especially those from North America have trended downward over the past 3 years.
A significant drop in revenue was observed in 2017 when GM sold off its GM Europe subsidiary in the same year.
GM’s automotive sales were seen badly impacted throughout 2020, 2Q 2020 in particular when revenue dipped below $15 billion.
However, the company’s automotive sales quickly recovered in 3Q 2020 from the prior quarter.
In 2020 3Q, GM’s automotive sales totaled as much as $32 billion, representing more than 100% higher than the previous quarter.
On a long-term basis, GM’s automotive revenue was seen declining between 2015 and 2020.
GM’s Automotive Revenue (TTM)
GM automotive revenue (ttm)
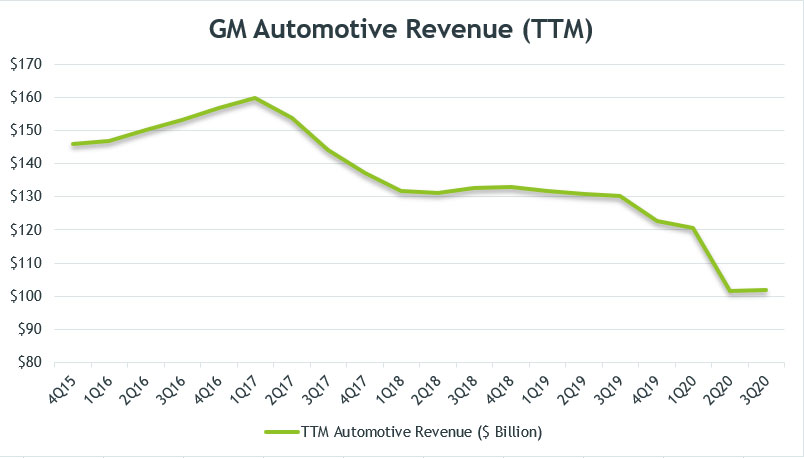
To smooth out the quarterly plot, I created the TTM (trailing 12-months) plot above which clearly shows GM’s automotive revenue trend.
Over the last 5 years, GM’s automotive revenue was seen declining on a TTM basis.
As shown in the chart, the rate of decline for GM’s automotive sales accelerated in 2020, due mainly to the COVID-19 impact.
As of Q3 2020, GM’s automotive sales totaled $100 billion on a TTM basis, which was about the same as the figure in the prior quarter.
If not for the V-shape recovery seen in 3Q 2020, the TTM sales figure would have fallen off the cliff and most likely dipped below the $100 billion thresholds.
GM’s Automotive Gross Margin (Quarterly)
GM automotive revenue gross margin (quarterly)
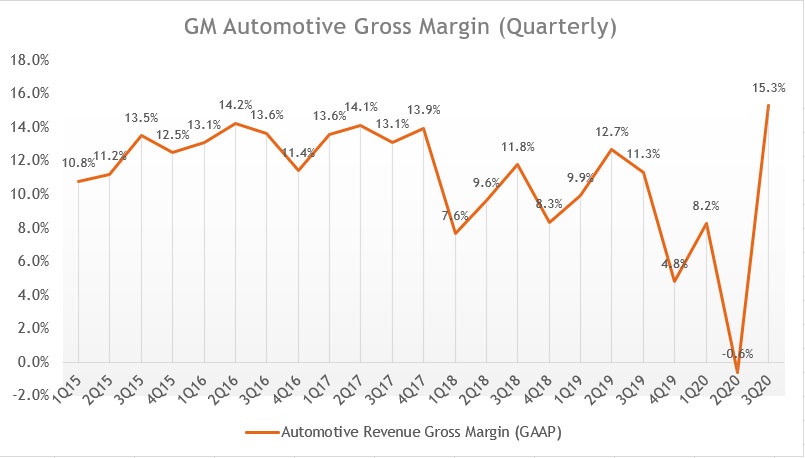
The chart above shows GM’s quarterly automotive gross margin over the past 5 years from 2015 to 2020.
Gross margin is a measure of the profitability of the products. In GM’s case, its automotive gross margin takes into account of the cost of sales while excluding selling, general and administrative (SGA) expenses.
That said, a higher gross margin often means a higher gross profit as a result of higher sale prices and better brand power which in general, commands better pricing power.
Besides, a higher gross margin also indicates efficient resource allocation during the manufacturing stage of the products which usually results in a lower cost of sales.
When we look at the gross margin chart above, GM automotive gross margin has consistently stayed at the 13% level on a quarterly basis from 2015 to 2017.
However, its automotive gross margin declined significantly from 2018 and onwards to roughly 9% on average.
GM’s automotive gross margin improved slightly in 2019 to 10% despite a slumping revenue compared to 2018. The gross margin improvement has been largely due to the restructuring initiative that started in 2017.
As of 3Q 2020, GM’s automotive gross margin recovered and shot up to 15%, a far cry from the -0.6% recorded in the prior quarter.
The improvement in automotive gross margin in 2020 Q3 has been largely attributed to the pent-up demand for GM’s large vehicles, including the medium and large trucks, crossovers and SUVs.
In 2020 3Q, GM’s truck and SUV sales recovered significantly, due mainly to the increased perception that trucks and SUV are safer compared to sedans during the age of a pandemic.
GM’s Automotive Gross Margin (TTM)
GM automotive revenue gross margin (ttm)
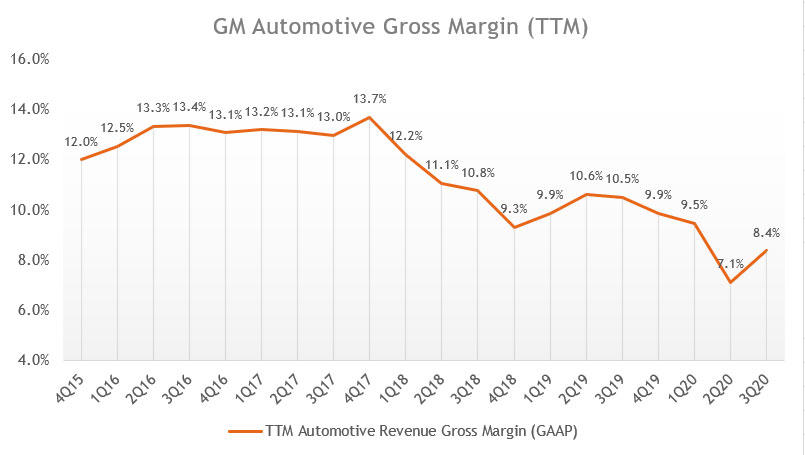
The quarterly gross margin plot may not clearly show the long-term trend of GM’s automotive gross margin.
As such, the TTM plot above is created to smooth out the quarterly plot.
From a TTM perspective, you can clearly see that GM’s automotive gross margin has been on a decline on a long-term basis.
As of 2020 Q3, GM’s automotive gross margin reached only 8.4%, one of the lowest in the past 5 years.
The result in 3Q 2020 would have been much worse if not for the V-shape recovery seen in the same quarter, driven mainly by the pent-up demand for trucks and SUVs.
GM Automotive Revenue Breakdown by Region
GM automotive revenue breakdown by region
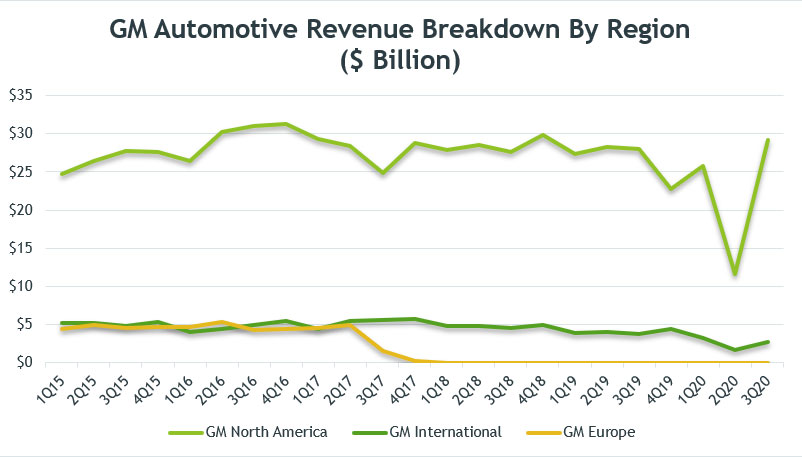
The chart above shows the breakdown of GM automotive revenue into several regions such as the GMNA, GMI and GME.
Without doubt, GM North America (GMNA) took up the lion’s share of automotive revenue, contributing close to 90% of sales at $29 billion to automotive revenue as of Q3 2020.
This was followed by GM International (GMI) which contributed about $2.7 billion of sales to GM’s automotive revenue, making up 10% of GM’s total automotive sales.
Keep in mind that the international sales figure does not recognize any revenue contribution from China as GM does not have a controlling stake in any of the businesses in China.
Although the bulk of automotive revenue came from GMNA, its growth has been flat over the past 5 years.
As seen from the chart, GMNA sales have been fluctuating between the range of $25 and $30 billion, signaling sluggish or no growth in the North American region.
As of 3Q 2020, GMNA’s revenue of $29 billion represents a year over year increase of around 3%. Sequentially, GM managed to increase GMNA revenue by more than 100% from the previous quarter.
GM Europe (GME) was classified as a discontinued operation starting 2Q 2017 and the revenue from GME was not consolidated in the financial statements. GME revenue had ceased to exist by the end of 2017 when GM completed the sale of GME.
Weak demand for GM’s automotive products did not just occur in the North American region. GM International also saw the same trend in which a slumping revenue has occurred for the past 5 years between 2015 and 2020.
GM reported automotive revenue of only $2.7 billion from international regions in Q3 2020 compared to $3.8 billion in the corresponding quarter a year ago, representing a year over year decline of 29%.
However, GM North America sales recovered much faster than its global counterpart, as seen in the year over year growth for its North American region in Q3 2020.
GM Cruise Revenue
GM Cruise revenue
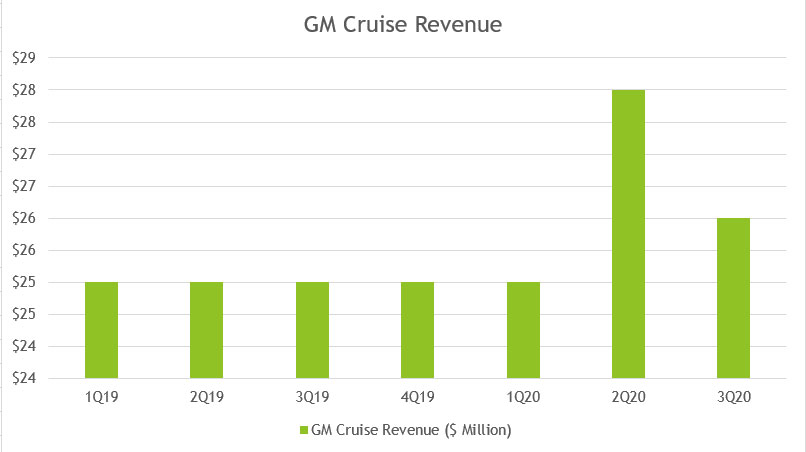
GM Cruise is one of GM’s subsidiaries. However, it is not part of GM’s automotive segment.
According to GM, GM Cruise is responsible for testing and developing its autonomous vehicles in the U.S.
GM Cruise is continuously making significant progress towards the commercialization of a network of on-demand autonomous vehicles in the U.S.
Based on the chart above, GM Cruise does not have much revenue or sales coming from this business segment.
For the past 2 years, GM Cruise has only generated about $25 million in sales on a quarterly basis.
As of 2020 3Q, GM Cruise’s revenue totaled only $26 million, indicating not much significant progress at this figure.
Perhaps, there is still a long way to go for GM Cruise before it can generate a meaningful sales figure in the autonomous vehicle segment.
Ratio of GM’s Automotive Revenue to Total Revenue
GM automotive revenue to total revenue ratio
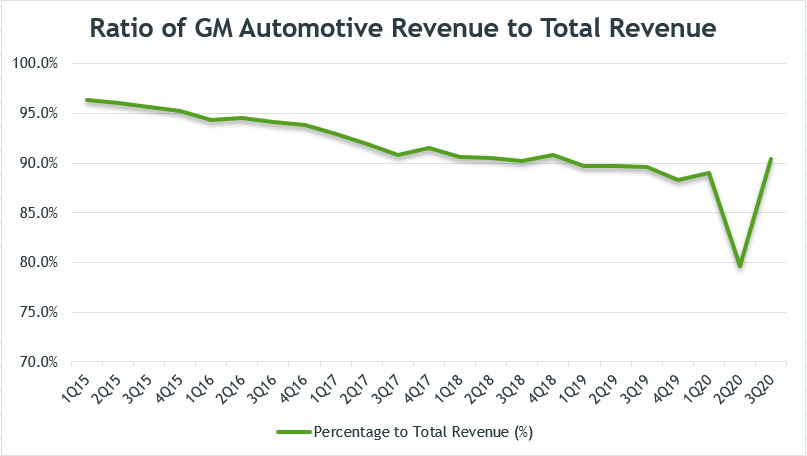
The chart above shows the ratio of GM’s automotive revenue to total revenue expressed in percentage.
I created the chart above to show readers the significant impact of automotive revenue on the company.
As seen in the chart above, automotive revenue took up close to 90% of total revenue in 3Q 2020, making it the largest revenue stream for the company. The rest of the revenue came from GM Financial and other business subsidiaries.
Although automotive revenue contributed to the largest revenue stream to GM coffers, the ratio in the chart above has been decreasing from 2015 to 2020.
As shown, automotive revenue contributed over 96% of total revenue in 1Q 2015 but the figure has dropped to about 90% as of Q3 2020.
The likely reason for the drop could be the declining sales of the automotive segment and the rise of GM Financial revenue streams.
For your information, GM Financial has been one of GM’s most profitable segments although the segment contributed only 10% of revenue to the company.
GM’s Automotive Revenue Sequential Growth
GM automotive revenue QoQ growth rates
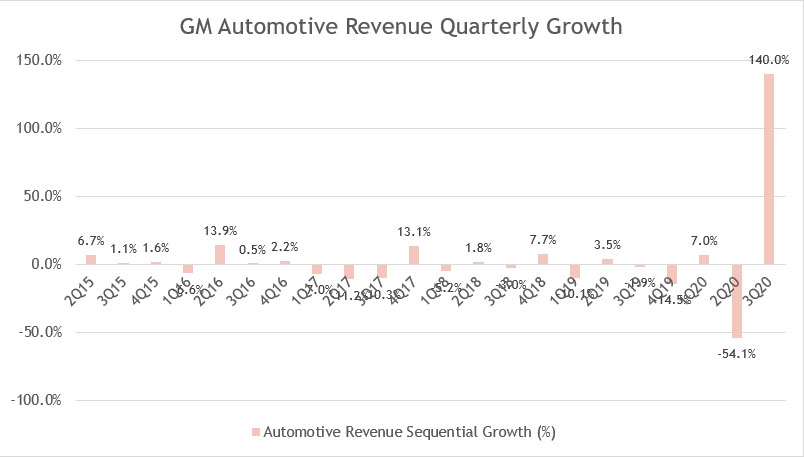
The chart above shows the quarterly growth of GM’s automotive revenue over the past 5 years from 2015 to 2020.
From a spreadsheet calculation which I did not show here, the average quarterly growth rate for the past 24 quarters was roughly 3%, indicating that automotive revenue sequential growth has reported minor increment between 2015 and 2020.
The quarter over quarter growth was the worst in 2017 when automotive revenue decreased by near double digits in 3 consecutive quarters.
Part of that reason was due to GME being disclosed as a discontinued operation which has excluded the earned revenue from this region in the financial statements.
Growth rates had not improved either in 2019 when 3 out of 4 quarters were having negative sequential growth rates.
The 3Q 2020 quarter shows a quarterly growth rate of 140%, driven mainly by the V-shape recovery in large trucks and SUVs demand for GM.
GM’s Automotive Revenue Year Over Year Growth
GM automotive revenue YoY growth rates
The chart above shows the year over year growth rate of GM’s automotive revenue over the past 5 years from 2015 to 2020.
From a spreadsheet calculation, the average yoy growth for the past 19 quarters was around -3.8%, indicating that automotive revenue average year over year growth has declined between 2015 and 2020.
Similar to sequential growth, automotive revenue year over year growth was the worst during 2017 when GM reported 4 consecutive quarters of double digits yoy decline.
In 2019, GM’s automotive revenue yoy growth had turned from bad to worse when year over year decline happened across all quarterly results, with 4Q 2019 quarter being the worst offender when the reported yoy growth rate was -21.8%.
Similarly, GM posted an automotive revenue year over year decline of 59% in 2Q 2020 on the back of extremely weak vehicle demand as a result of the COVID-19 disruption in the automotive sector.
However, the YoY growth rate recovered in 2020 Q3 to 1%. The positive growth rate seen in 2020 Q3 was the first since 2018 when GM recorded a streak of negative YoY growth rates from 2019 to 2020.
Automotive revenue growth is probably over for GM as seen from the chart above. The best growth occurred back in 2016 when revenue growth was seen in 5 consecutive quarters.
Since then, automotive revenue had either slumped or showed little or no sign of recovery.
Conclusion
The fact is that GM’s largest revenue stream came not from China but from the United States of America despite having the most vehicle sales in China in 2020.
Although China contributed the most vehicle sales to GM, those sales were not translated to revenue for the company.
The reason is due to GM not having a controlling interest in all of the automotive joint ventures in China. As such, GM can only recognize these vehicle sales as “equity income” in its income statements.
GM’s equity income from China represents only a small amount of the company’s total operating income in 2020, indicating that GM made only a fraction of the profit despite selling the most cars in China.
Although vehicle sales from the United States of America were only behind that of China in 2020, the North American market contributed the largest revenue stream to General Motors at nearly 90% of total revenue.
References and Credits:
1. Financial figures in the charts above were obtained from General Motors SEC Filings.
2. Featured image was obtained from Ahren and BiERLOS a.k.a. photörhead.ch.
Related articles that you might be interested:
- Comparison of GM and Tesla Automotive Revenue
- GM frequently asked investment questions
- Tracking GM Global Vehicle Deliveries
- Explore GM market valuation from the perspective of its price to sales ratio
- Tracking GM Inventory and Finished Products Inventory
Disclosure
Readers, investors, analysts, bloggers, visitors, researchers, writers, or academicians are highly encouraged to use, copy, quote, distribute, duplicate, modify, edit, upload, download, share and link any materials on this webpage such as the charts, snapshots, texts, paragraphs, etc. You can credit back to this page by a link or a mention of the website. Thanks for sharing!
