Beyond Meat – Beyond Plant-Based Vegan Sausage. Source: Flickr
Beyond Meat’s stock valuation has been getting a lot of attention as of late, possibly due to the surging stock price which has reached more than $150, valuing the company at nearly $10 billion.
Since IPO in May 2019, Beyond Meat’s stock has grown nearly 500%.
At a market value of almost $10 billion, is Beyond Meat’s stock overvalued compared to its historical average?
Let’s zoom in on some of the valuation ratios that we will talk about.
In this article, we will look at Beyond Meat (NASDAQ:BYND) stock valuation from the point of a couple of metrics, including the market cap to revenue ratio (price to sales ratio), market cap to shareholders’ equity ratio (price to book ratio), market cap to gross profit ratio (price to gross profit) and market cap to earnings ratio (price to EBITDA ratio).
I will normally include the market cap to operating cash flow and market cap to net profit ratio when discussing a company’s market valuation.
However, in Beyond Meat’s case, the company has been unprofitable and also generating negative operating cash flow.
For this reason, I have not delved into the discussion of Beyond Meat’s valuation from the point of market cap to operating cash flow and market cap to net profit ratios as these figures are currently negative.
Nevertheless, let’s go take a look.
Beyond Meat’s Valuation Topics
1. Market Capitalization
2. Price to Sales Ratio
3. Price to Book Ratio
4. Price to Gross Profit Ratio
5. Price to EBITDA Ratio
6. Conclusion
Beyond Meat’s Market Capitalization
Beyond Meat’s market capitalization
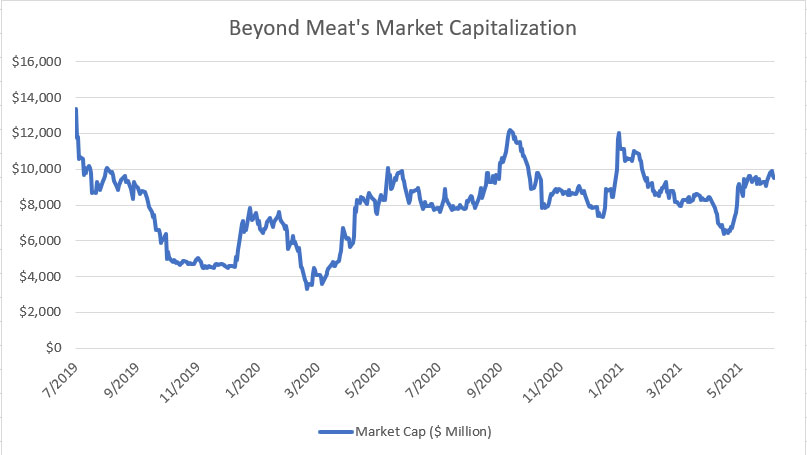
The chart above shows Beyond Meat’s historical market capitalization from 2019 to 2021.
As seen from the chart, Beyond Meat’s market cap has been fluctuating between $4 billion and $12 billion in the last 3 years.
Right after its IPO around July 2019, the company has, at one point, surged past $10 billion and reached as high as $13 billion in market valuation.
However, the company’s extreme $13 billion market cap didn’t last long and its value quickly declined and hit $4 billion by March 2020.
The decline in Beyond Meat’s market cap had also been largely driven by the scare of the COVID-19 pandemic during that period of time.
As of July 2021, Beyond Meat’s current market capitalization hovered around $9.5 billion.
In my opinion, Beyond Meat’s market cap of nearly $10 billion was slightly overvalued and on the high side when you compared it with that of its peers such as Kellogg and Conagra Brands which are also involved in the plant-based protein industry.
For your information, Kellogg was valued at slightly above $20 billion and Conagra was valued at $17 billion as of July 2021, according to Yahoo Finance.
These companies have much better profitability and cash flow generation than Beyond Meat.
Beyond Meat’s Price to Sales Ratio
Beyond Meat’s price to sales ratio
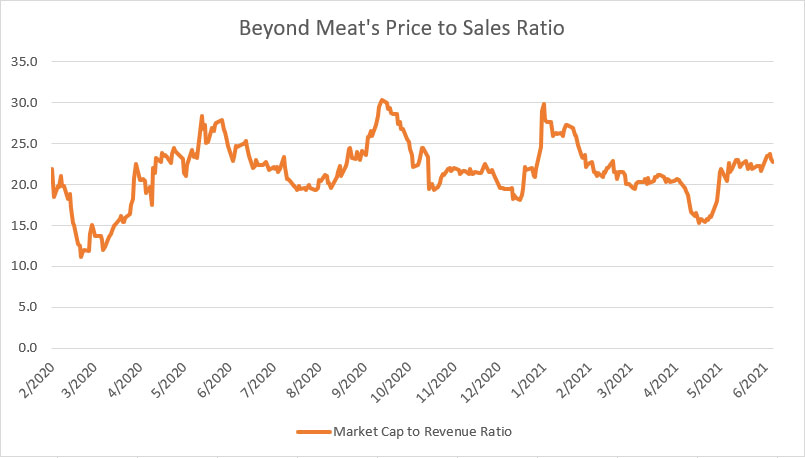
In terms of price to sales ratio, Beyond Meat was valued at about 23X its TTM revenue as of July 2021 as reflected in the chart above.
At a ratio of 23X, Beyond Meat’s stock was trading at about the same level as the average price to sales ratio of 22X.
For the purpose of comparison, Kellogg Company, which operates in the same industry as Beyond Meat, was trading at only 1.6X its trailing 12-month sales.
Conagra Brands’ price to sales ratio was even lower at only 1.5X as of July 2021.
Therefore, Beyond Meat’s stock valuation was relatively at a premium compared to some of its peers despite incurring huge losses and burning loads of cash.
In short, investors are placing a very high expectation on Beyond Meat and betting that the company will perform extremely well going forward.
Beyond Meat’s Price to Book Value Ratio
Beyond Meat’s price to book value ratio
For your information, the book value represents the net worth or the liquidation value of a company.
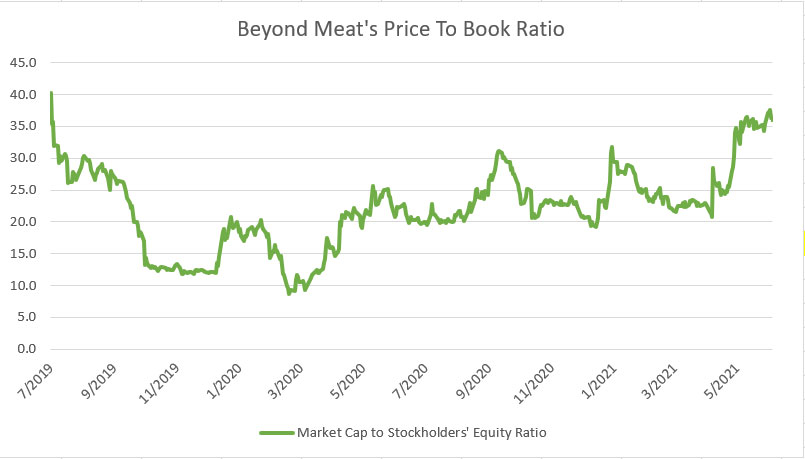
When we look at Beyond Meat’s price to book value ratio as shown in the chart above, the company’s valuation with respect to shareholders’ equity was at a record high of 36X as of July 2021.
Historically, Beyond Meat’s price to book value ratio averages around 23X.
At the current valuation of 36X its book value, Beyond Meat’s stock is valued way above its peers.
For example, Kellogg Company, which operates in the same industry as Beyond Meat, is valued at about 7X its book value.
Besides, Conagra Brands’ valuation was at only 2X its book value as of July 2021.
In short, Beyond Meat’s stock is priced for perfection at this valuation ratio.
Beyond Meat’s Price to Gross Profit Ratio
Beyond Meat’s price to gross profit ratio
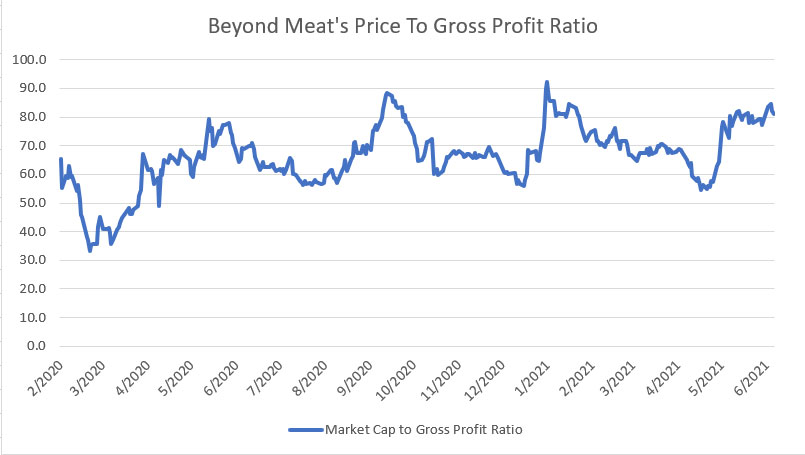
As of July 2021, Beyond Meat’s price to gross profit has risen dramatically to more than 80X, way above its historical average of 65X.
That was a hefty market valuation compared to that of its peers such as Kellogg and Conagra Brands.
For example, Kellogg’s stock was traded at a price to FY2020 gross profit ratio of just 5X during the same period.
Similarly, Conagra Brands’s stock was valued at about the same level as that of Kellogg with respect to its FY2020 gross profit.
Therefore, Beyond Meat’s market valuation was 16 times higher than its peers with respect to trailing gross profit.
Beyond Meat’s Price to EBITDA Ratio
Beyond Meat’s price to EBITDA ratio
The EBITDA represents a form of cash flow and is similar to operating cash flow.
Unlike operating cash flow, EBITDA is measured before changes in working capital.
Therefore, EBITDA is sometimes referred to as cash earnings and is the purest form of cash flow generated by the core operation of a company since it is usually free of any distortion caused by depreciation, amortization, etc.
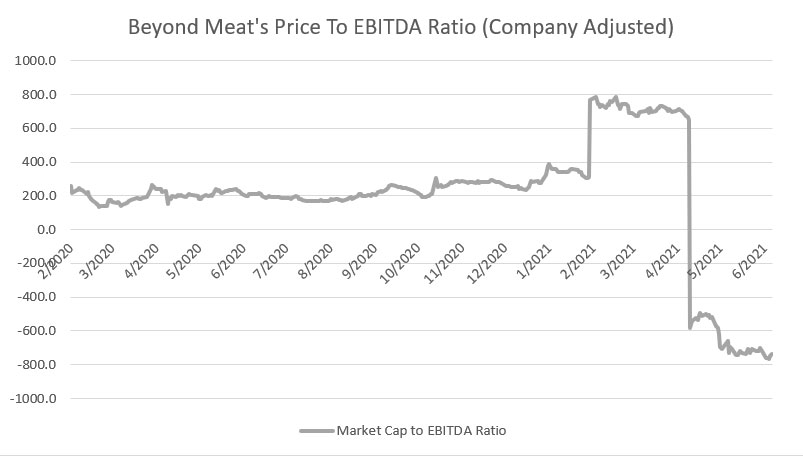
All told, Beyond Meat’s market valuation with respect to EBITDA was negative as of July 2021.
The negative ratio indicates Beyond Meat’s negative EBITDA or negative cash earnings.
Prior to having a negative ratio, Beyond Meat’s price to EBITDA ratio averaged around 200X but jumped significantly higher to nearly 800X in 1Q 2021.
The increasing valuation ratio has been driven primarily by Beyond Meat’s deteriorating EBITDA since the onset of the COVID-19 outbreak.
Post-1Q 2021, Beyond Meat’s EBITDA dived and turned negative when business deteriorated during the COVID age.
While having a negative EBITDA, Beyond Meat’s stock valuation continued to soar, suggesting that investors are betting on a turnaround in Beyond Meat’s fundamentals.
Conclusion
In summary, Beyond Meat’s stock valuation has always been rich in most of the period as shown in all valuation charts, suggesting that investors are expecting the company to significantly outperform in the future.
Additionally, Beyond Meat’s valuation comparisons with that of peers such as Kellogg and Conagra Brands show that the company’s market valuation was way overvalued as of July 2021.
While Kellogg and Conagra Brands may not be a pure player of plant-based meat products, they operate in the same industry as Beyond Meat which is the food packaging industry and they also produce plant-based meat products.
Therefore, the comparison is valid to some extend.
On the other hand, if you are looking for an entry point for Beyond Meat’s stock, there were not many based on historical results.
One example of a good entry point would be the temporary dip of Beyond Meat’s stock in May 2021 to about a $6 billion market cap as shown in most of the valuation charts.
Since then, Beyond Meat’s stock has significantly rebounded and reached $10 billion as of July 2021.
Therefore, if you are going to buy Beyond Meat’s stock, wait for a dip in the stock price such as the one seen in May 2021.
References and Credits
1. Financial figures in all charts were obtained and referenced from BYND Investor Relationship and Yahoo Finance for BYND stock price.
2. Featured images in this article are used under creative commons license and sourced from the following websites: Tony Webster.
Other Statistics That You May Find Helpful
Disclosure
If you find the information in this article helpful, please consider sharing it on social media and also provide a link back to this article from any website so that more articles like this one can be created in the future.
