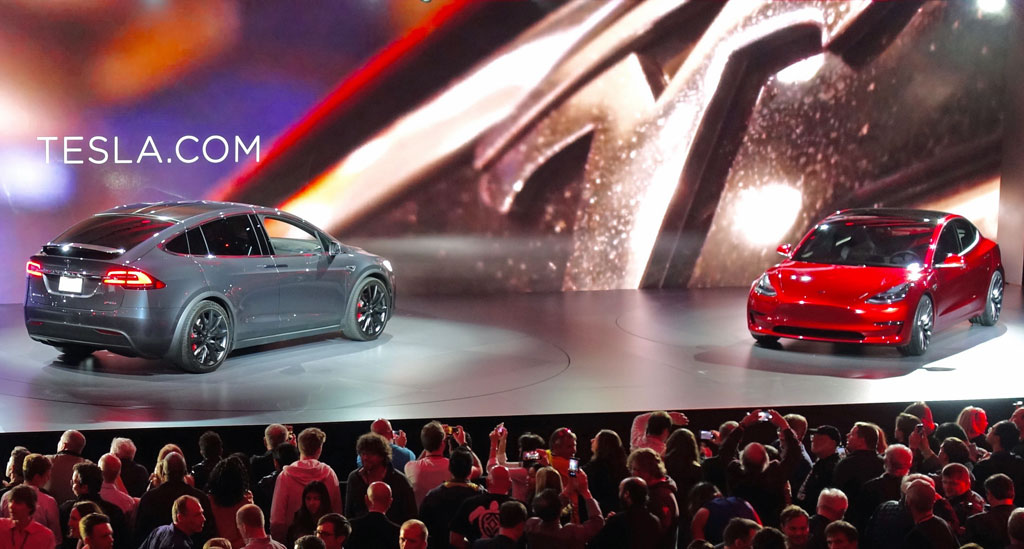
Tesla Model X and Model 3 at an unveiling event. Flickr Image.
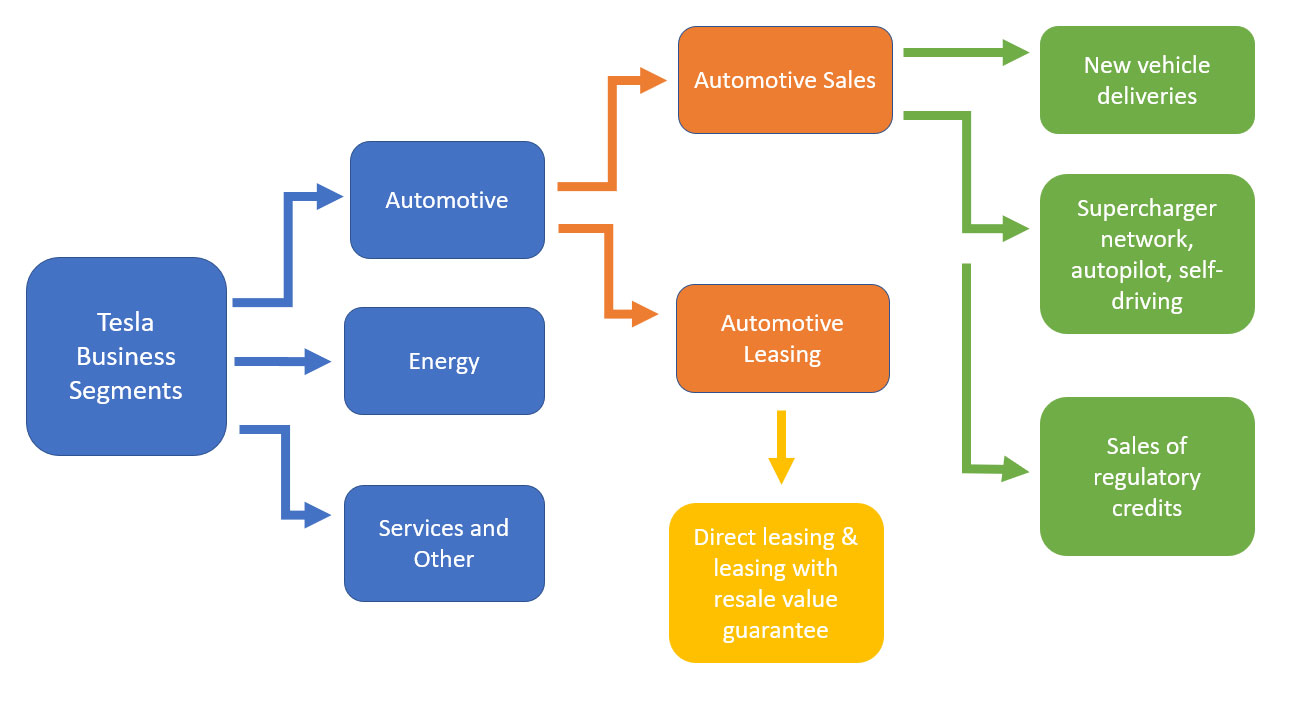
The following snapshot shows Tesla’s 2 major revenue sources that come from the automotive segment and they are: (1) automotive sales, and (2) automotive leasing.
Tesla automotive business segments
The difference between them is explained in the following paragraphs.
The majority of revenue recognized under automotive sales comes from new vehicles deliveries to customers. In addition to new vehicles deliveries, automotive sales also include revenues recognized when features and services such as access to Supercharger network, internet connectivity, autopilot and self-driving capabilities as well as software updates are delivered to customers.
Moreover, automotive sales revenue also includes the sales of Tesla’s regulatory credits.
On the other hand, automotive leasing are revenues recognized under Tesla direct leasing program and leasing with resale value guarantee and buyback options. Under direct leasing, Tesla offers all vehicles models for leasing and customers can return these vehicles or may opt to purchase them for a pre-determined residual values at the end of the lease term.
For leases with resale value guarantee and buyback option, these transactions are more or less similar to direct leasing program and all revenues under these programs are recognized as automotive leasing revenue.
Before diving into the topic of gross margin, let’s take a look at the revenue history over the past 5 year.
I have created a few charts below that compare the revenue of automotive sales and automotive leasing.
Tesla Automotive Sales vs Automotive Leasing Revenue
Tesla automotive sales revenue
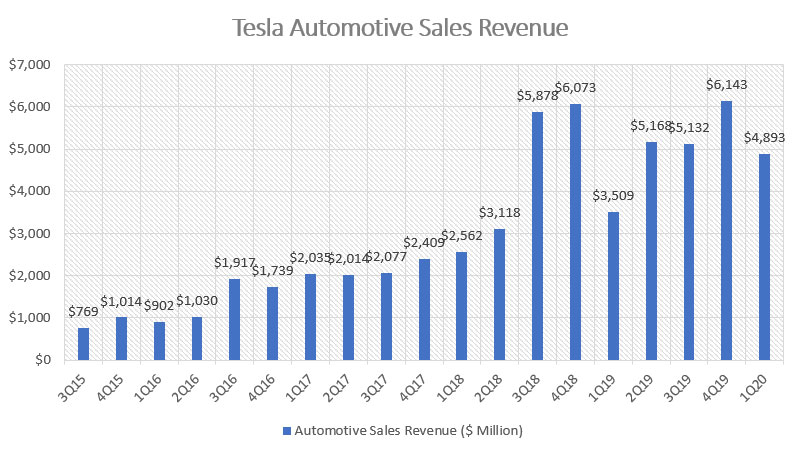
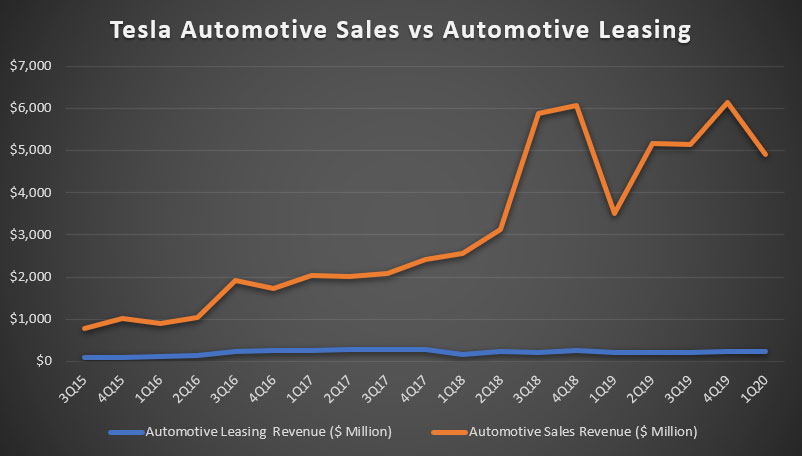
The first chart shows Tesla quarterly automotive sales revenue from 2015 to 2020. As seen from the chart, automotive sales revenue has basically been growing tremendously for the past 5 years and hit record high of $4.9 billion in Q1 2020. The latest Q1 revenue was the highest among all Q1 quarterly results and represents a year over year growth of as much as 40%.
The remarkable growth of automotive sales revenue occurred primarily between 2018 and 2020 when Tesla was ramping the Model 3 production and deliveries.
Moreover, the significant automotive sales revenue growth in recent years represents only the tip of the iceberg for the company as Tesla already has a plan to expand its line of products and that includes the mass production of Model Y which has already been launched and is expected to be delivered by the end of 2020 or early 2021 as stated in its website: Model Y FAQ.
Tesla automotive leasing revenue
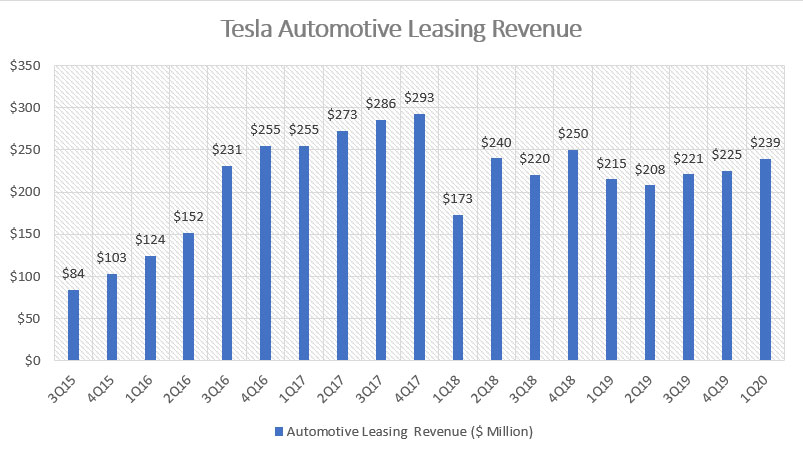
The second chart above shows Tesla quarterly automotive leasing revenue from 2015 to 2020. Compare to automotive sales, automotive leasing revenue does not grow as remarkable as automotive sales. In fact, if you have noticed, the highest revenue that automotive leasing was able to reached was only $300 million which was reported in Q4 2017. After that, automotive leasing revenue began to decline slightly since 2018, primarily due to the company adoption of new revenue standard related to leasing revenue as shown in the snapshot below.
Tesla leasing revenue accounting standard
What happened was that some leasing revenue was reclassified to automotive sales revenue starting 2018 when the adoption of new revenue standard took effect in Q1 2018.
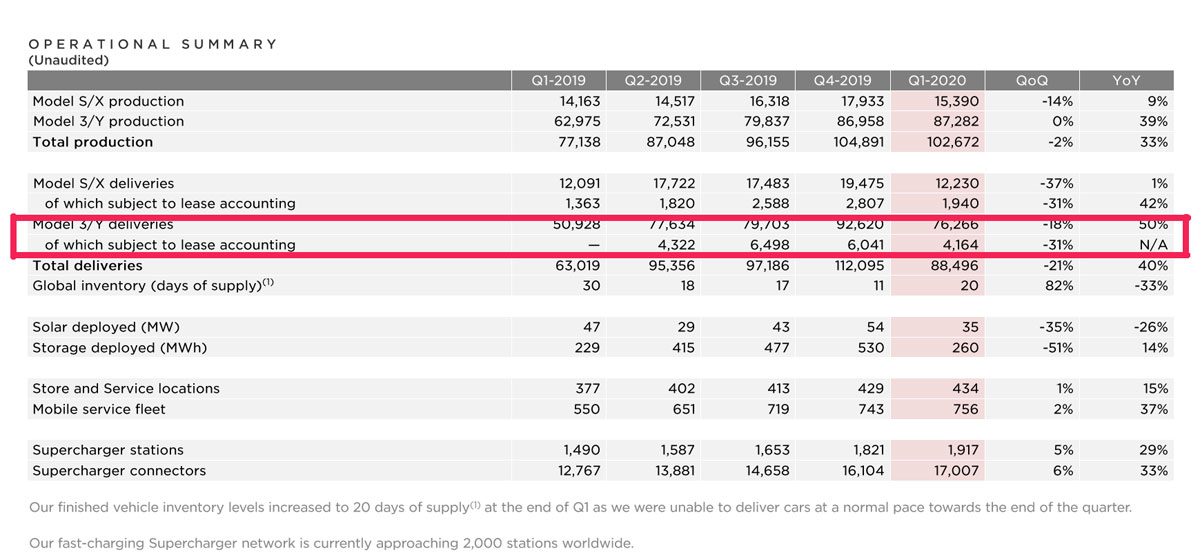
Although 2018 ended with the success of Model 3 record delivery, automotive leasing revenue remained more or less flat. One reason was that Model 3 leasing has only started in Q2 2019 as shown in the snapshot below.
Tesla Q1 2020 update
On top of this, there is a lack of new automotive products for leasing. The existing leasing revenue mainly came from Model X and Model S in which they are not intended for mass production. For the reasons discussed, automotive leasing has not been able to take off like what the automotive sales has done.
Nevertheless, automotive leasing was still able to grow off its record low of $173 million in Q1 2018 to around $239 million in Q1 2020, representing a year over year growth of more than 10%.
Moreover, automotive leasing revenue has been growing steadily since the start of the Model 3 leasing program which occurred in Q2 2019. From the current chart above, we can see that leasing revenue has improved slowly from around $200 million in 2Q 2019 to $239 million in 1Q 2020, representing 3 consecutive quarters of sequential growth since 2Q 2019.
Tesla’s Automotive Sales and Leasing Comparison
Tesla automotive sales vs leasing revenue
When i combined both automotive sales and automotive leasing revenue into a single chart above, the difference in terms of absolute value is very obvious. From a dollar to dollar comparison, automotive sales is the clear winner, outgrowing its counterpart by more than 20X as of 1Q 2020.
Besides, the automotive sales plot shows that the curve has been trending upward whereas the automotive leasing plot is kind of flat over the shown period. Also, you can see from the comparison in the chart that most growth in automotive sales occurred in 2018 when the delivery of Model 3 was at record high.
Although automotive sales has outperformed automotive leasing by several miles, if it does not make any profit, it’s useless. As such, I have created the following chart that compares the profitability of both revenue segments from the perspective of gross margin.
The gross margin basically measures the profitability before other expenses such as research and development (R&D), sales, general and administrative (SGA) costs are accounted for. With this in context, the higher the gross margin, the higher the gross profit the company can derive from the products.
Therefore, let’s take a look at the gross margin of both automotive sales and automotive leasing in the chart below.
Gross Margin: Automotive Sales vs Automotive Leasing
Tesla automotive sales vs leasing gross margin
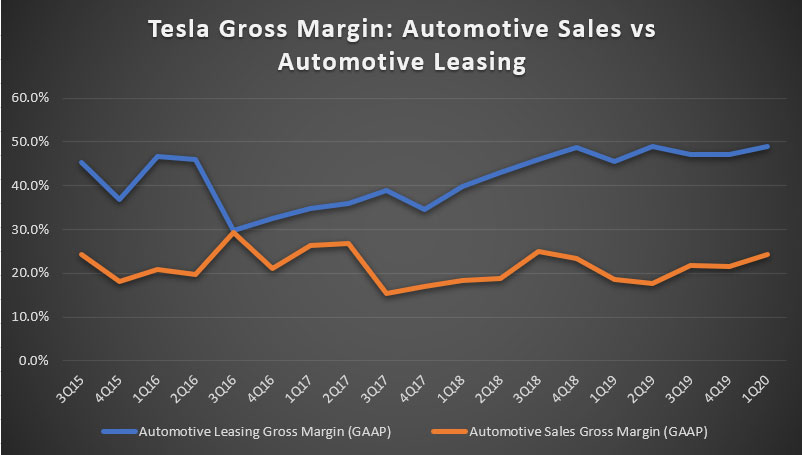
The plot above shows that automotive leasing gross margin has almost always been higher compared to automotive sales throughout the shown period. In fact, automotive leasing gross margin has been trending upward since 2016 and reached record high at close to 50% as of 1Q 2020.
On the other hand, automotive sales gross margin has remained at the 20% level between 2016 and 2020. As of 1Q 2020, Tesla’s automotive sales revenue gross margin ticked up to 24% which represents an increase of as much as 5% compared to the same quarter a year ago.
In 1Q 2020, Tesla’s automotive leasing was as much as 2X more profitable than automotive sales revenue as reflected from the 50% gross margin in leasing revenue as opposed to only 24% gross margin in automotive sales revenue. At 50% gross margin, the automotive leasing business generated a gross profit of $0.50 for every $1.00 of leasing revenue compared to only $0.24 of gross profit for automotive sales.
For this reason, automotive leasing is much more profitable than automotive sales.
I do not exactly know the reason for the higher margin for leasing revenue. My best guess is that it has something to do with the ownership of leased vehicles. Leased vehicles are recognized as asset in the balance sheet for Tesla. As such, Tesla retained the ownership of the leased vehicles and recognized a residual value by the end of the lease term.
As a result, the depreciation expenses for the leased asset may be lower compared with the cost of revenue for vehicle sales because of the residual value in the leased asset.
Another reason could be due to the higher leasing revenue for leased vehicles. Here is an article that talks about the high prices of leasing a Tesla vehicle: Tesla leased vehicles price.
In short, for a Model S that has a retailed price of $94k, a 3-year and 36k-mile lease in California can set you back by roughly $62k within just 3 years. That’s because of the high down payment of $8k and a monthly lease payment of $1.5k.
In summary, a combination of accounting practices and a higher leased price has made automotive leasing to be much more profitable than automotive sales.
Conclusion
Automotive sales revenue has reached nearly $5 billion whereas automotive leasing revenue was not even near the $500 million threshold as of 1Q 2020. Both revenue segments are showing positive growth but automotive sales has been growing more aggressively compared to automotive leasing.
Although automotive leasing grew at only a fraction of the growth rate of automotive sales, its gross margin was twice as much as that of automotive sales as reflected in the 1Q 2020 quarterly result, indicating that the automotive leasing business is a very high margin and profitable business segment.
References and Credits
1. Financial figures in all charts and snapshot were obtained and referenced from Tesla Quarterly Results.
2. Featured image was used under Creative Common Licenses and obtained from Steve Jurvetson.
Related articles that you might be interested:
- Ratio of Tesla operating expenses to revenue
- Ratio of Tesla inventory to revenue
- Ratio of Tesla trade receivable to sales
- Tesla cash flow analysis
- General Motors total inventory and finished products inventory analysis
Disclosure
Readers, investors or visitors are free to use, copy, quote, distribute, modify, edit, share and link any materials in this webpage such as the charts, snapshots, texts, paragraphs and so on. All you need to do is provide credits such as a link or mention the name of this website.
