A Tesla Model S cruising on a highway. Flickr Image.
As an investor myself, I am always interested in not only the operating costs of a company but also want to know how the costs have changed with respect to revenue.
To this end, the operating costs over revenue or sales ratio will do the job just fine.
From the operating cost over revenue ratio, investors can observe the trend of the ratio, whether increasing or decreasing over a certain period of time.
An increasing trend of the ratio may imply that costs of operation have gone out of control.
On the other hand, a decreasing trend of the ratio is almost always preferable as it indicates a growing revenue or sales but at a manageable operating cost.
For Tesla, the cost to sales ratio is the perfect metric to measure expenses against revenue as the company carries growing operating expenses while still expanding revenue healthily.
But just how rapidly Tesla’s sales have been growing with respect to operating costs.
And this is what we are going to find out in this article.
For your information, Tesla’s operating expenses are made up of R&D, SGA and restructuring expenses.
For a detailed breakdown of Tesla’s operating costs, please visit this article: Tesla’s operating expenses breakdown in 2021.
This article focuses mainly on Tesla’s operating costs and the growth rates and compares Tesla’s operating costs with respect to revenue growth.
Without further ado, let’s take a look!
Tesla Operating Costs Topics
1. Operating Costs By Quarter
2. Operating Costs By TTM
3. Operating Costs To Revenue Ratio – Quarterly
4. Operating Costs To Revenue Ratio – TTM
5. Operating Costs Vs Sales Growth
6. Summary
Tesla’s Operating Costs (Quarterly)
Tesla’s operating costs by quarter
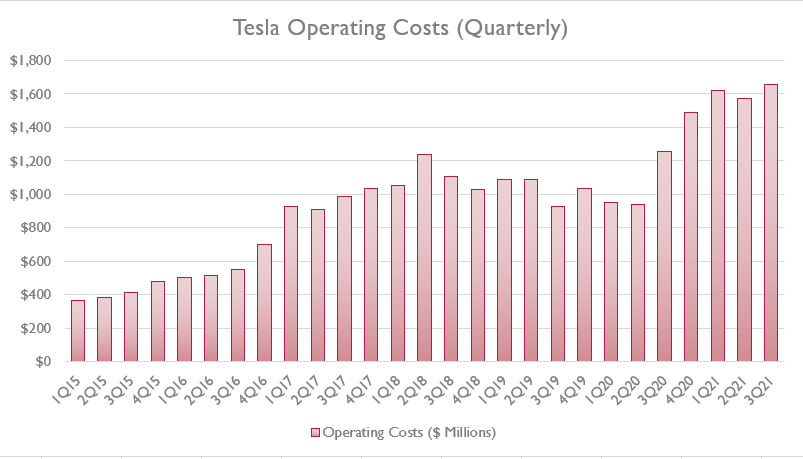
Let’s have a quick look at Tesla’s quarterly operating costs for the period from fiscal 2015 to 2021 as shown in the above chart.
As seen from the chart, Tesla’s operating costs have gone up quite significantly over the last 6 years.
Tesla’s quarterly operating costs were less than $400 million per quarter in fiscal 2015.
The respective figures have gone beyond $1.6 billion per quarter as of 2021, and they have been setting new records in every quarter during fiscal 2021.
As of Q3 2021, Tesla reported an operating cost that came in at $1.66 billion, a new high for the company.
The Q3 2021 result represents a growth rate of more than 30% from a year ago.
Tesla’s Operating Costs (TTM)
Tesla’s TTM operating costs
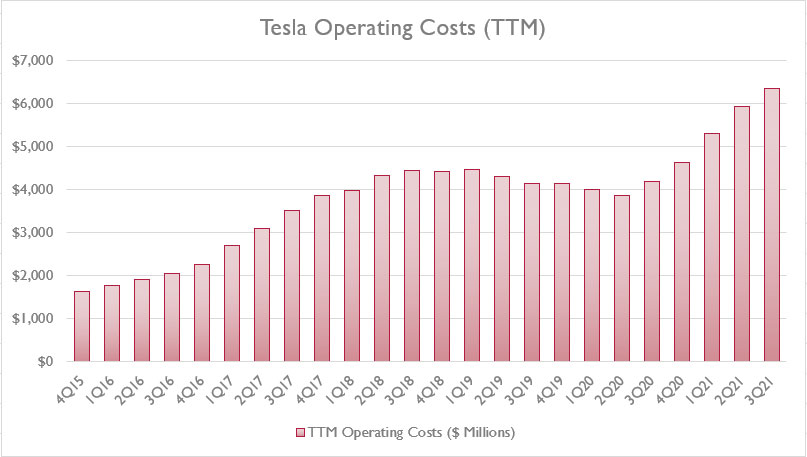
The TTM plot above pretty much got rid of all the bumps seen in the quarterly plot.
Therefore, the TTM plot presents a much clearer and smoother long-term trend of Tesla’s operating costs.
On a TTM basis, Tesla’s TTM operating costs have, indeed, been rising since fiscal 2015.
However, Tesla’s TTM operating costs have declined slightly between fiscal 2019 and 2020.
Going into fiscal 2021, the TTM figures ticked higher again and the rate of increment in fiscal 2021 seems to be the steepest.
As of 2021 3Q, Tesla’s TTM operating costs breached the $6 billion mark for the 1st time, reaching as much as $6.3 billion USD!
The Q3 2021 TTM result represents a year-on-year growth rate of more than 50%.
Looking at only the operating costs may not tell us about the big picture of Tesla’s operating costs.
In the following chart, we will dive into the ratio of Tesla’s operating costs over revenue or sales ratio.
Let’s get to it!
Tesla’s Operating Costs To Revenue Ratio (Quarterly)
Tesla’s operating costs to revenue ratio by quarter
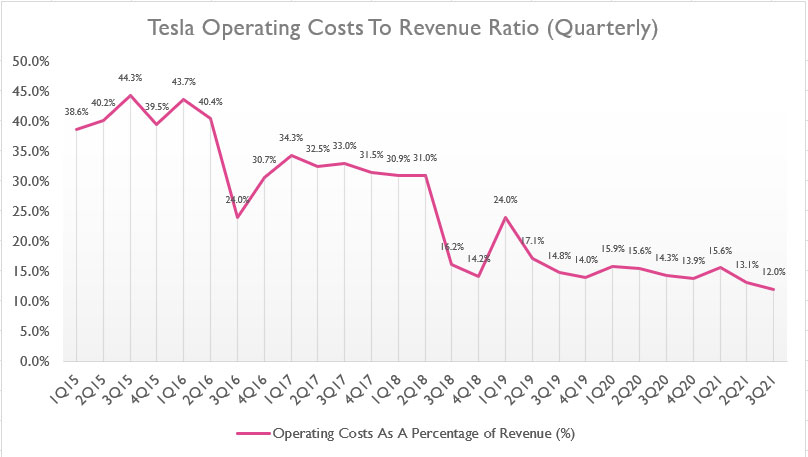
As mentioned, the operating cost to revenue ratio measures the rate of change of Tesla’s operating cost with respect to sales.
A lower ratio indicates better results.
That said, according to the chart, Telsa’s quarterly operating costs to revenue ratio has been declining over the shown period.
Between fiscal 2015 and 2016, the ratio fluctuated around 40%.
However, from fiscal 2016 and onward, Tesla’s ratio started to plunge.
As of 2021 3Q, Tesla’s operating costs to sales ratio further declined and reached around 12%, a record low in the last 6 years.
The decreasing trend of the ratio implies that Tesla’s operating costs grew at a much slower pace than sales have grown.
In other words, Tesla has been managing its operating costs quite efficiently with respect to revenue.
Tesla’s Operating Costs To Revenue Ratio (TTM)
Tesla’s TTM operating costs to revenue ratio
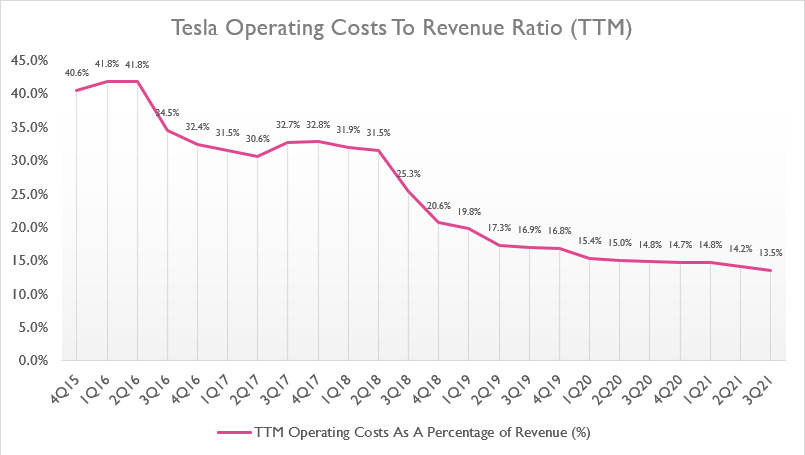
From a TTM perspective, the decreasing trend is much more obvious.
As of 3Q 2021, Tesla’s operating costs to sales ratio reached only 13.85%, a record low since fiscal 2016.
Again, the decreasing trend of the ratio implies that Tesla’s sales have outgrown the respective operating costs at much faster rates.
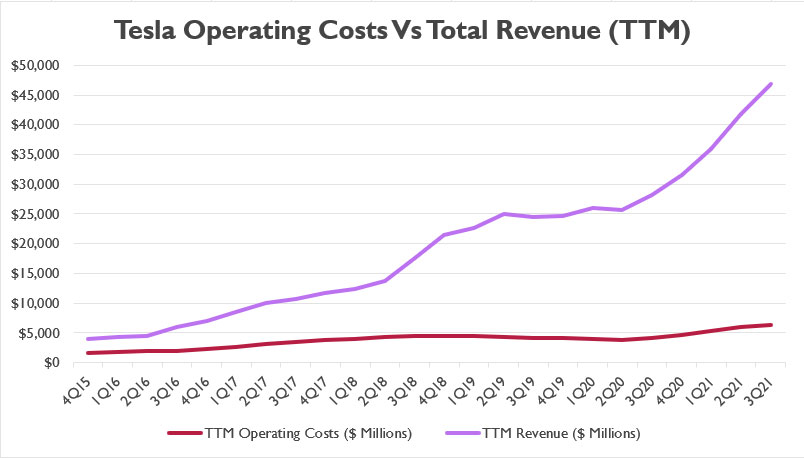
Tesla’s Operating Costs Vs Sales (TTM)
Tesla’s operating costs vs. revenue growth
In terms of dollar-to-dollar comparison, Tesla’s total revenue grows much faster as seen in the chart above.
Additionally, the gap between revenue and operating costs is growing exponentially.
As of fiscal Q3 2021, Tesla’s total revenue was more than 7.0X higher than the respective operating costs on a TTM basis.
Moreover, Tesla’s operating costs look relatively flat with respect to total revenue over the shown period in the chart.
Conclusion
In fiscal Q3 2021, Tesla’s operating costs breached $1.6 billion from a quarterly perspective and $6 billion from a TTM perspective.
The Q3 2021 result represents a 30% increase from a year ago or more than a 50% increase on a TTM basis.
While Tesla’s operating costs have risen drastically over the years, the company’s revenue growth is much faster.
As such, Tesla’s operating costs to revenue ratio has been on a decline and reached only 12% and 13.5%, respectively, on a quarterly and TTM basis as of fiscal 3Q 2021, a record low for the company.
All in all, the results bode well for not only the company but also for shareholders as they show that sales are growing at a much faster pace than operating costs.
Other Stock Statistics That You May Enjoy
References and Credits
1. All financial figures in this article were obtained and referenced from Tesla’s financial statements available in Tesla SEC Filings.
2. Featured images are used under Creative Common License and are obtained from Automotive Rhythms and voyagevixen2.
Disclosure
The content in this article is for informational purposes only and is neither a recommendation nor a piece of financial advice to purchase a stock.
If you find the information in this article helpful, please consider sharing it on social media and also provide a link back to this article from any website so that more articles like this one can be created in the future. Thank you!
