Dave and Buster’s amusement park. Source: Flickr Image
Dave and Busters was founded in 1982 and is headquartered in Dallas, Texas.
As of fiscal Q4 2020, Dave and Busters owns and operates 141 stores located mainly in the North American region.
Dave and Busters was a highly profitable business and made over $100 million USD annually prior to the COVID-19 pandemic.
However, the company’s profitability came crashing down during the COVID time and incurred heavy losses that totaled more than $200 million as of fiscal 2020.
In this article, we will take a look at a couple of Dave and Buster’s profitability metrics, including the gross profit, operating profit, net income, earnings per share and other non-GAAP measures derived by the company.
Let’s not wait!
Dave and Buster’s Profitability Topics
1. Revenue Breakdown
2. Gross Profit Breakdown
3. Operating Income
4. Net Income
5. Earnings Per Share
6. Adjusted Operating Income
7. Adjusted EBITDA
8. Summary
Dave and Buster’s Revenue Breakdown
Dave and Buster’s revenues breakdown
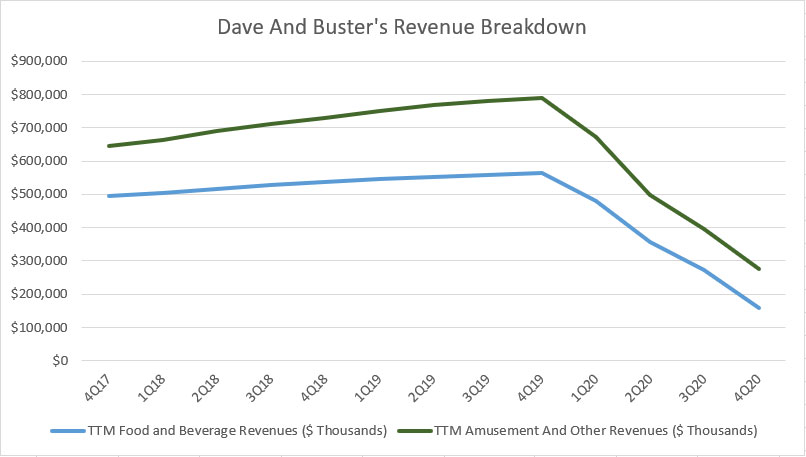
Let’s first look at Dave and Buster’s revenue by segment for the period between fiscal 2017 and 2020.
For your information, Dave and Buster’s revenue are divided into 2 main segments, and they are Food and Beverage and Amusement and Other.
As seen from the chart above, Dave and Buster’s revenues for both segments had been on an increasing trend prior to fiscal 2020.
In fiscal 4Q 2019, Dave and Busters reported record revenues of $790 million and $560 million for Amusement and Other and Food and Beverage, respectively.
However, Dave and Buster’s revenues started to come down significantly throughout fiscal 2020 and reached only $277 million and $160 million for Amusement and Other and Food and Beverage, respectively, by the end of fiscal 2020.
Within a period of only 1 year, Dave and Busters has lost up to 70% of its sales in fiscal 2020 compared to the prior year, driven mainly by the mandatory store closure triggered by the COVID-19 outbreak.
Dave and Busters had shut down 100% of its stores sometime in fiscal 2020 when the pandemic was at its worst in North America.
Dave and Busters even cast doubt on its ability to continue operating in the 2Q 2020 filings if the enforced mandatory shutdown would persist for the rest of the year.
Now, you can see how badly Dave and Buster’s businesses had been affected by the outbreak.
Dave and Buster’s Gross Profit Breakdown
Dave and Buster’s gross profits breakdown
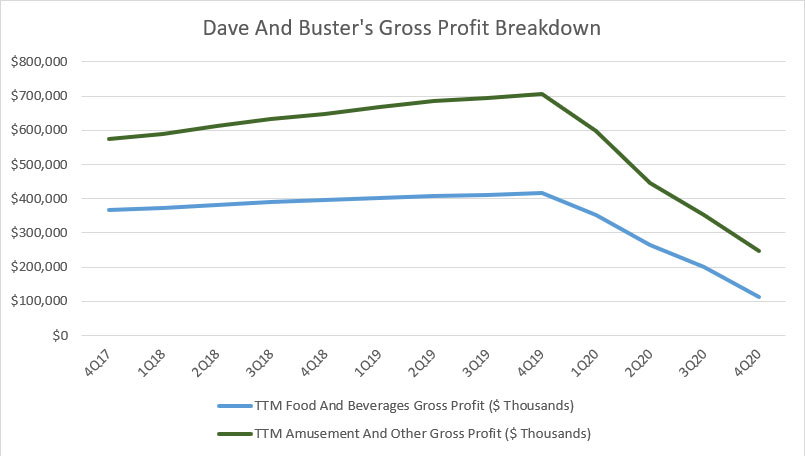
Similarly, in terms of gross profit, Dave and Busters was seeing the same crash in fiscal 2020, with gross profits tumbling to only $247 million and $114 million on a TTM basis for Amusement and Other and Food and Beverage, respectively, by the end of the fiscal year.
Prior to 2020, things were going so well for Dave and Buster’s when the respective gross profits for both segments hit record highs of $700 million and $415 million, respectively, in fiscal Q4 2019.
However, at a drastic turn of an event, Dave and Buster’s gross profits plunged to an all-time low in fiscal 4Q 2020.
Dave and Buster’s Operating Income
Dave and Buster’s operating income
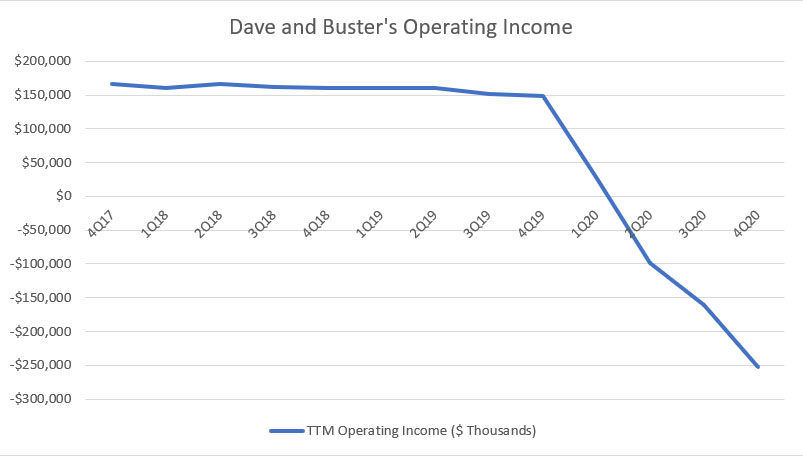
From an operational perspective, Dave and Busters was incurring losses in fiscal 2020 4Q at -$250 million after accounting for operating expenses, including payroll, store expenses, SGA and depreciation as well as amortization expenses.
Prior to COVID time, Dave and Buster’s operating income averaged slightly above $150 million on a TTM basis.
While the company was profitable before COVID time, its operating income was seen slowly declining despite having a rising gross profit for both operating segments, suggesting that rising operating costs may have taken a toll on Dave and Buster’s operating income over the years.
Dave and Buster’s Net Income
Dave and Buster’s net income
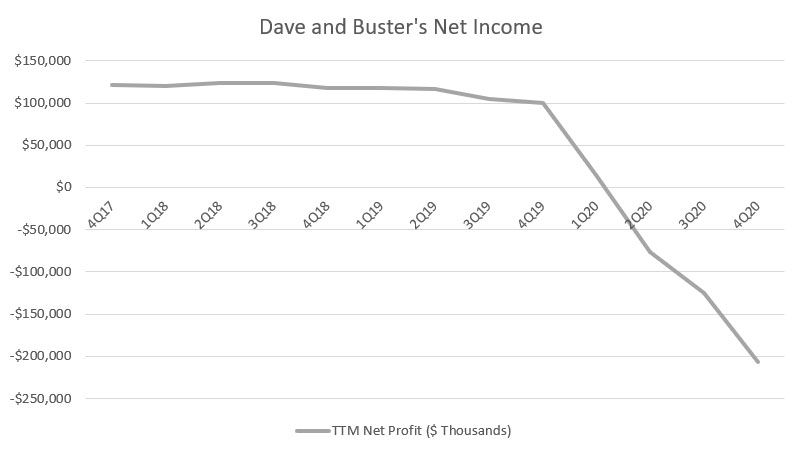
Dave and Busters also saw a similar trend for its net income or net profit.
As of fiscal 2020 4Q, Dave and Buster’s net income reached as low as -$207 million on a TTM basis, illustrating the company’s increasing net losses throughout fiscal 2020.
Similarly, Dave and Buster’s net profits were seen slowly declining between fiscal 2017 and fiscal 2019 despite having rising revenues as well as gross profits for both operating segments.
Dave and Buster’s declining profits over the years may have been caused by its rising interest expenses during the same period.
Other than having a substantial amount of operating cost, Dave and Busters also has been incurring a rising interest expense since fiscal 2017, driven mainly by the company’s increasing indebtedness.
As of fiscal 2020, Dave and Buster’s interest expenses totaled $37 million, a record high since fiscal 2017.
Dave and Buster’s Earnings Per Share
Dave and Buster’s earnings per share
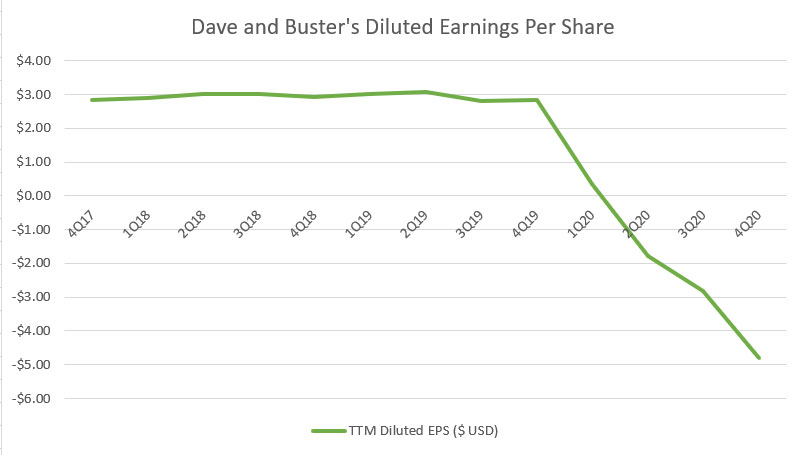
Dave and Busters used to make a profit of $3.00 USD per share prior to COVID time.
As of fiscal 2020 Q4, Dave and Buster’s EPS reached nearly -$5.00 on a TTM basis, illustrating the heavy losses per share the company has incurred.
For your information, Dave and Busters had bought back its common stocks prior to fiscal 2020.
Cumulatively, Dave and Buster had spent nearly $600 million since fiscal 2017 to buy back its common stocks.
Despite spending more than half a billion dollars on share buybacks since fiscal 2017, Dave and Buster’s earnings per share were seen remaining flat and nowhere to be increasing.
My opinion is that this money should have been better spent on expansion and investment instead of on share buyback when Dave and Buster’s stock prices were at record highs during the buyback period.
On the contrary, Dave and Busters should be buying back its stocks when it hit record bottom during the height of the COVID-19 pandemic.
Dave and Buster’s Adjusted Operating Income
Dave and Buster’s adjusted operating income
Dave and Busters uses some non-GAAP metrics to measure the company’s performance.
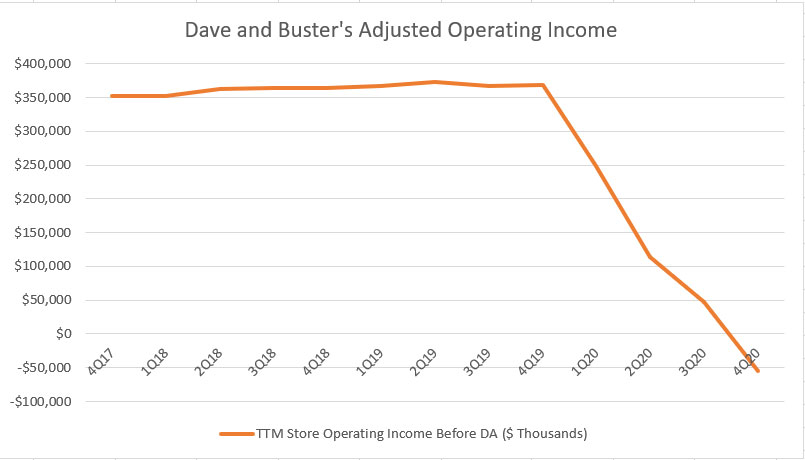
One of these metrics is the adjusted operating income or store operating income before depreciation and amortization as the company calls it.
The adjusted operating income is similar to the GAAP operating income except for certain expenses in which according to the company, are non-recurring and have nothing to do with the operating performance of the businesses.
These non-cash expenses are excluded during the measurement of the adjusted operating income.
In Dave and Buster’s case, the expenses excluded include general and administrative expenses, depreciation and amortization, and pre-opening costs.
All told, Dave and Busters was seen making more than $350 million in adjusted operating profits prior to fiscal 2020.
The best thing is that Dave and Buster’s adjusted operating profit had been steadily rising as opposed to the declining GAAP operating profit which we saw earlier.
Dave and Buster’s rising adjusted operating profit illustrates the company’s improving core operating strength after being adjusted for certain expenses.
Dave and Buster’s certain operating expenses such as the SGA and depreciation and amortization expenses may have drastically increased over the years, thereby greatly affecting the company’s GAAP operating results.
Therefore, after being excluded in the adjusted operating income, Dave and Buster’s non-GAAP operating income was seen rising steadily over the years.
In short, Dave and Buster’s rising adjusted operating results prior to COVID time bodes well for the company and shareholders as it indicates an expanding core operating strength of the company.
Dave and Buster’s Adjusted EBITDA
Dave and Buster’s adjusted EBITDA
Another non-GAAP measure used by Dave and Busters to measure its business performance is the adjusted EBITDA which stands for adjusted earnings before tax, interest, depreciation and amortization.
Aside from excluding the usual items such as taxes, interest expenses and depreciation and amortization expenses, Dave and Buster’s adjusted EBITDA is further adjusted to exclude other non-cash items, including impairment charges, share-based compensation as well as pre-opening costs.
In Dave and Buster’s case, its adjusted EBITDA is nearly equivalent to the operating cash flow prior to changes in working capital.
Therefore, Dave and Buster’s adjusted EBITDA is essentially a measure of the company’s operating cash flow prior to changes in working capital.
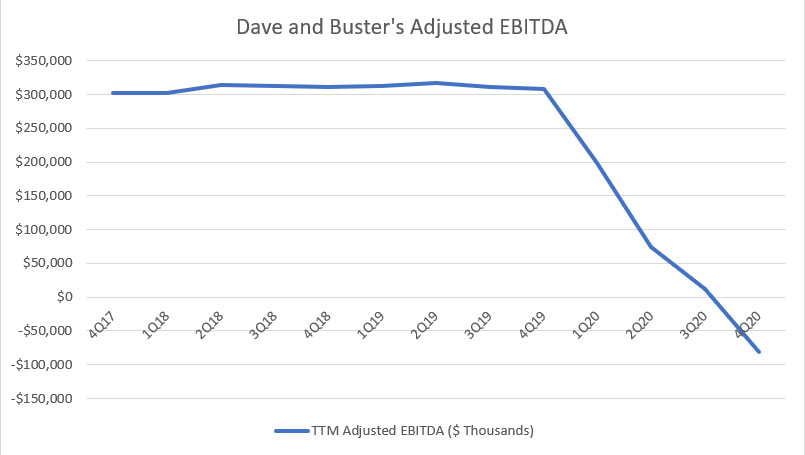
That said, Dave and Busters produced about $300 million EBITDA on a TTM basis prior to fiscal 2020.
Between fiscal 2017 and fiscal 2019, the company’s adjusted EBITDA has been somewhat flat, hovering around the $300 million levels during the said period.
When the COVID-19 outbreak hit North America, Dave and Buster’s adjusted EBITDA came crashing and turned negative at -$81 million for the 1st time since fiscal 2017.
At this figure, Dave and Buster’s businesses were consuming cash instead of producing it.
Summary
Dave and Busters had been a profitable company prior to the COVID-19 outbreak, making more than $100 million in annual net profit.
Similarly, Dave and Buster’s GAAP operating income reached more than $150 million on a TTM basis prior to fiscal 2020.
However, Dave and Buster’s fortune changed dramatically in the COVID age, with net profit tumbling beyond -$200 million from a TTM perspective as of fiscal 4Q 2020.
Also, Dave and Busters had been a cash cow, producing close to $300 million in adjusted EBITDA and more than $350 million in adjusted operating income, illustrating the cash-producing power of the company prior to fiscal 2020.
All of that had changed in the age of COVID when Dave and Busters was not only incurring losses but also consuming cash instead of producing it.
References and Credits
1. Financial figures in this article were obtained and referenced from Dave and Buster’s financial statements which can be found in Dave and Buster’s Investor Relations.
2. All images in this article are used under creative commons license and sourced from the following websites: Eden, Janine and Jim and Mike Mozart.
Recommended Reads For Other Stocks
Disclosure
If you find the information in this article helpful, please consider sharing it on social media and also provide a link back to this article from any website so that more articles like this one can be created in the future.
