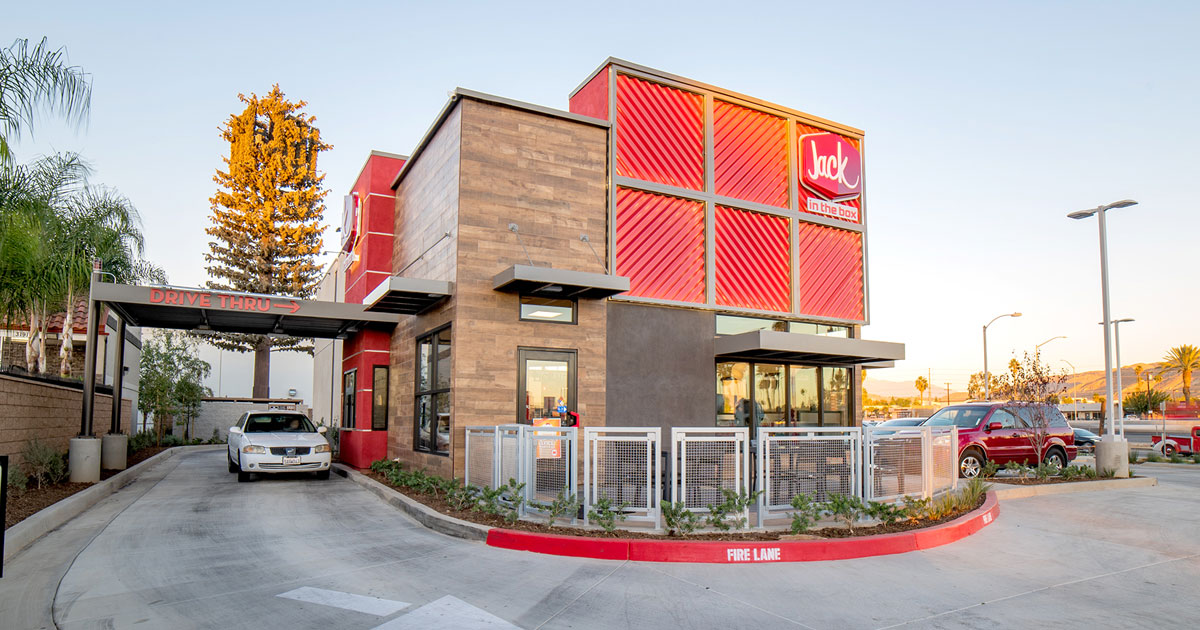
Jack In The Box new look. Source: Flickr Image.
Jack In The Box (NASDAQ:JACK) is one of the largest hamburger chains in the U.S.
The company competes primarily in the quick-service restaurant or “QSR” sector and owns and operates 2,241 Jack in the Box restaurants as of fiscal 2020, with the majority of them located mainly in the western and southern U.S.
Of that number of restaurants, 2,097 or 94% were franchised.
As a result, Jack In The Box operates only 144 restaurants out of the 2 thousand plus restaurants.
Since Jack In The Box owns and franchises its restaurants, its revenue streams come primarily from sales generated by company-owned restaurants, franchise rental revenue, franchise royalties, and franchise fees as well as contributions for advertising and services.
In this article, we will focus only on Jack In The Box’s cash metrics, including the company’s cash on hand, operating cash flow, cash conversion efficiency, free cash flow, and net cash from investing as well as financing activities.
Let’s move on!
Jack In The Box’s Cash Flow Topics
1. Total Cash
2. Cash To Current Assets Ratio
3. Net Cash From Operations
4. Cash Conversion Ratio
5. Net Cash From Investing Activities
6. Free Cash Flow
7. Net Cash From Financing Activities (With Dividends and Stock Buybacks)
8. Net Cash From Financing Activities (Without Dividends and Stock Buybacks)
9. Conclusion
Jack In The Box’s Total Cash
Jack In The Box’s cash on hand
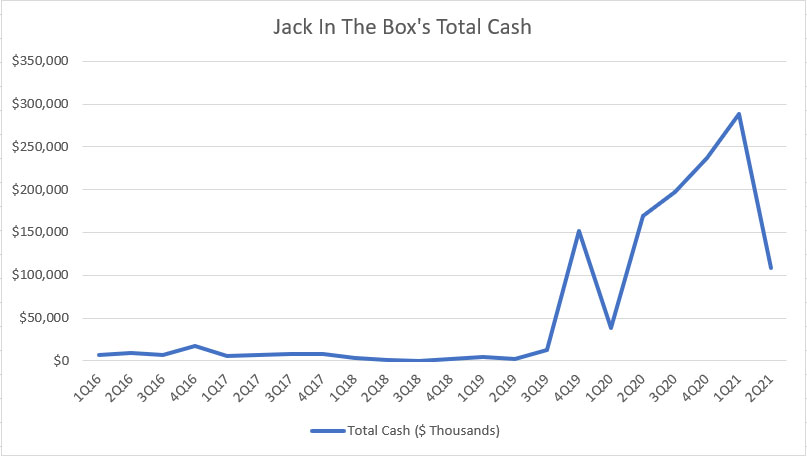
Let’s first look at Jack In The Box’s total cash on hand as shown in the chart above for the period from fiscal 2016 to fiscal 2021.
Jack In The Box’s total cash consists primarily of cash and cash equivalents and restricted cash.
As such, they are highly liquid assets that can be used almost instantly.
As seen in the chart, Jack In The Box had very little cash on hand prior to fiscal 2020, averaging no more than $10 million USD per quarter.
Post-fiscal 2020, Jack In The Box’s cash on hand started to rise significantly and reached nearly $300 million at its peak figure before coming down to slightly over $100 million in fiscal 2Q 2021.
The significant jump in Jack In The Box’s total cash has to do with the COVID-19 outbreak which started in early 2020.
To enhance its liquidity and maintain maximum financial flexibility, Jack In The Box had fully drawn on its credit facilities in fiscal 2020 Q2, providing the company with more than $100 million of unrestricted cash.
Aside from adding liquidity, Jack In The Box also had temporarily suspended all share buyback activities and even stopped its cash dividend payment for 1 quarter in fiscal 2020 2Q.
With a total cash balance of more than $100 million as of fiscal 2Q 2021, Jack In The Box should have enough liquidity to weather the COVID storm going forward.
Jack In The Box’s Cash To Current Assets Ratio
Jack In The Box’s cash to current assets ratio
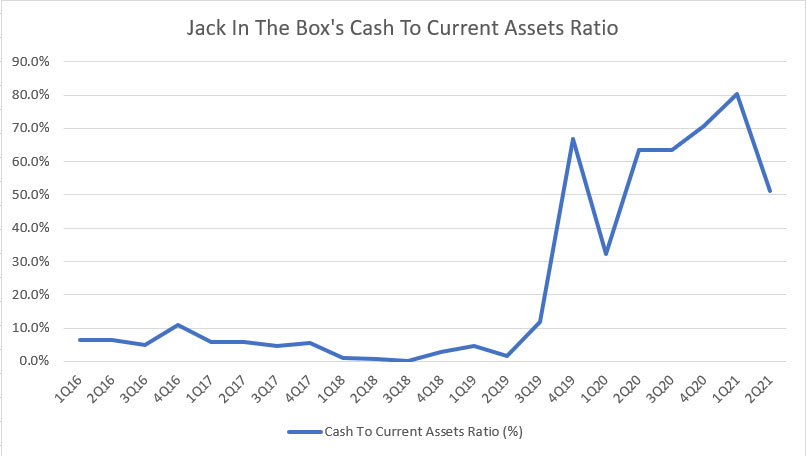
With respect to current assets, Jack In The Box’s cash on hand made up less than 10% of the company’s current assets prior to the COVID age.
In fact, Jack In The Box’s total cash made up only 5% of the company’s current assets on average in the past.
However, the ratio started to rise in fiscal 4Q 2019 and had even reached slightly over 80% of the company’s current assets at one time in fiscal 2021.
As of fiscal 2Q 2021, Jack In The Box’s cash to current assets ratio totaled 50%, suggesting that the company still carried a significant amount of cash despite having gone through the COVID age for more than a year.
Jack In The Box’s Net Cash From Operations
Jack In The Box’s net cash from operations
While Jack In The Box has more than $100 million of cash, it would be useless if the company can’t consistently produce positive net cash from operations as the cash reserves will be used up in no time.
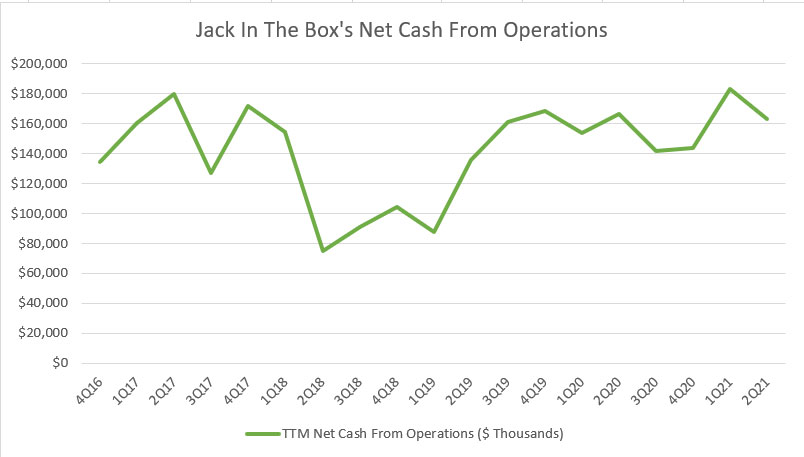
In this section, we will look at Jack In The Box’s net cash from operations which is shown in the chart above.
Accordingly, Jack In The Box has been able to clock in meaningful net cash from operations, averaging more than $100 million, between fiscal 2016 and fiscal 2021.
As seen in the chart, Jack In The Box’s net cash from operations has not been negatively affected despite having mandatory shutdowns and lower guest traffic at most of the company’s restaurants during the COVID age.
Between fiscal 4Q 2019 and 2Q 2021, Jack In The Box has managed to produce net cash from operations averaging around $160 million, a figure that was even higher than that of the pre-COVID time.
As of fiscal 2021 2Q, Jack In The Box’s net cash from operations totaled as much as $160 million on a TTM basis, indicating that the company’s cash flow has already recovered to its pre-COVID level.
Jack In The Box’s positive net cash from operations is important to the company as the surplus of cash from business operations will contribute to the company’s increasing cash reserves.
The company can do freely with the surplus of cash, including buying back shares, invest for future growth and paying a dividend.
All in all, Jack in The Box is a cash printing machine.
Jack In The Box’s Cash Conversion Ratio
Jack In The Box’s cash conversion ratio
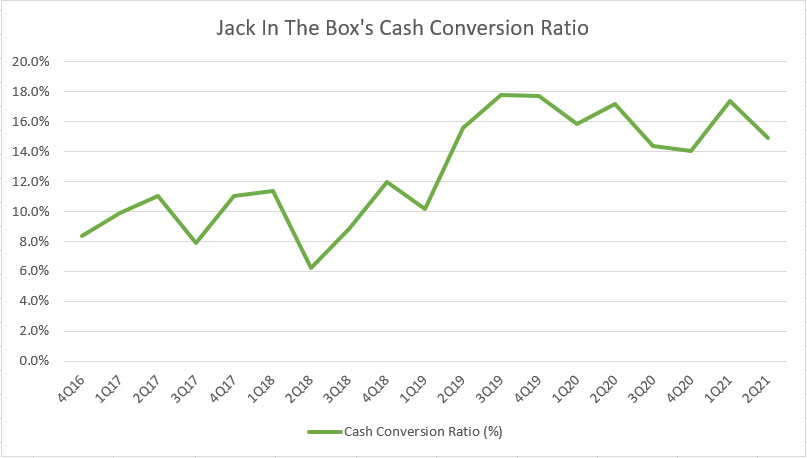
The cash conversion ratio measures the cash conversion efficiency from revenue to net cash from operations.
The ratio is expressed in percentage.
As shown in the chart, Jack In the Box’s cash conversion efficiency has been slowly creeping up since 2016 and reached as high as 16% as of fiscal 2021.
At this ratio, Jack In The Box converts $1.00 dollars of sales to $0.16 dollars of net cash, indicating the high cash conversion capability of the company.
As mentioned, Jack In The Box’s net cash from operations was even higher than its pre-COVID level in fiscal 2021, and this is in line with the high cash conversion ratio reported in the same fiscal year.
Again, the ratio shows that Jack In The Box is literally printing cash.
Jack In The Box’s Net Cash From Investing Activities
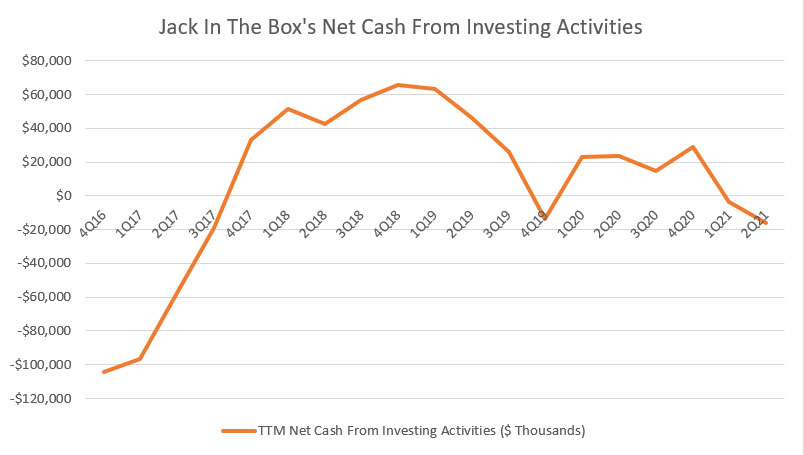
Jack In The Box’s net cash from investing activities
The net cash from investing activities reflects Jack In The Box’s investments, including capital expenditures, sales and acquisition of properties, etc.
A positive figure in the chart means that Jack In The Box’s investment activities had produced a cash inflow while a negative figure indicates a cash outflow.
Aside from spending on capital expenditures, Jack In The Box also has invested in properties intended for sale or sale and leaseback to franchisees.
This practice is an interesting aspect of Jack In The Box’s business activities.
In general, we almost always see negative figures in net cash from investment activities in most companies.
However, for Jack In The Box, the investing activities have sometimes produced positive net cash figures as seen in the chart due to the practices of selling and leasing the properties back to franchisees.
Aside from sale or sale and leaseback of properties, Jack In The Box also sells company-operated restaurants and equipment to franchisees, thereby further adding to the positive net cash from investing activities.
Again, the surplus of cash from investing activities is essential to Jack In The Box as it represents extra cash that will further bolster the company’s cash reserves.
Jack In The Box’s Free Cash Flow
Jack In The Box’s free cash flow
The discussion of Jack In The Box’s cash flow analysis will be incomplete if it doesn’t involve free cash flow.
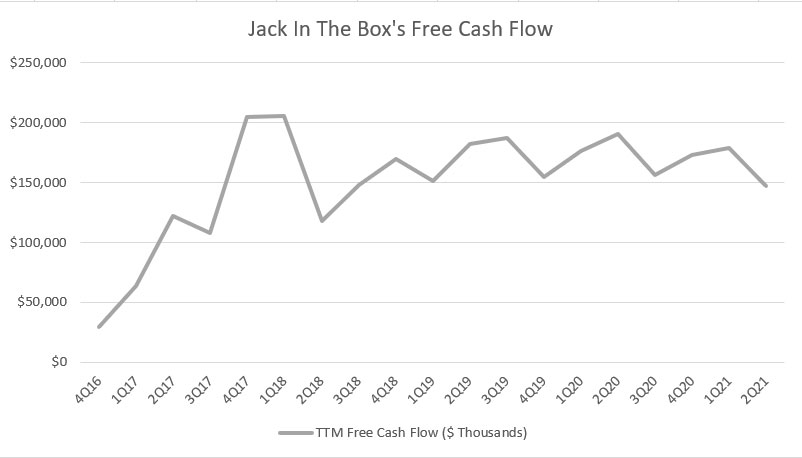
As such, a free cash flow chart above is created for the period between 2016 and 2021.
Keep in mind that Jack In The Box’s free cash flow depicted in the chart is the product of net cash from operations deducting net cash from investing activities.
Instead of using only the capital expenditures in the free cash flow equation, net cash from investing activities is used during the measurement because other cash activities such as the sale or sale and leaseback of properties have been a recurring practice for Jack In The Box.
Therefore, it makes sense to include the cash flow of these activities in the free cash flow equation so that their effects are not being ruled out.
All told, Jack In The Box’s free cash flow has been averaging around $150 million in the past 6 years as seen in the chart.
As of fiscal 2021 2Q, Jack In The Box’s free cash flow totaled $147 million on a TTM basis, a level that hasn’t changed much compared to the pre-COVID levels.
In fact, Jack In The Box has been able to consistently maintain its free cash flow level during the COVID age, suggesting that the company’s cash-producing ability has been mostly free from the negative impacts of the pandemic.
At this level of free cash flow, Jack In The Box is literally printing cash, churning out $150 million of cash on average from a TTM perspective.
Jack In The Box’s Net Cash From Financing Activities (With Dividends and Share Buybacks)
Jack In The Box’s net cash from financing activities (with dividends and share buybacks)
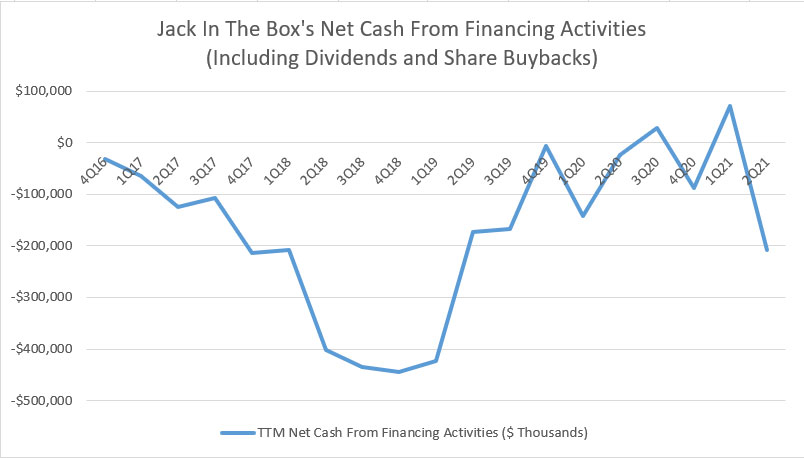
Another cash metric that is worth taking a look at is the net cash from financing activities.
This metric measures primarily Jack In The Box’s cash flow arising from capital movements, including debt repayments, equity issuance, bonds offerings, etc.
Aside from capital movements, the net cash from financing activities also tracks the company’s cash flow arising from dividend payments and share buybacks.
According to the chart, Jack In The Box’s net cash from financing activities has been mostly negative, due mainly to the cash outflow as a result of dividend payments and share buybacks.
Prior to fiscal 2020, Jack In The Box’s net cash from financing activities was seen reaching more than -$400 million, primarily driven by share buybacks that totaled as much as $300 million in some quarters.
However, the company’s net cash from financing activities slowly turned neutral when Jack In The Box temporarily suspended dividend payout and share buybacks in some quarters in fiscal 2020 and 2021.
Jack In The Box’s Net Cash From Financing Activities (Without Dividends and Share Buybacks)
Jack In The Box’s net cash from financing activities (without dividends and share buybacks)
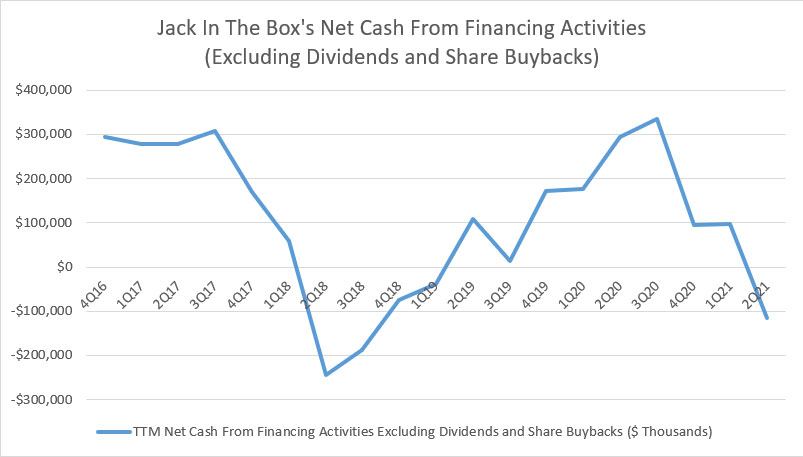
When we exclude the cash flow arising from dividend payout and share buybacks, Jack In The Box’s net cash from financing activities becomes mostly positive as shown in the chart above.
The positive net cash shows that Jack In The Box has been raising cash through debt and/or equity.
Without the effect of dividend payments and share buybacks, we can see that Jack In The Box has been taking on debt and may have also been issuing equity to raise cash.
According to the chart, Jack In The Box’s net cash from financing activities increased the most in fiscal 2020.
In other words, the company had raised the most cash in this period.
In fiscal 2021 1Q, Jack In Box was seen slowing paying back some of the debt taken on earlier, as reflected by the declining net cash from financing activities which reached slightly more than -$100 million on a TTM basis.
While Jack In The Box has raised cash in most fiscal periods, the company had also paid back some of the borrowed cash.
Therefore, the overall effect looks neutral.
Conclusion
In short, Jack In The Box operated on very little cash on hand prior to the COVID storm, averaging no more than $10 million in a quarter.
However, the company’s cash on hand significantly increased to $300 million at its top to maintain maximum financial flexibility during the COVID time.
From an operational point of view, Jack In The Box is a powerful cash cow, generating tonnes of free cash flow even during the COVID age.
The company’s cash-producing ability does not seem to be affected much by the impacts of the pandemic despite having store closure and lower guest traffic to its restaurants.
Aside from having consistent positive net cash from operations, Jack In The Box also generates positive net cash from investing activities, attributable primarily to the sale or sale and leaseback of properties back to franchisees.
As a result, Jack In The Box’s combined net cash from operations and investing activities has literally made the company a powerful cash-printing machine.
References and Credits
1. All financial figures in this article were obtained and referenced from Jack In The Box’s quarterly and annual reports which can be found in: Jack In The Box Investor Relations.
2. Featured images in this article are used under creative commons license and are sourced from: George and Thomas Hawk.
Other Stock Analysis That May Help You
Disclosure
If you find the information in this article helpful, please consider sharing it on social media and also provide a link back to this article from any website so that more articles like this one can be created in the future.
