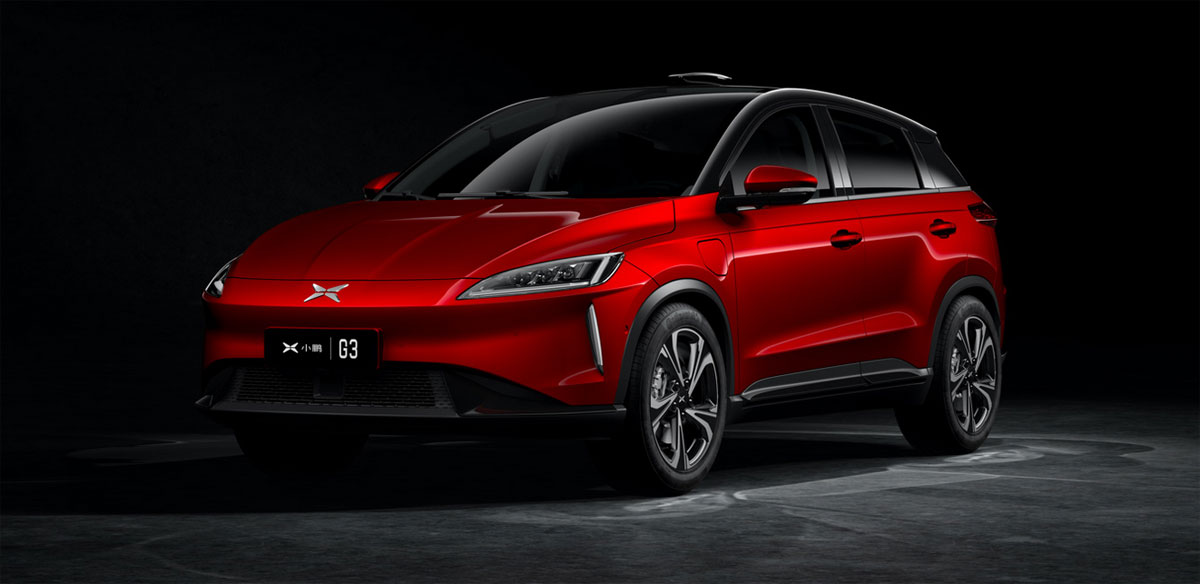
XPENG G3. Source: XPEV
This article compares the debt, cash on hand and leverages of Chinese EV companies with that of Tesla.
Chinese EV companies included in this discussion are Nio (NYSE:NIO), Xpeng (NYSE:XPEV) and Li Auto (NASDAQ:LI).
Among all Chinese EV makers, Nio is by far the biggest in terms of revenue and vehicle delivery volumes.
In addition, Nio also is the largest company by market capitalization among all Chinese EV makers.
As of Sept 2021, Nio’s market capitalization is slightly over $60 billion while Xpeng and Li Auto are only half of Nio’s figure.
In this article, the leverage that we will discuss includes debt to equity and debt to asset ratio.
Aside from the ratio, we also will dive into the capital structure of these companies and compare them with that of Tesla.
The capital structure tells us about how these companies fund their balance sheets, whether by debt or by equity or equally both.
Therefore, let’s go take a look!
EV Companies’ Debt, Cash On Hand And Leverages Topics
1. Total Debt
2. Total Cash on Hand
3. Net Debt
4. Debt To Equity Ratio
5. Debt To Asset Ratio
6. Capital Structure Ratio
7. Conclusion
Total Debt
EV companies’ total debt comparison
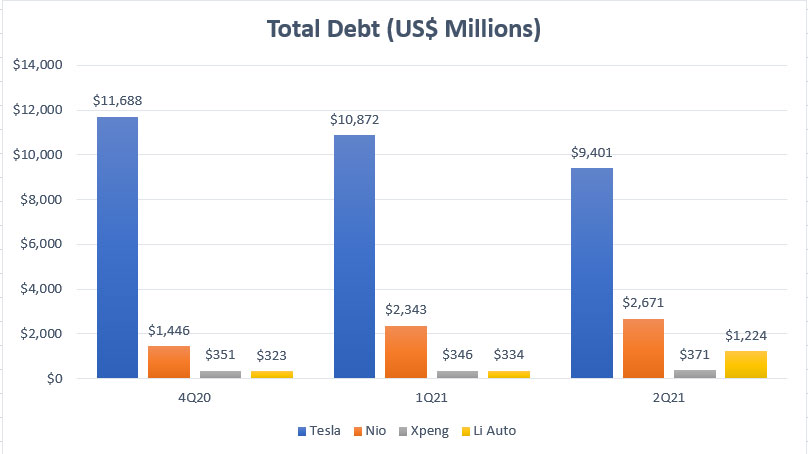
Let’s first look at the comparison of total debt for all EV companies, including Tesla, Nio, Xpeng and Li Auto, as shown in the chart above.
In terms of the absolute value, Tesla holds the largest debt among all companies at nearly $10 billion USD.
On the other hand, Nio ranks 2nd in terms of total debt figure at $2.7 billion USD reported in fiscal 2Q 2021.
Xpeng and Li Auto were having almost the same amount of debt but Li Auto’s total debt has risen significantly in 2Q 2021 to $1.2 billion.
In short, Xpeng is the only Chinese EV maker whose total debt has remained flat in the last several quarters compared to other Chinese EV makers whose debt figures have risen dramatically.
In addition, Xpeng’s total debt also was the least at only $371 million USD as of fiscal 2021 2Q.
Total Cash on Hand
EV companies’ total cash on hand comparison
A discussion of debt will be incomplete without talking about cash.
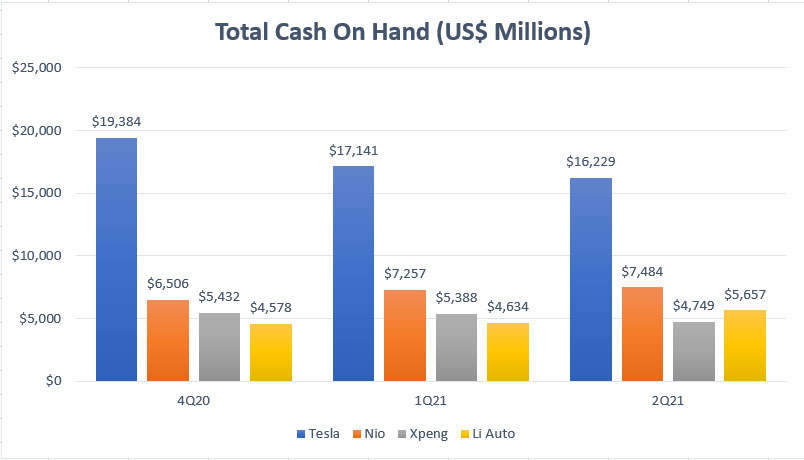
As such, I have created the chart above that compares the total cash on hand of Chinese EV companies with that of Tesla.
Keep in mind that the total cash on hand stated in the chart involves primarily liquid assets such as cash and cash equivalents as well as marketable securities which can be deployed whenever they are needed.
That said, according to the chart above, Tesla is again the EV company with the most cash on hand and it was reported to be around $16.2 billion USD in fiscal 2021 2Q.
At this amount of cash, Tesla’s total cash on hand is easily more than twice higher than that of Nio and more than triple higher than that of Xpeng and Li Auto.
As of fiscal 2021 Q2, Nio, Xpeng and Li Auto reported a cash-on-hand figure of $7.5 billion, $4.7 billion and $5.7 billion, respectively.
I am surprised to find out that Li Auto nearly has the same amount of cash as that of Nio despite being a much smaller EV player.
Also, most Chinese EV companies’ total cash on hand has remained more or less flat in the last several quarters, signaling that they have ample liquidity and a continuous stream of cash flow supporting their operations.
Net Debt
EV companies’ net debt comparison
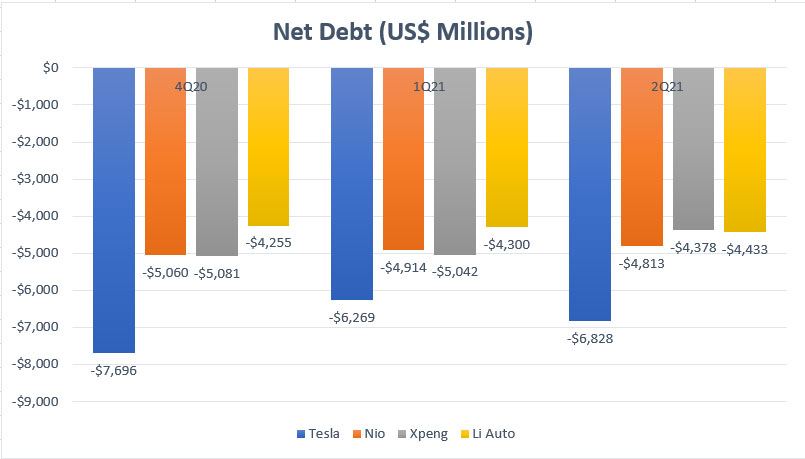
In terms of net debt, all EV companies, including Tesla and Chinese EV makers such as Nio, Xpeng and Li Auto, have negative net debt.
This means that all EV companies have more cash than debt.
On an absolute value basis, Tesla’s net debt clocked in at nearly -$7 billion in Q2 2021, the lowest among all EV companies.
For Chinese EV companies, they have relatively the same amount of net debt as of fiscal 2021 Q2, at about -$4 billion USD.
In short, all EV companies, including the Chinese EV makers, are flushed with cash and they should have no liquidity problem as of now since their cash on hand can instantly pay off all debt and will still be left with extra cash to support their business operations.
Debt To Equity Ratio
EV companies’ debt to equity ratio comparison
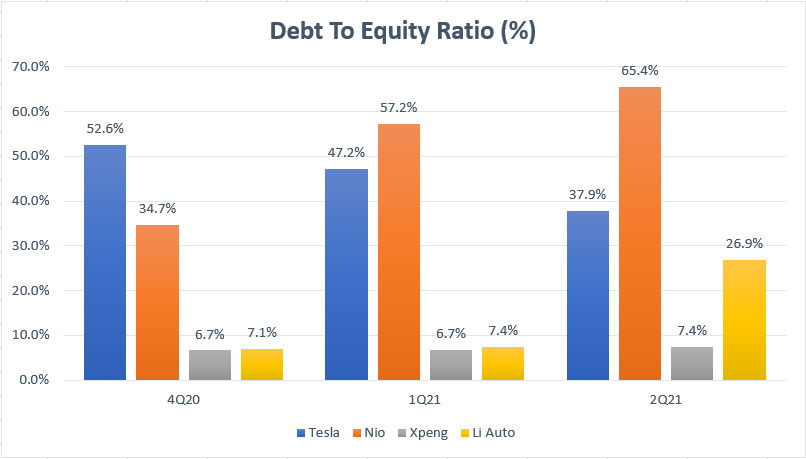
The debt to equity ratio measures the debt leverages of EV companies with respect to their equity.
Therefore, the higher the ratio, the more leverage a company has over equity.
For your information, equity is the net asset of a company and it can be in the form of cash or physical assets such as a building or a piece of land.
According to the chart, while Tesla has the largest total debt, it does not have the highest leverage.
As of Q2 2021, Tesla’s debt to equity ratio measures at only 38%, only slightly above that of Li Auto.
On the other hand, Nio’s debt leverage is the highest among all EV makers, notably at 65% reported in fiscal 2021 2Q.
At this ratio, Nio’s total debt is about 65% of the amount of equity, meaning that for each $1 dollar of equity, the company has $0.65 dollar of debt.
In contrast, Xpeng’s debt leverage is the lowest among all EV makers at only 7% as of fiscal 2Q 2021.
Li Auto’s debt leverage has significantly risen in Q2 2021 to 27% due to the company’s growing indebtedness in the same quarter to more than $1 billion of total debt.
Debt To Asset Ratio
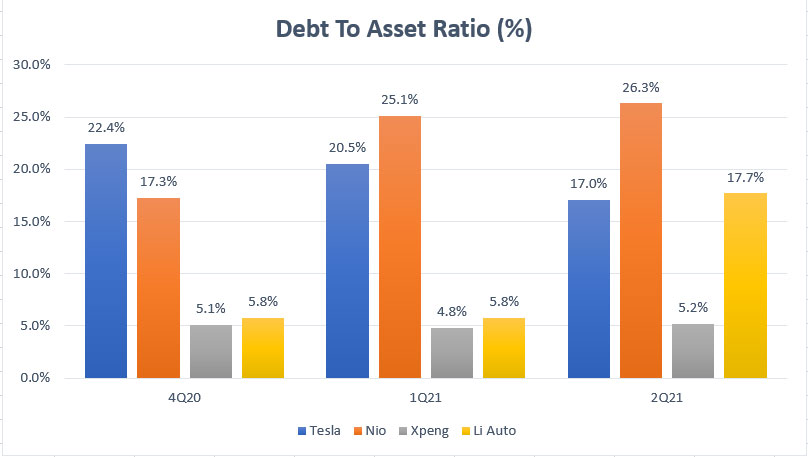
EV companies’ debt to asset ratio comparison
Similarly, the debt to asset ratio measures the debt leverages of the EV companies with respect to their respective total assets.
In this aspect, the higher the ratio, the higher leverages a company has with respect to assets.
According to the chart, Nio is again at the top of the ranking with a debt to asset ratio of 26% reported in fiscal 2Q 2021.
At this ratio, as much as 26% of Nio’s total assets is made up of debt or total debt.
In other words, for Nio, out of every $1 dollar of assets, $0.26 dollar comes from or is funded by debt.
Also, Tesla and Li Auto are both having the same amount of debt leverages with respect to assets at 17% reported in fiscal Q2 2021.
The difference between the 2 companies is that Tesla’s debt leverage has been on a decline whereas Li Auto’s debt leverage has risen significantly over the last several quarters.
Again, Xpeng is the lowest leveraged EV automaker compared to Tesla and all Chinese EV companies at a debt to asset ratio of only 5% reported in fiscal 2021 2Q.
Unlike Li Auto whose leverage has ballooned dramatically, Xpeng’s debt leverage has remained relatively unchanged over the last several quarters, indicating that the company is fundamentally more efficient than the other.
Capital Structure Ratio
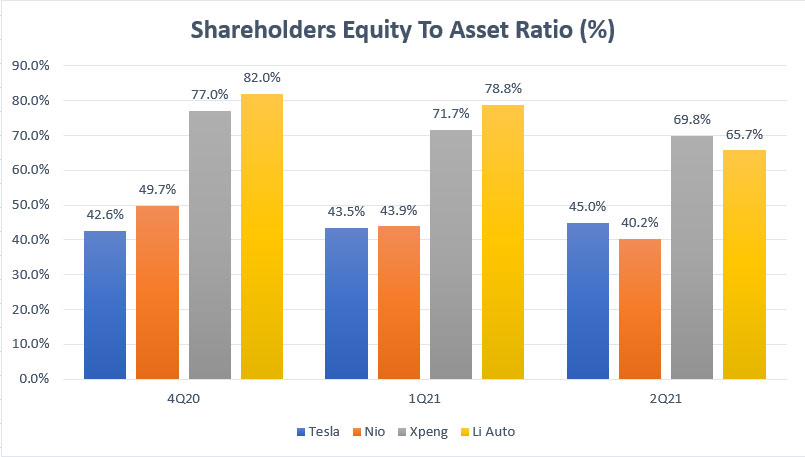
EV companies’ capital structure comparison
The capital structure ratio in the chart above measures how each company funds its balance sheets.
For example, for Tesla, its balance sheets are 45% equity and 55% liabilities in fiscal 2021 2Q.
In other words, Tesla funded its asset base with a higher portion of debt or liabilities.
On the other hand, both Xpeng and Li Auto have been funding their asset base with equity as reflected in the high ratios for these companies.
In this aspect, Xpeng’s capital structure ratio reaches 70% as of 2Q 2021, the highest among all EV companies, indicating that the company’s asset base is mostly comprised of equity instead of liabilities.
Similarly, Li Auto has almost the same capital structure ratio as that of Xpeng at 66% reported in fiscal 2Q 2021.
However, Li Auto used to have a much higher capital structure ratio in which more than 80% of its balance sheets is made up of equity.
Since Li Auto has taken up a considerable amount of debt in 2Q 2021, its capital structure has slightly shifted to a debt-based structure.
In short, Xpeng is by far the EV company with the strongest balance sheets.
Conclusion
Of all Chinese EV companies, Xpeng is fundamentally the most solid as the company has the lowest debt leverages with respect to equity and assets.
As of 2Q 2021, Xpeng carried only $371 million USD of total debt, less than one-third the amount carried by Li Auto and about one-tenth the amount carried by Nio.
Being the least leveraged company also means that Xpeng will have an abundance of net assets or equity.
This is shown in Xpeng’s exceptionally high capital structure ratio in which the figure has reached 70% in 2021 Q2, indicating that the company’s asset base is comprised of 70% equity and 30% liabilities.
Therefore, if you ask me which company I should invest in, the answer is very clear – XPEV.
Why? The answer is simple.
A company with the smallest leveraged will have the lowest risk.
References and Credits
1. Financial figures for all companies discussed above were obtained and referenced from their respective financial statements which can be obtained from the following links:
a) TeslaInvestor Relations
b) NIO Investor Relations
c) Xpeng Investor Relations
d) Li Auto Investors Overview
2. Featured images are used under Creative Common Licenses and obtained from Wind Energy.
Other Statistics That You May Find Helpful
Disclosure
The content in this article is for informational purposes only and is neither a recommendation nor a piece of financial advice to purchase a stock.
If you find the information in this article helpful, please consider sharing it on social media and also provide a link back to this article from any website so that more articles like this one can be created in the future. Thank you!
