Renewable energy. Flickr Image
The cash flow is one of the most critical fundamental data to evaluate a company.
This criterion is even more so for basic materials companies such as the coal miners, including Peabody Energy (BTU), Arch Resources (ARCH) and Alliance Resource Partners (ARLP).
Therefore, in this article, we will specifically look at and compare several cash flow metrics of the coal miners.
These cash flow metrics include operating cash flow, free cash flow, cash conversion rate and cash flow from financing activities.
From the comparison, we can evaluate the cash generation capabilities of the coal miners and find out which company is the best when it comes to producing cash.
A company that generates strong cash flow will usually be able to endure all economic conditions and hence, wins in the long run.
On the other hand, a company with a weak cash flow is susceptible to an economic downturn and will most likely declare bankruptcy in the event of an excessive debt level or a liquidity crunch.
That said, of all coal miners discussed in this article, both Peabody and Arch Resources have filed for bankruptcy protection before, notably in 2016 but have emerged from it in the same year – Arch Coal’s Chapter 11 and Peabody’s Chapter 11.
The only coal miner that has never declared bankruptcy all these years is Alliance Resource Partners because of its superior cash flow metrics.
All told, let’s check out the coal companies’ cash flow metrics.
BTU, ARCH And ARLP’s Cash Flow Topics
1. Net Cash From Operations
2. Cash Conversion Rate
3. Free Cash Flow
4. Net Cash From Financing Activities
5. Summary
Net Cash From Operations
Net cash from operations
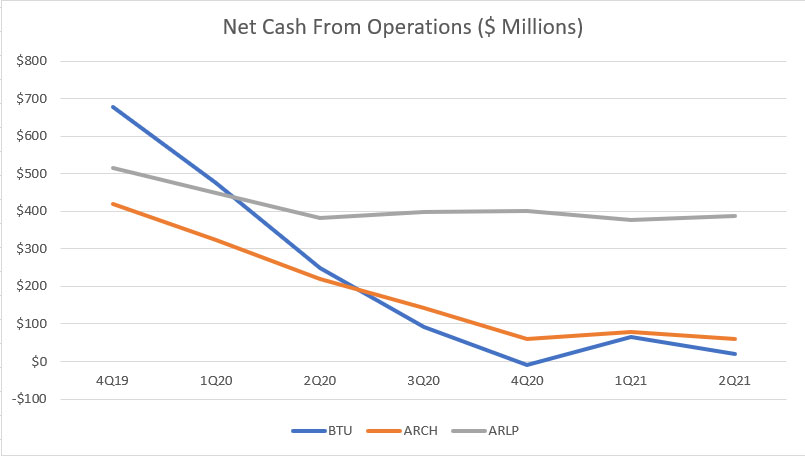
Let’s first look at the net cash from operating activities of coal miners.
According to the chart above, it is very clear that Alliance Resource Partners or ARLP is the most superior when it comes to generating operating cash flow.
As seen, ARLP’s net cash from operations came to about $400 million USD as of 2Q 2021 while it was less than $100 million for Peabody and Arch Resources, respectively, in the same fiscal quarter.
More importantly, on a long-term basis, the net cash from operations of Peabody and Arch Resources has declined the fastest in the last 3 years while those from ARLP have held up quite nicely at the $400 million levels.
Both BTU and ARCH have only been able to stop the decline in net cash from operating activities in the last 2 quarters and their figures came in at $20 million and $60 million, respectively, in the 2nd quarter of 2021.
Although ARLP also has experienced a decline in operating cash flow, it has not been as serious as that of BTU and ARCH.
In fact, ARLP’s operating cash flow has remained quite firmly at the $400 million levels for more than a year, illustrating the strong cash flow position of the company despite multiple setbacks, including the COVID-19 pandemic and a weakening coal market.
Cash Conversion Rate
Cash conversion rate
The cash conversion rate in the chart above measures the efficiency of converting cash from sales to operating net cash.
Again, based on the chart, ARLP or Alliance Resource Partners has been the best coal miner when it comes to converting sales to operating cash flow.
In this regard, ARLP’s cash conversion rate has averaged around 28% in the last 3 years, more than triple the numbers reported by other coal miners such as BTU and ARCH.
Although ARLP has experienced a decline in operating cash flow in 2020, its cash conversion rate has jumped from 25% to as much as 30%, indicating the superior cash conversion capability of the company.
In contrast, the cash conversion rates of both Peabody Energy and Arch Resources have been on a decline and came in at only 1% and 4%, respectively, as of fiscal 2021 Q2, the lowest levels both companies have ever reported.
In short, ARLP beats BTU and ARCH hands down in terms of cash conversion rate.
Free Cash Flow
Free cash flow
Free cash flow is the cash left from operations after accounting for capital expenditures.
Therefore, free cash flow is the leftover cash that a company can use for many purposes, including paying a cash dividend and buying back stocks.
Dividend income investors should look for companies with plenty of free cash flow to invest in.
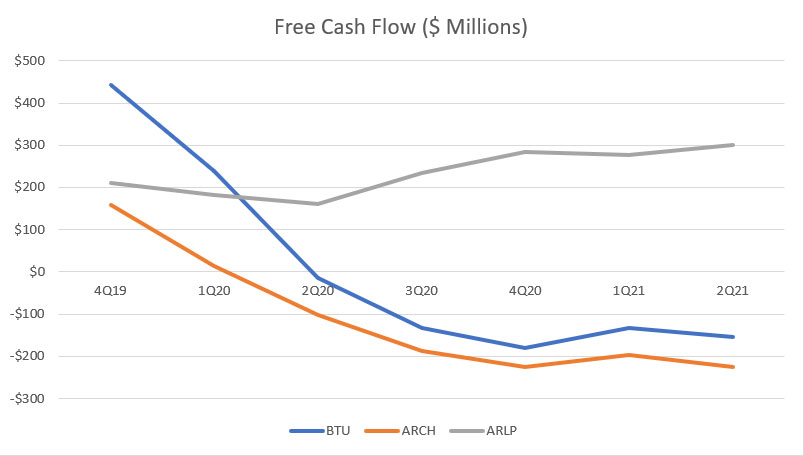
That said, according to the chart above, Alliance Resource Partners or ARLP is again the best coal miner in terms of the amount of free cash flow being generated in the last 3 years.
For example, ARLP’s free cash flow totaled $300 million as of fiscal 2021 2Q on a TTM basis while free cash flow from other coal miners such as BTU and ARCH were in the red, meaning that their capital expenditures had exceeded the operating cash flow.
More importantly, ARLP’s free cash flow has been on a rise in the last 3 years, with the 2021 2nd quarter being the best quarter ever at $300 million of free cash flow.
On the other hand, both BTU and ARCH’s free cash flow has been on a decline, reporting a figure of -$155 million and -$225 million, respectively, in fiscal 2021 Q2, representing a year-on-year decline of more than 50%.
Despite the decline, both BTU and ARCH’s free cash flow has stabilized in recent quarters but was still considerably down in the red.
Again, Alliance Resource Partners beats Peabody and Arch Resources hands down when it comes to free cash flow being produced.
Net Cash From Financing Activities
Net cash from financing activities
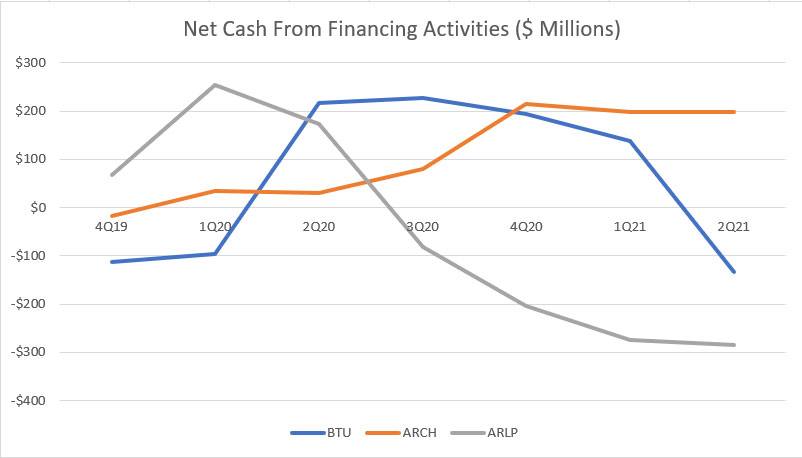
Keep in mind that the net cash from financing activities plotted in the chart above is without the cash outflow for dividend payments and stock buybacks.
Therefore, the effect of cash dividend payments and stock buyback does not come into the picture in the chart above.
That said, based on the chart above, both BTU and ARCH have reported mostly positive net cash from financing activities in the last 3 years.
In other words, BTU and ARCH have been raising cash, either from debt or from equity or both.
On the other hand, ARLP’s net cash from financing activities has been negative, indicating that the company has been paying back capital to investors.
This scenario is important as it shows that ARLP has the necessary financial means to repay its capital while BTU and ARCH have been on the other side of the camp.
The reason that BTU and ARCH have been on a borrowing spree is because of their weak cash flow position.
As seen in all prior charts, both Peabody Energy and Arch Resources have relatively weak operating cash flow and free cash flow compared to Alliance Resource Partners.
As a result, Arch Resources, in particular, whose net cash from financing activities has been increasing, is seen raising capital in the last 3 years because the company has not been able to generate enough cash to pay for everything, including capital spending and debt.
Conclusion
Of all coal miners, Alliance Resource Partners or ARLP is the most superior in terms of the amount of net cash from operations and free cash flow being generated.
In this regard, ARLP’s operating net cash and free cash flow are much higher than that of Peabody Energy and Arch Resources.
Additionally, ARLP also has a much higher cash conversion rate compared to that of BTU and ARCH.
Reportedly, ARLP’s cash conversion rate checked in at nearly 30% in fiscal 2021 2Q, a figure close to 300% higher than that of BTU and ARCH.
Since Alliance Resource Partners has a much better cash flow, it has managed to repay the capital back while Peabody Energy and Arch Resources are seen raising capital in most quarters.
As a result, ARLP has never filed for bankruptcy protection while Peabody and Arch Resources have both filed for bankruptcy protection back in 2016.
References and Credits
1. All financial information in this article was obtained and referenced from the annual and quarterly reports which are available in the following links:
a) BTU Investors Relation
b) ARCH Earnings Call Results
c) ARLP’s Quarterly Results
2. Featured images in this article are used under Creative Commons Licenses and obtained from light bulb and renewable energy.
Top Statistics For Other Companies
Disclosure
The content in this article is for informational purposes only and is neither a recommendation nor a piece of financial advice to purchase a stock.
If you find the information in this article helpful, please consider sharing it on social media and also provide a link back to this article from any website so that more articles like this one can be created in the future. Thank you!
