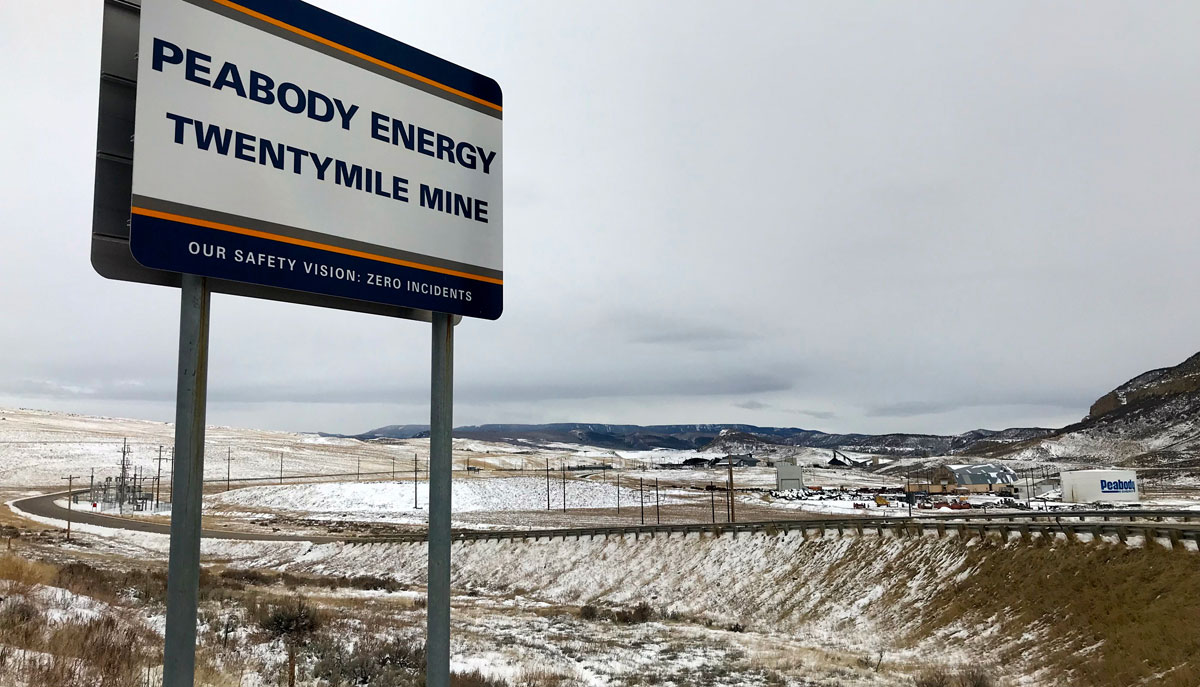
Peabody Energy’s coal mine. Flickr Image
This article keeps track of and compares the debt and cash of some of America’s largest coal miners such as Peabody Energy (BTU), Arch Resources (ARCH) and Alliance Resource Partners (ARLP).
At the time this article was updated, Peabody was America’s largest coal company by market capitalization, notably at $2.2 billion USD while Arch Resources and Alliance Resource Partners were only trading at around $1.2 billion USD in market capitalization.
In addition, Peabody was also America’s largest coal miner by shipment volume.
As of fiscal 2Q 2021, Peabody has sold more than 100 million tons of thermal coal on a TTM basis in the U.S. alone, nearly double the size of other coal miners, including ARCH and ARLP.
While Peabody leads the pack in terms of volumes and market capitalization, it may also be the most indebted coal company in the U.S. by dollar amount.
Therefore, in this article, we will look at the debt and cash of all coal miners and make a comparison to find out which one is debt-laden and which one is flushed with cash.
Aside from the debt and cash on hand, we also will look at the leverage ratios such as the debt to equity ratio and debt to asset ratio to find out how big their debt is with respect to the equity and assets of the companies.
Finally, we will compare the capital structure of the coal miners and measure how they structure their asset base, whether entirely by debt or by equity, or equally both.
So, let’s take a look!
BTU, ARCH And ARLP’s Debt And Cash Topics
1. Total Debt
2. Cash On Hand
3. Net Debt
4. Debt To Equity Ratio
5. Debt To Asset Ratio
6. Capital Structure
7. Summary
Total Debt
Peabody, Arch Resources and Alliance Resource Partners’ total debt
Let’s first look at the total debt of all coal miners for the period from fiscal 2018 to 2021.
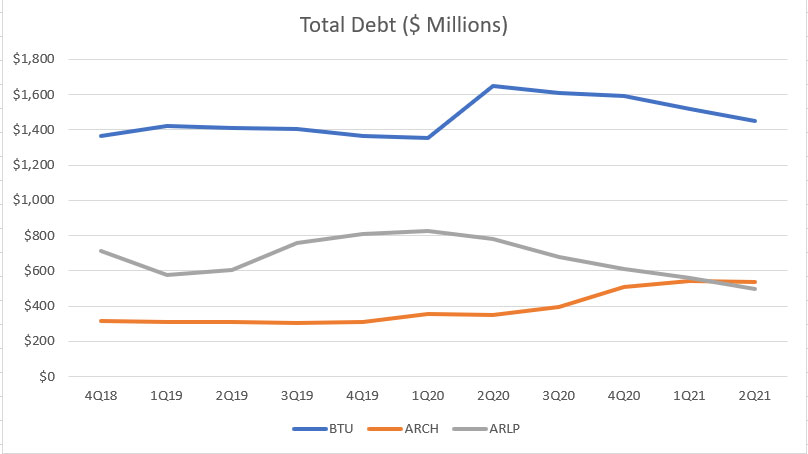
As shown in the chart above, Peabody or BTU has been the most indebted coal company by dollar amount in the last 3 years.
That said, BTU’s total debt has been more or less the same since 2018, and the debt figure clocked in at around $1.4 billion as of 2Q 2021, more than twice the numbers of other coal miners such as ARCH and ARLP.
Similarly, ARCH is the second most indebted coal miner after Peabody, with a total debt figure totaling as much as $536 million USD as of fiscal 2021 Q2.
ARCH’s debt figure was only slightly higher than that of ARLP which clocked in at $500 million in 2Q 2021.
In the last 3 years, ARLP’s total debt has slightly gone lower while Arch Resources’ total debt has been in the opposite direction which is up.
Therefore, in the 2nd quarter of 2021, Alliance Resource Partners’ $500 million total debt figure was the lowest since fiscal 2018 while Arch Resources’ $536 million debt figure reported in the same fiscal quarter was the highest since 2018.
In short, Peabody Energy has the most debt as of fiscal 2021 Q2, with total debt clocking in at $1.4 billion.
Total Cash On Hand
Peabody, Arch Resources and Alliance Resource Partners’ total cash on hand
A talk of debt without including the cash on hand data will deem incomplete.
Therefore, I have created the chart above to depict the coal miners’ total cash on hand.
The cash on hand figure shown in the chart above consists of only highly liquid assets such as cash and cash equivalents, marketable securities, short-term investments, and short-term restricted cash if there is any.
These assets are highly liquid and will be available immediately whenever they are needed.
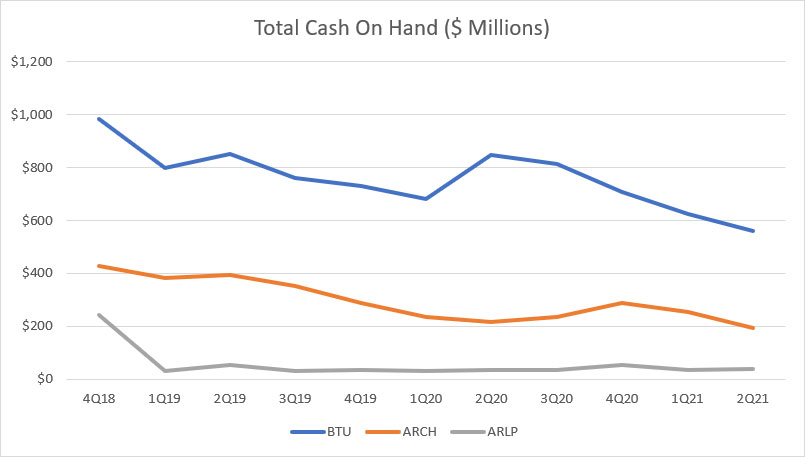
All told, as shown in the chart, Peabody Energy or BTU has been the coal miner with the most cash on hand in the last 3 years.
As of 2Q 2021, BTU’s cash on hand clocked in at nearly $562 million, more than double the number of ARCH and more than 10X higher than that of Alliance Resource Partners.
In the same fiscal quarter, ARCH’s cash on hand totaled as much as $200 million while ARLP’s figure came in at only $38 million, the lowest among all coal miners.
One notable trend observed for coal miners’ cash on hand is that they have been on a decline and the figures reported in 2Q 2021 were the lowest in the last 3 years.
Net Debt
Peabody, Arch Resources and Alliance Resource Partners’ net debt
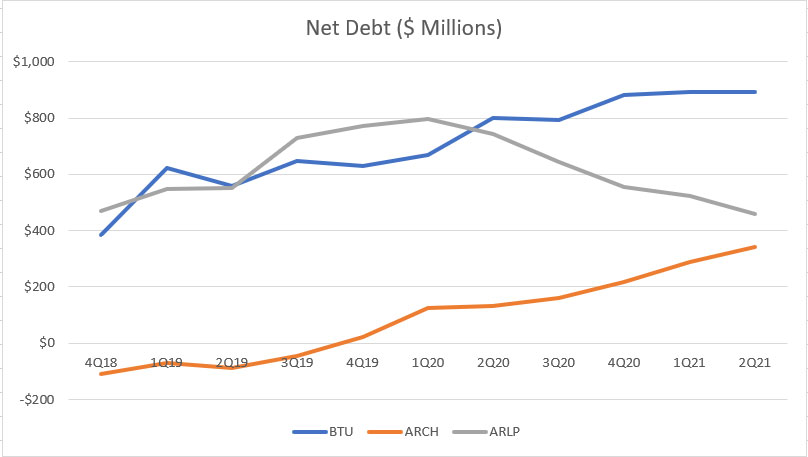
As discussed, most coal miners’ total debt has been on a rise while cash on hand is trending down, the end result is a growing net debt as shown in the chart above.
As seen, most coal miners, BTU and ARCH, in particular, are experiencing a growing net debt.
On the other hand, Alliance Resource Partners’ net debt has been on a decline, reaching a record low at about $460 million in fiscal 2021 2Q.
In the same fiscal quarter, both Peabody Energy and Arch Resources reported a net debt figure of $891 million and $343 million, respectively.
Arch Resources used to have more cash than debt as seen in the negative net debt figures reported in fiscal 2019.
However, Arch Resources’ growing indebtedness and dwindling cash on hand over the years has resulted in the increasing net debt, with the latest net debt figure reaching a record high as of fiscal 2021 2Q.
In short, Peabody Energy leads the pack when it comes to net debt despite having the most cash in the last 3 years.
Debt To Equity Ratio
Peabody, Arch Resources and Alliance Resource Partners’ debt to equity ratio
The debt to equity ratio is a measure of debt leverage with respect to shareholders’ equity.
Therefore, the higher the ratio, the more leverage a company has.
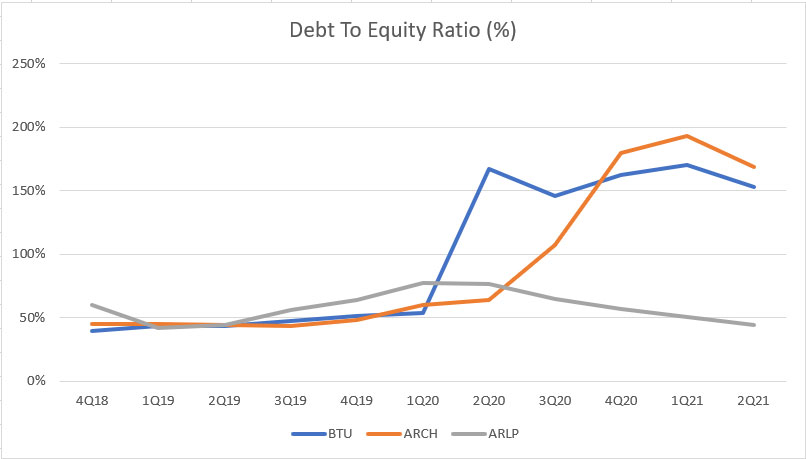
That said, according to the chart, both BTU and ARCH are the most leveraged coal miners as of fiscal Q2 2021 while ARLP is the least leveraged.
In fiscal 2Q 2021, BTU and ARCH reported a debt to equity ratio of 152% and 168% respectively while ARLP’s ratio clocked in at only 44%.
At these numbers, BTU’s leverage was $1.52 dollars of debt to every $1.00 dollar of equity while ARLP’s leverage came in at only $0.44 dollars of debt to every $1.00 dollar of equity.
Therefore, Peabody’s debt leverage was about the same as that of Arch Resources but more than 3X higher than that of Alliance Resource Partners.
Also, the debt to equity ratio of Peabody Energy and Arch Resources has been on a rise since fiscal 2018 while ARLP’s ratio has remained flat.
The growing indebtedness coupled with the declining shareholders’ equity has contributed to the sky-high debt to equity ratio for both BTU and ARCH.
Understandably, Peabody and Arch Resources had engaged in stock buyback prior to fiscal 2020, and this has partly contributed to the shrinking equity.
However, a $1.9 billion loss incurred in fiscal 2020 had further shrunk the net asset or equity of BTU, and hence, the record-high debt to equity ratio in fiscal 2020.
Arch Resources had a similar huge loss in fiscal 2020, with net income coming in at -$346 million, and this had knocked off as much as $300 million in retained earnings.
Debt To Asset Ratio
Peabody, Arch Resources and Alliance Resource Partners’ debt to asset ratio
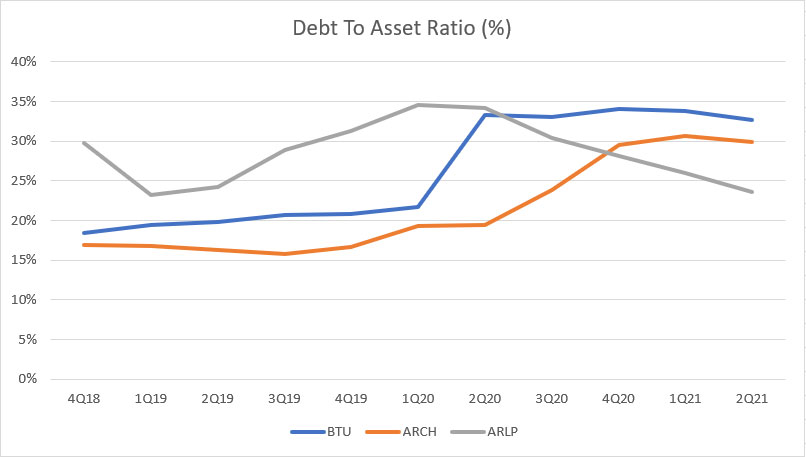
The debt to asset ratio is another leverage metric that measures the amount of debt with respect to total assets.
Therefore, the higher the ratio, the higher the debt leverage is with respect to total assets.
Again, according to the chart above, both BTU and ARCH are ranked at the top in terms of debt to asset ratio while ARLP is at the lowest ranking as of 2Q 2021.
ARLP used to have a much higher debt to asset ratio back in fiscal 2019 but BTU and ARCH’s ratios significantly climbed in fiscal 2020 and were much higher in fiscal 2021 compared to that of ARLP.
The growing debt to asset ratio for both BTU and ARCH indicates the growing indebtedness as well as the shrinking asset base of both companies over the years.
Total assets of a company can decline as a result of several reasons, including consistent losses, share buybacks, and a cash dividend payout which could significantly reduce the asset base of a company, especially when the company is incurring losses while still paying out a sizeable cash dividend and buying back stocks.
BTU’s declining asset value reported in the balance sheets may fall into this scenario where it had incurred heavy losses and still paid out a sizable cash dividend coupled with stock buyback prior to 2020.
For your information, BTU had suspended its stock buyback and cash dividend payment since fiscal 2020 as a result of the COVID-19 pandemic.
Arch Resources did a similar thing in fiscal 2020 by suspending its cash dividends and share buyback.
Capital Structure
Peabody, Arch Resources and Alliance Resource Partners’ equity to asset ratio
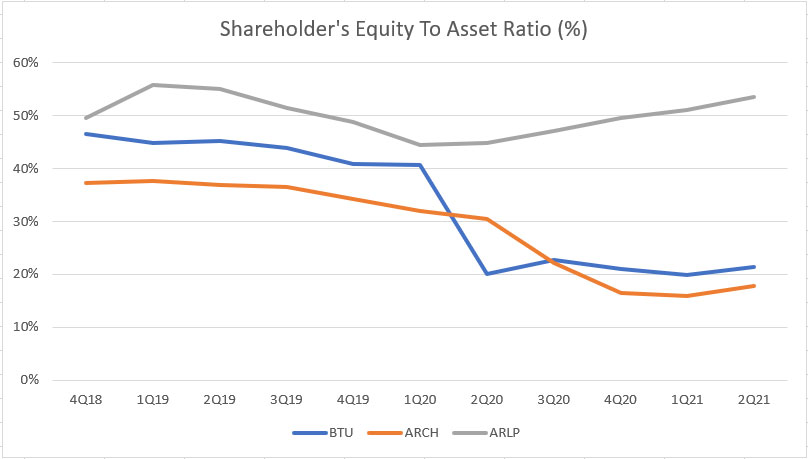
The chart above shows the shareholders’ equity to total assets ratio of BTU, ARCH and ARLP.
This ratio measures the capital structure of the coal miners.
For example, in BTU’s case, its capital structure was made up of only 20% of shareholders’ equity as of 2Q 2021 compared to nearly 50% back in 2019.
Similarly, Arch Resource’s capital structure was even lower, notably at less than 20% of shareholders’ equity as of 2Q 2021 compared to 40% reported in 2019.
For Alliance Resource Partners, its capital structure has remained the same, at about 50% of shareholders’ equity in the last 3 years.
Of all coal miners, ARLP’s capital structure is the most balanced, at 50% of debt or liabilities and 50% of stockholders’ equity while others are mostly made up of debt or liabilities.
In BTU’s case, debt or liabilities made up more than 80% of the company’s total assets and it’s even more for Arch Resources as of fiscal 2021 2Q.
While I can’t say that ARLP’s capital structure is superior to other coal miners, it is the most balanced.
Conclusion
In conclusion, Peabody Energy or BTU has the most debt in fiscal 2Q 2021, totaling $1.4 billion USD while Alliance Resource Partners was the least indebted at only $500 million.
Despite having the most debt, BTU also has the most cash on hand, totaling $562 million in 2Q 2021, more than twice the numbers of ARCH and ARLP.
Aside from debt and cash, BTU and ARCH are the most heavily leveraged, with debt to equity ratio exceeding 100% in fiscal 2021 Q2, compared to only 50% for ARLP.
BTU and ARCH’s high leverage ratio has been driven primarily by the growing indebtedness and the decreasing stockholders’ equity, due partly to the stock buybacks carried out by the companies prior to 2020 as well as the net loss incurred in 2020.
BTU’s total assets value has gone lower all these years and hence, driving up the debt to asset ratio while ARCH’s growing debt figures have driven up the ratio.
Of all coal miners, Alliance Resource Partners or ARLP has the most balanced capital or debt structure, which comprises 50% of debt and 50% of equity as of 2Q 2021.
References and Credits
1. All financial information in this article was obtained and referenced from the annual and quarterly reports which are available in the following links:
a) BTU Investors Relation
b) ARCH Earnings Call Results
c) ARLP’s Quarterly Results
2. Featured images in this article are used under Creative Commons Licenses and obtained from coal mining and Peabody Energy mine.
Top Statistics For Other Stocks
Disclosure
The content in this article is for informational purposes only and is neither a recommendation nor a piece of financial advice to purchase a stock.
If you find the information in this article helpful, please consider sharing it on social media and also provide a link back to this article from any website so that more articles like this one can be created in the future. Thank you!
