Beyond Meat’s comitted missions. Source: BYND Q1 2020 quarterly update.
Before discussing Beyond Meat’s profitability, let’s briefly introduce the company.
Beyond Meat (NASDAQ:BYND) is a food packaging company committed to providing plant-based meat products that look and taste exactly like real animal meat.
According to Beyond Meat, a typical consumer may not be able to tell the difference due to the plant-based meat products having the same texture and other sensory attributes as animal-based meat products.
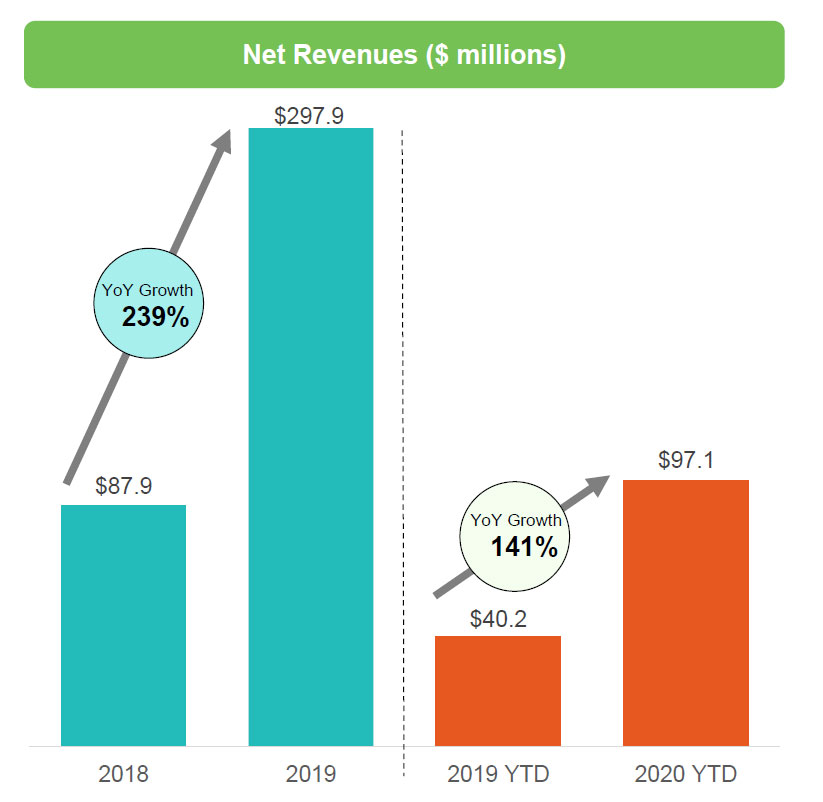
Over the past year, the demand for Beyond Meat’s plant-based products has skyrocketed, and revenue grew more than 200% year over year in 2019.
Beyond Meat growth. Source: BYND Q1 2020 update letter.
While Beyond Meat’s growth has been on fire from all aspects, it may look like a different story when it comes to profitability.
In this article, we will examine several of Beyond Meat’s profitability metrics, including its gross profits, operating profit, net profit, earnings per share and EBITDA from a TTM or trailing 12-month perspective.
Let’s read on!
Beyond Meat’s Profitability Topics
1. Net Revenue
2. Gross Profit
3. Operating Profit
4. Net Profit
5. Earnings Per Share
6. Adjusted EBITDA
7. Conclusion
Beyond Meat’s Net Revenue
Beyond Meat’s net revenues
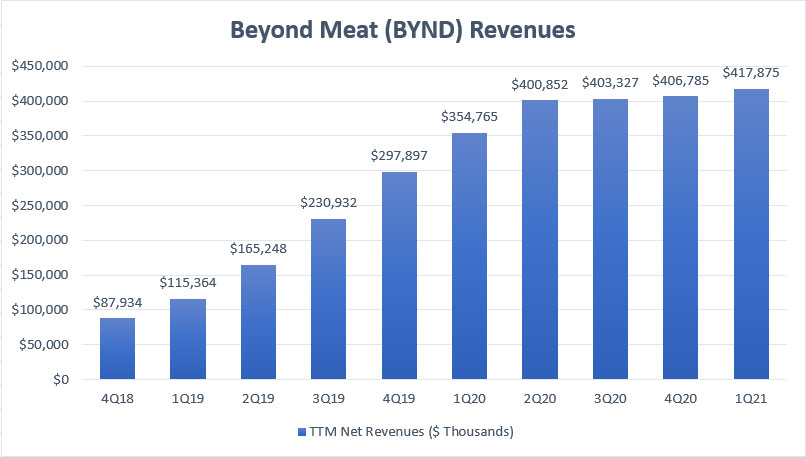
Let’s start with Beyond Meat’s revenue chart as shown above.
The chart above indicates Beyond Meat’s net revenue for the period between fiscal 2018 and 2021 on a TTM basis.
Beyond Meat’s TTM net revenue registered the most growth in the early years such as fiscal 2018 and fiscal 2019, with net sales almost quadrupling in a period of only 1 fiscal year between 4Q 2018 and 4Q 2019.
However, Beyond Meat’s TTM revenue has been flat since fiscal 2020 2Q, after reaching $400 million in the same quarter.
As of fiscal 1Q 2021, Beyond Meat’s TTM net revenue totaled $418 million, representing a year-on-year increase of as much as 18%.
Beyond Meat’s revenue expansion has been primarily driven by the increase in distribution channels in both domestic and international markets.
Beyond Meat also has launched several new products since 2019, including Beyond Sausage, Beyond Fried Chicken, and Beyond Beef, which have primarily contributed to the company’s sales growth.
Quarterly growth remained flat since fiscal Q2 2020, due mainly to the COVID-19 disruptions which have seriously affected its Food Services segment.
While Beyond Meat’s revenue growth has been nothing less than exceptional over the past several years, the profitability may look different.
Therefore, let’s hop on and proceed to look at the gross profit which is shown in the next chart.
Beyond Meat’s Gross Profit
Beyond Meat’s gross profits
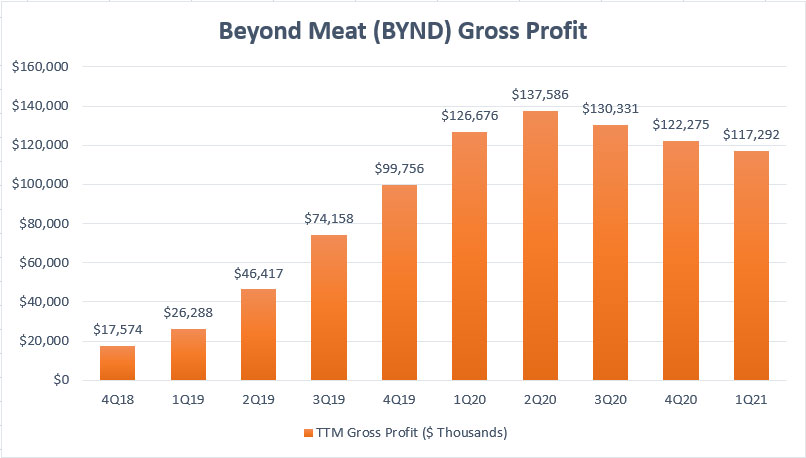
Beyond Meat’s gross profit is derived from revenue net of costs of goods sold.
Similarly, Beyond Meat’s TTM gross profits registered the most growth in the early years such as in fiscal 2018 and 2019.
Since fiscal 2020, Beyond Meat’s TTM gross profits have, in fact, declined sequentially after topping out at $137 million in fiscal 2Q 2020.
As of fiscal 2021 Q1, Beyond Meat’s TTM gross profit totaled $117 million, representing a year-over-year decline of 8%.
In the 1st quarter, while Beyond Meat’s revenue has increased year-over-year, its gross profitability has declined, indicating a margin contraction, driven primarily by higher costs of productions.
Beyond Meat’s Operating Profit
Beyond Meat’s operating profits
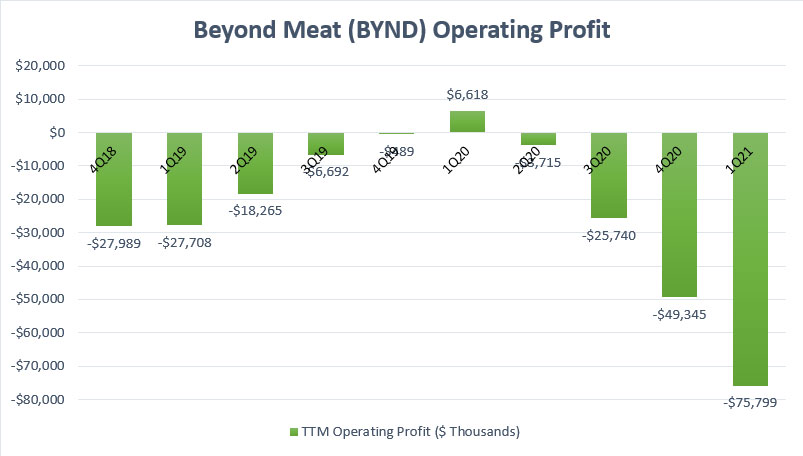
Beyond Meat’s operating profits look drastically different from its predecessors.
In Beyond Meat’s case, its TTM operating profits have been entirely negative except for 1 fiscal quarter, indicating that the company has been incurring losses in operations all these years.
While Beyond Meat’s operating losses have narrowed significantly prior to fiscal 2020, the COVID-19 pandemic has reversed all of that in fiscal 2020.
As seen in the chart, Beyond Meat suffered its biggest operating losses in fiscal 2020, to the tune of $76 million as of 1Q 2021 on a TTM basis.
What is worse is that the operating losses keep increasing since fiscal 2Q 2020 and reached the worst as of 1Q 2021, even bigger than its prior losses reported back in fiscal 2018.
Beyond Meat’s Net Profit
Beyond Meat’s net profits
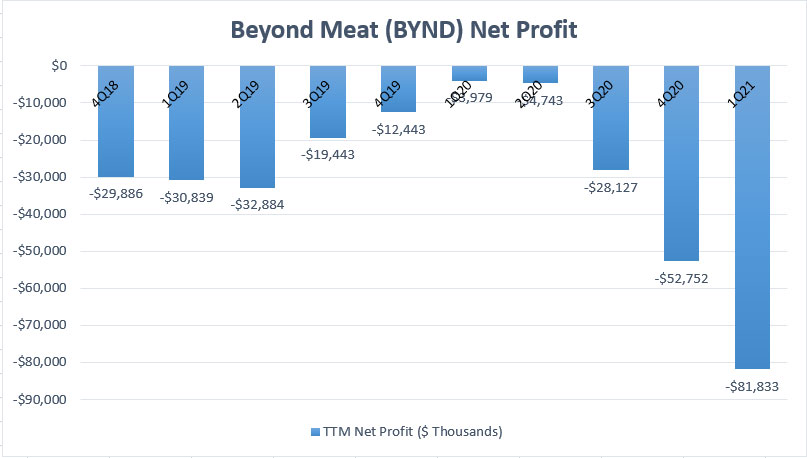
Beyond Meat experienced the same downtrend in terms of net profitability as seen in the chart above.
Prior to the COVID age, Beyond Meat’s net profits were seen narrowing and reached its smallest loss in 1Q 2020 at about $4 million on a TTM basis.
However, post-1Q 2020, Beyond Meat’s net losses worsened and kept increasing to as much as $82 million in fiscal 1Q 2021, a new low for the company.
In short, Beyond Meat suffered its biggest net loss during the COVID age.
Beyond Meat’s Earnings Per Share (EPS)
Beyond Meat’s earnings per share
One more profitability metric that we will examine is Beyond Meat’s earnings per share or EPS.
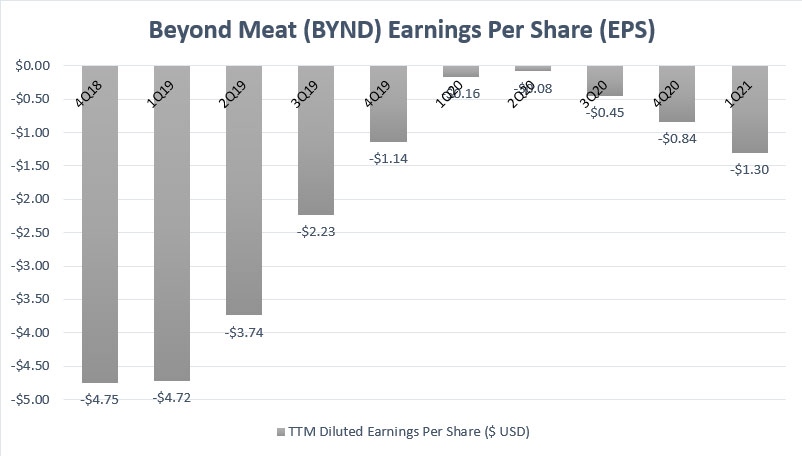
When we look at the chart above, the trend is similar to the company’s net profit.
Accordingly, Beyond Meat had the most losses per share back in fiscal 2018.
Similar to the net profits, Beyond Meat’s EPS has been entirely negative since fiscal 2018, illustrating that the company has been having losses all these years.
However, the company’s losses per share had narrowed significantly over the years and reached the smallest at -$0.08 in fiscal 2Q 2020 on a TTM basis.
When the COVID-19 came, Beyond Meat’s losses per share worsened again and increased to -$1.30 USD per share in fiscal 2021 1Q on a TTM basis.
Beyond Meat’s Adjusted EBITDA
Beyond Meat’s adjusted EBITDA
Beyond Meat’s adjusted EBITDA is a measure of the company’s cash flow from operations but before taking into account the changes in working capital.
According to Beyond Meat, the adjusted EBITDA excludes certain items that are deemed non-recurring and not related to the core performance of the company, including but not limited to expenses such as COVID-19 costs, share-based compensation expenses, restructuring costs, etc.
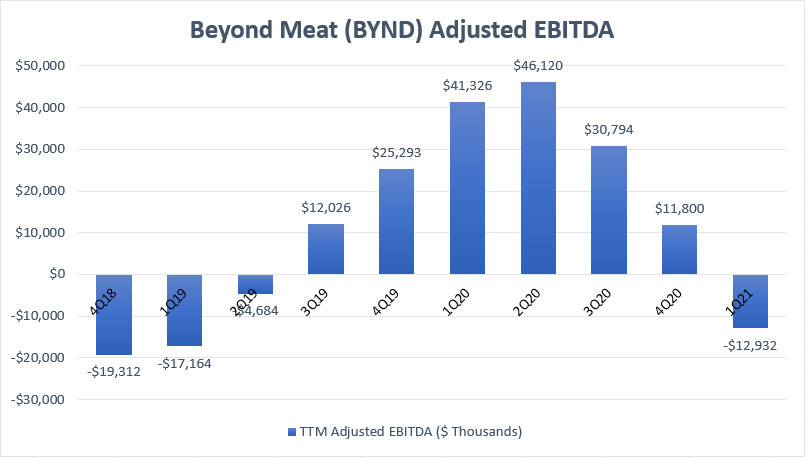
All told, Beyond Meat’s EBITDA had been on a rise prior to the arrival of COVID, reaching as much as $46 million on a TTM basis in fiscal Q2 2020, a new record for the company.
However, the arrival of COVID-19 has changed all that and reversed Beyond Meat’s EBITDA growth starting in 2020.
As seen from the chart, Beyond Meat’s TTM EBITDA has declined since reaching its peak in 2Q 2020 and even became negative as of 2021 Q1 at -$13 million, suggesting that the company’s core businesses have significantly weakened.
At this figure, Beyond Meat’s core businesses were consuming cash instead of producing it.
What is worse is that the adjusted EBITDA represents operating cash flow prior to the changes in working capital.
If we take into consideration Beyond Meat’s working capital, the operating cash flow would be a lot worse than the EBITDA, meaning that the company’s core businesses actually burned even more cash than the EBITDA.
In short, Beyond Meat’s businesses are not pandemic proved and have significantly weakened during the COVID age.
Conclusion
To recap, Beyond Meat is a unique company in the sense that it “manufactures” meat straight from its factories with raw materials that come from plants instead of animal protein.
From the profitability analysis, we can see that the company’s explosive revenue growth between 2018 and 2021 has not translated into profits.
Beyond Meat has only managed to be profitable at the gross profit level. Other than that, the company has suffered huge losses in operating income, net income, and earnings per share in most quarters and even EBITDA as of 2021 1Q.
Moreover, Beyond Meat’s profitability has been badly affected by the pandemic as reflected from all of the declining profitability metrics post-2Q 2020.
As such, Beyond Meat’s profits are not pandemic proved as they have not been shielded from the negative disruptions of the COVID-19.
References and Credits
1. All financial figures in charts were obtained and referenced from Beyond Meat’s financial statements available in BYND SEC Filings.
2. Featured image was used under Creative Common Licenses and obtained from Marco Verch.
Other Stock Analysis That You May Enjoy
Disclosure
If you find the information in this article helpful, please consider sharing it on social media and also provide a link back to this article from any website so that more articles like this one can be created in the future.
