Dave and Buster’s. Image Source: Flickr
Dave and Busters (NASDAQ:PLAY) ran a very successful business and was very profitable back then.
The company had even started buying back shares and paying cash dividends starting in fiscal 3Q 2018.
In short, Dave and Busters was flush with cash prior to the COVID age.
However, Dave and Buster’s fortune seemingly changed in the blink of an eye came the COVID age.
The company was on the brink of a collapse when nearly 100% of its stores were forcibly closed, thereby completely cutting off its revenue source.
As a result, Dave and Buster’s stock price crashed to less than $10 USD per share in mid-2020.
In fiscal 1Q 2020, Dave and Busters announced a series of cost-cutting measures, including indefinitely suspending its stock buyback and dividends.
The company has even taken on a large debt and issued common stock to raise cash throughout 2020.
In this article, we are going to look at Dave and Buster’s dividend history and find out what really happened to the company from a financial perspective.
Let’s find out!
Dave and Buster’s Dividend Topics
1. Dividend Yield
2. Quarterly Dividend Declared Per Share
3. TTM Dividend Declared Per Share
4. Quarterly Dividends Declared
5. TTM Dividends Declared
6. Quarterly Dividends Paid
7. TTM Dividends Paid
8. Dividends To Earnings Payout Ratio
9. Dividends To Free Cash Flow Payout Ratio
10. Summary
Dave and Buster’s Dividend Yield
Dave And Buster’s dividend yield history
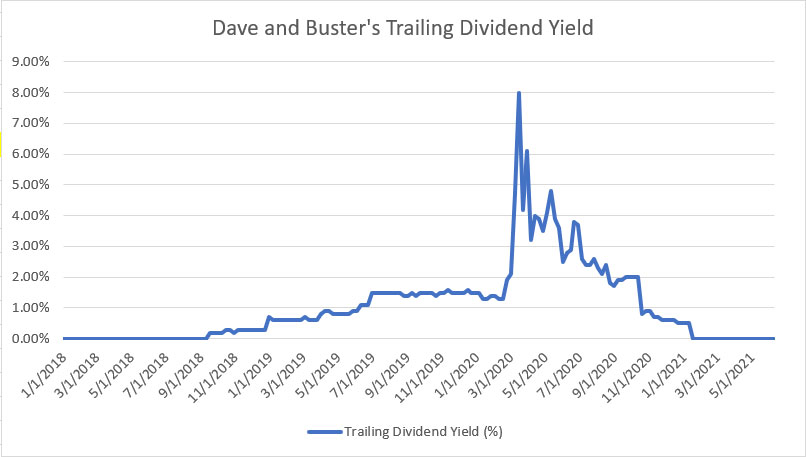
Let’s first look at Dave and Buster’s dividend yield which is shown in the chart above for the period from 2018 to 2021.
For your information, Dave and Buster started paying cash dividends in fiscal 3Q 2018 at an initial dividend rate of $0.15 USD per share.
As a result, the starting dividend yield was around 0.5% and slowly rose to 1.5% in mid-2019 when Dave and Busters increased the payout to $0.16 USD per share by the end of fiscal 2019.
When COVID came in early 2020, Dave and Busters suspended the cash dividends.
What followed was the crash of Dave and Buster’s stock prices, and this has led to a surging dividend yield that reached as high as 8% in mid-2020 as seen in the chart.
While Dave and Busters had suspended the cash dividend in fiscal 1Q 2020, the dividend yield continued to exist throughout 2020 because it was calculated on a trailing 12-month basis.
As Dave and Busters has not resumed paying any cash dividends post-4Q 2019, the dividend yield started to decline and reached 0% by 1Q 2021.
Dave and Busters will most likely not reinstate any cash dividends in the foreseeable future considering that its latest financial position has not fully recovered to the pre-COVID level.
Dave and Buster’s Dividend Declared Per Share (Quarterly)
Dave And Buster’s quarterly dividend declared per share
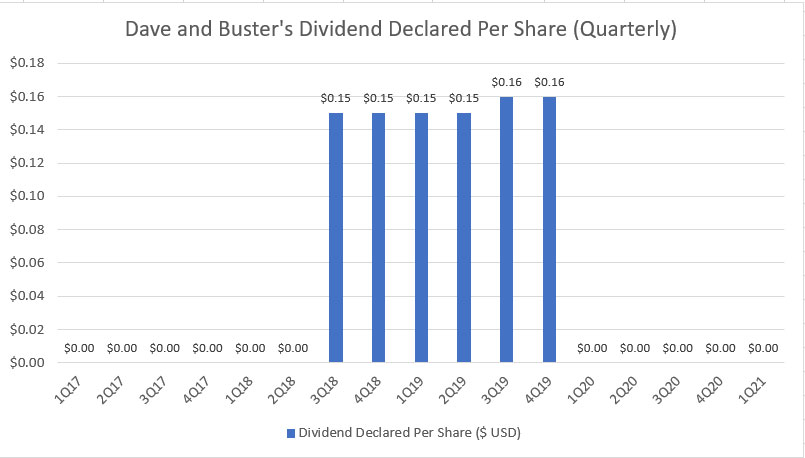
From a per-share basis, Dave and Buster’s starting dividend rate was $0.15 USD per quarter.
After persistently paying cash dividends for 4 consecutive quarters since fiscal 2018 Q3, Dave and Busters raised the dividend rate to $0.16 USD per share in fiscal 2019 Q3, representing a 7% increment.
Dave and Buster’s final dividend declared occurred in fiscal 2019 Q4 at $0.16 USD per share.
Stockholders who held Dave and Buster’s shares until Jan 10, 2020 would have received the cash dividend payment by Feb 10, 2020.
Dave and Buster’s Dividend Declared Per Share (TTM)
Dave And Buster’s TTM dividend declared per share
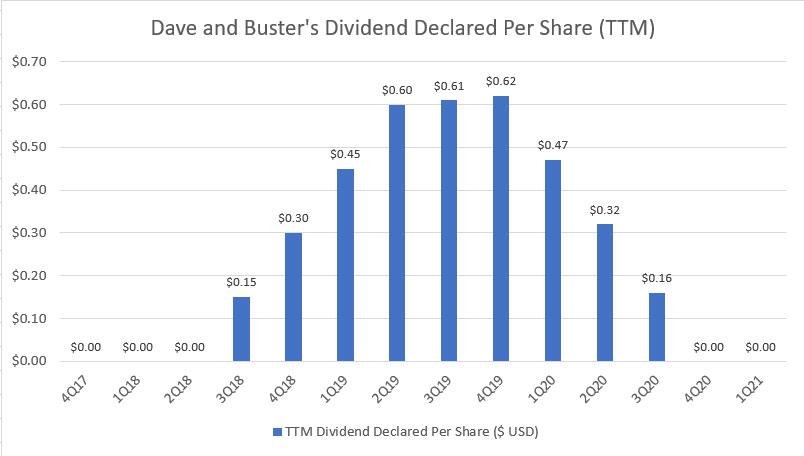
From a TTM or trailing 12-month perspective, Dave and Buster’s dividend declared per share was seen increasing since the company started declaring cash dividends in fiscal 2018 Q3.
As Dave and Busters continued to declare the quarterly dividends, the dividend rates accumulated in subsequent quarters and topped out at $0.62 USD per share in fiscal 2019 Q4.
When the COVID-19 pandemic hit in early 2020, Dave and Busters suspended the quarterly cash dividends indefinitely, and this had led to the decline of the TTM dividend rates since fiscal 2020.
As of fiscal Q1 2021, Dave and Buster’s TTM dividend rate dropped to $0.00 USD per share.
In the foreseeable future, Dave and Busters will not be resuming the quarterly dividend considering that the company’s TTM sales, as well as profits, were still below its pre-COVID level as of fiscal Q1 2021.
Dave and Buster’s Dividends Declared (Quarterly)
Dave And Buster’s quarterly dividend declared
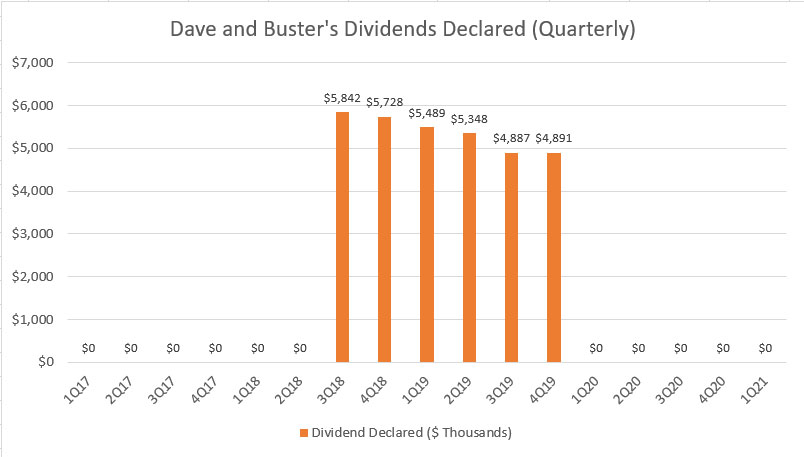
The quarterly dividend declared is essentially the same as the dividends declared per share except that it is not on a per-share basis.
Therefore, Dave and Buster’s dividend declared is the total amount of cash expected to be paid out after the dividend is declared.
Keep in mind that Dave and Busters may not necessarily pay out the dividends in the same fiscal quarter as they are declared.
All told, the expected cash outflow for dividends declared totaled as much as $5.8 million in fiscal Q3 2018.
In subsequent quarters, Dave and Buster’s cash outflow for dividend declared was seen declining and reached slightly below $5 million in fiscal Q4 2019.
The decreasing cash outflow was primarily due to the decreasing common stocks outstanding, driven in part by the continuous stock buybacks carrying out by the company.
Although Dave and Busters had maintained and subsequently increased the dividend declared per share to $0.16 USD, the cash expected to be paid continued to decline throughout the shown period, driven primarily by the share buybacks.
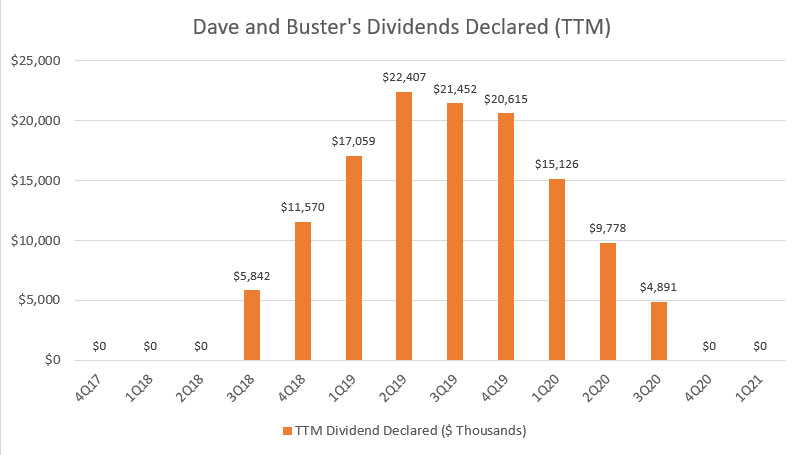
Dave and Buster’s Dividends Declared (TTM)
Dave And Buster’s TTM dividend declared
From a TTM perspective, the expected cash outflow for dividends declared topped out even earlier in fiscal 2019 Q2 at $22 million.
Since then, Dave and Buster’s TTM cash outflow for dividends declared had declined, driven in part by the stock buybacks and the suspension of the cash dividends in subsequent quarters.
For your information, Dave and Busters also has indefinitely suspended the stock buyback since fiscal Q1 2020.
As of Q1 2021, Dave and Buster’s TTM cash outflow for dividends declared has reached $0.
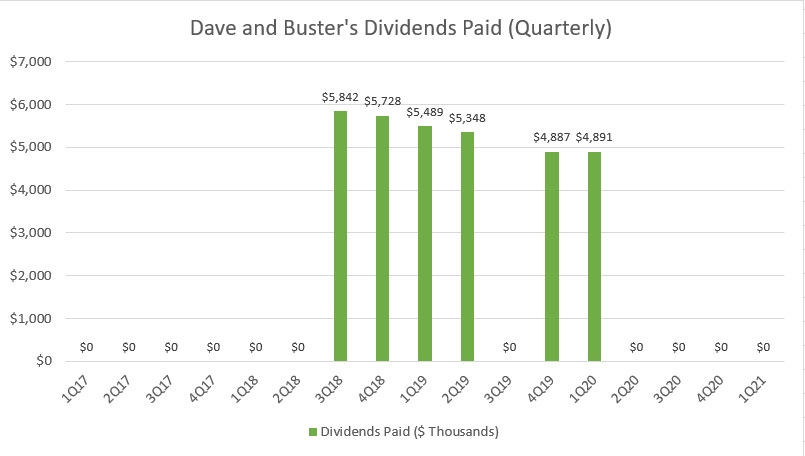
Dave and Buster’s Dividends Paid (Quarterly)
Dave And Buster’s quarterly dividend paid
The dividends paid figures are the cash paid on dividends declared in the same or prior fiscal quarters.
These figures should be the same as the cash outflow for dividends declared which we saw previously.
However, the cash figures can sometimes differ from the accrued figures if the company has preferred share dividends and dividends for minority interests.
Having said that, Dave and Buster’s cash paid shown in the chart above is exactly the same as the cash outflow for dividend declared seen in prior charts.
The only difference is that the fiscal period in which the dividend paid is recorded.
For example, cash paid was empty in fiscal 3Q 2019, meaning that Dave and Busters did not pay any cash dividend in this fiscal quarter despite having a dividend declared in the same fiscal quarter.
Similarly, the cash paid on dividends had been steadily declining, driven primarily by the decreasing common stock outstanding.
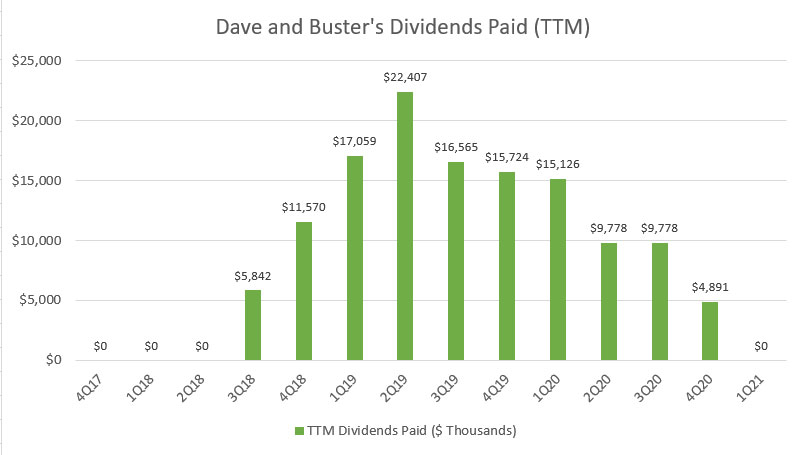
Dave and Buster’s Dividends paid (TTM)
Dave And Buster’s TTM dividend paid
The TTM figures are nearly the same as the cash outflow for dividends declared except for certain fiscal periods in which the dividends were paid.
From a cash perspective, the TTM figures topped out at $22 million in fiscal 2019 Q2 and reached slightly below $5 million in fiscal 2020 Q4.
As of fiscal 1Q 2021, Dave and Buster’s TTM cash paid on dividends has reached $0, as the company has indefinitely suspended the cash dividends.
Dave and Buster’s Dividends Declared To Earnings Payout Ratio (TTM)
Dave And Buster’s dividend to earnings payout ratio
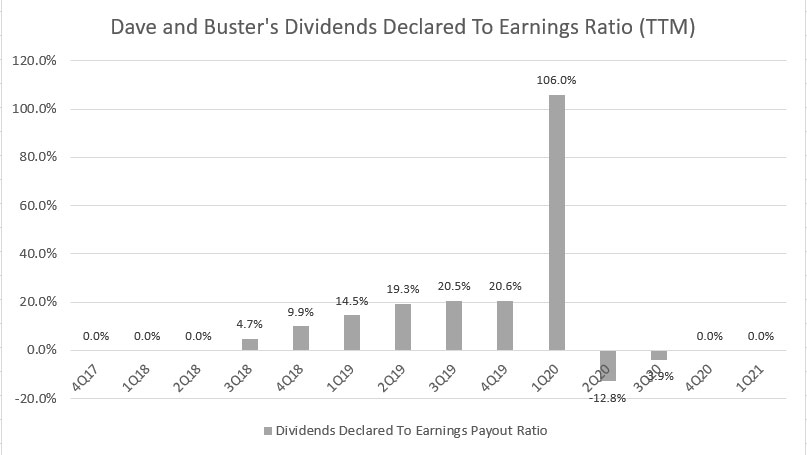
The dividend to earnings payout ratio measures the percentage of net profit or earnings that are declared or paid as dividends.
This ratio measures the sustainability of the dividends declared with respect to profitability.
That said, according to the chart, Dave and Busters has a very low dividend-to-earnings payout ratio when it first started paying cash dividends, notably at less than 5%.
As the company continued with the cash dividend payments in subsequent quarters, the earnings payout ratio steadily increased and reached 20% in fiscal 4Q 2019, illustrating that Dave and Buster’s profits had been more than enough to cover the dividends declared.
However, the ratio shot beyond 100% in fiscal 1Q 2020, driven by a sudden decline in net profit or net earnings in the same quarter.
In subsequent quarters, Dave and Buster’s earnings payout ratio even turned negative, meaning that the company had no profits to cover the dividends declared.
Prior to the dividend suspension which occurred in fiscal 1Q 2020, there were no warnings or any signs of an unsustainable cash dividend as the earnings payout ratio had been considerably low.
The dividend warnings only came in fiscal 1Q 2020 when the ratio reached more than 100% but it was already too late as Dave and Busters had already announced a dividend suspension in the prior quarter.
In Dave and Buster’s case, the plunge in profitability or net earnings was too drastic and investors would probably be caught off-guard by the sudden change of events.
In short, Dave and Buster’s management has a better view of the company and had probably foreseen an unprecedented disaster that was going to happen and hence, the dividend suspension even before the earnings release in fiscal 1Q 2020.
Dave and Buster’s Dividends Paid To Free Cash Flow Payout Ratio (TTM)
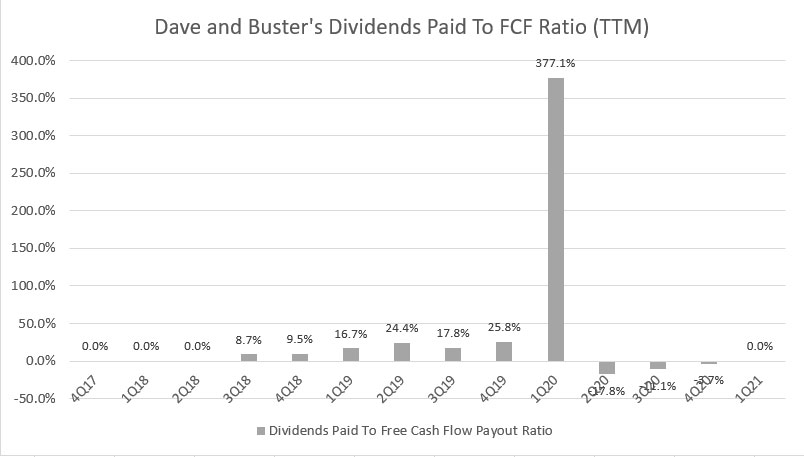
Dave And Buster’s dividend to free cash flow payout ratio
Similarly, the dividend to free cash flow payout ratio measures the percentage of free cash flow that is paid out as dividends.
This ratio measures the sustainability of the cash dividends paid with respect to free cash flow.
According to the chart, Dave and Buster’s free cash flow payout ratio came to about 9% when the company started paying its 1st dividend.
Subsequently, the free cash flow payout ratio increased steadily as the company continued paying its quarterly dividends.
The ratio reached 26% in fiscal 2019 4Q before surging to more than 300% in fiscal 2020 1Q.
Prior to the arrival of the pandemic, Dave and Busters had plenty of free cash flow to cover the cash dividends paid, notably at 26% of coverage in fiscal 2019 4Q.
The pandemic hit Dave and Busters really hard as the company’s free cash flow quickly dried up as seen in fiscal 1Q 2020.
In the same fiscal quarter, the company’s free cash flow payout ratio reached more than 300%, suggesting the generated free cash flow was not sufficient to sustain the cash dividend payment.
Similar to the earning payout ratio, Dave and Buster’s free cash flow payout ratio couldn’t tell any warnings prior to the dividend suspension as the ratio was considerably low at only 26% in fiscal 2019 4Q.
All in all, Dave and Buster’s management had better insight into the financial health of the company and had quickly made the decision to suspend not only the cash dividends but also the stock buyback.
Summary
Dave and Buster’s cash dividends lasted only 6 quarters.
Prior to the COVID age, Dave and Busters was a cash cow and was making profits.
All of that came crashing down when the pandemic hit and the company was on the brink of bankruptcy.
Dave and Busters announced several cost-cutting measures, including dividend and stock buyback suspension, aside from taking on large debt and issued common stocks to raise cash.
As of fiscal Q1 2021, Dave and Busters was still recovering from the COVID-19 damages and will not resume paying dividends in the foreseeable future despite having most of its stores opened by May 2021.
While Dave and Busters had delivered excellent financial results prior to the pandemic, its business quickly collapsed in a matter of only 1 fiscal quarter when the pandemic hit.
The lesson learned here is that Dave and Buster’s business model is not pandemic-proved and is likely not recession-proved either.
References and Credits
1. Financial figures in this article were obtained and referenced from Dave and Buster’s financial reports which can be found in Dave and Buster’s Earnings Releases.
2. Featured images in this article are used under creative commons license and sourced from the following websites: Mike Mozart and JJBers.
Other Stock Analysis That May Help You
Disclosure
If you find the information in this article helpful, please consider sharing it on social media and also provide a link back to this article from any website so that more articles like this one can be created in the future.
