
Tesla battery & pack production line. Source: Tesla Q1 2020 investor update letter.
It’s difficult to value the worth of a company. This situation is more apparent when it comes to valuing Tesla.
When this article was published, Tesla’s stock surged past USD$200 per piece post-3-to-1 split, bringing the company’s total market cap to more than $600 billion.
At this valuation, Tesla has notably overtaken Toyota, Volkswagen, GM, and Ford as well as the rest of the automobile companies’ market cap combined, and become the world’s most valuable automobile company.
Is Tesla worth this much? Let’s take a look.
In this article, we will explore Tesla’s stock valuation from the perspective of several ratios.
These ratios are Tesla’s price-to-revenue or sales, price-to-book value, price-to-gross profit, price-to-cash flow, price-to-EBITDA, price-to-earnings before interest and taxes (EBIT) as well as the price-to-earnings ratio.
We will look at these ratios over several periods to see how the company has been valued from a historical standpoint.
Let’s start with the following topics!
Tesla Valuation Topics
1. Market Capitalization
2. Price To Sales Ratio
3. Price To Book Ratio
4. Price To Gross Profit Ratio
5. Price To EBIT Ratio
6. Price To EBITDA Ratio
7. Price To Operating Cash Flow Ratio
8. Price To Free Cash Flow Ratio
9. Price To Earnings (PE) Ratio
10. Summary
11. Tesla Valuation Spreadsheet
12. References and Credits
13. Disclosure
Tesla’s Market Capitalization
Tesla market capitalization
Let’s first look at Tesla’s market cap before diving into the ratios.
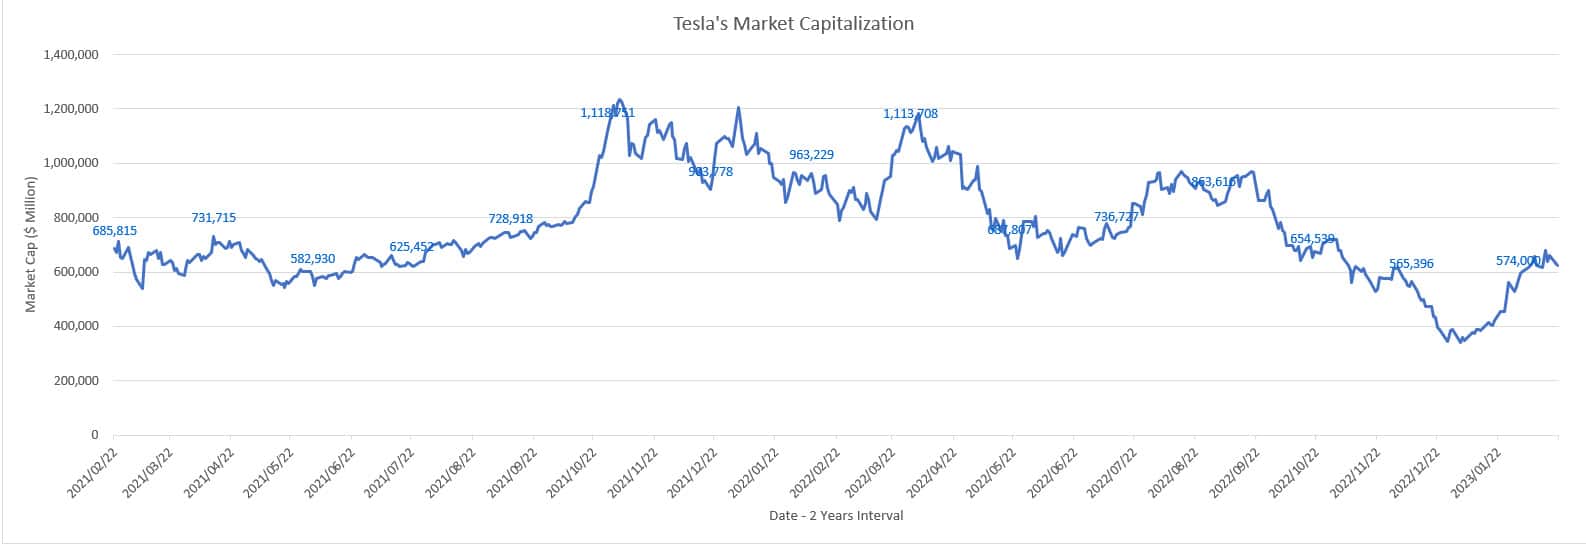
The chart above shows Tesla’s total market capitalization for the period from 2016 to 2023.
Over the past 2 years, Tesla’s total market cap has remained roughly flat at $600 billion as shown in the chart.
Prior to 2022, Tesla’s market capitalization logged more than $1 trillion USD between 2021 and early 2022.
This figure has been on a decline in the last 2 years and tumbled to a new low of below $400 billion at one time in 2022 year-end.
As of Feb 2022, Tesla’s market cap came in at $625 billion, a record high in 2023 year-to-date.
If you have invested $1,000 in Tesla’s stock in 2021 (adjusted for stock split), your return on investment would be roughly flat considering the relatively stagnant market cap in the last 2 years.
Therefore, your $1,000 investment 2 years ago would stay flat at $1,000 by Feb 2023.
Also, have you noticed from the chart that Tesla’s market cap has taken a severe hit at year-end 2022, tumbling below $400 billion for the first time since 2021?
The decline in market cap has been mainly caused by a multitude of issues, including the COVID-19 scare in China, as well as the supply chain and parts issues which have nearly crippled the automotive industry in China.
However, Tesla’s stock price emerged from the drop unscattered in subsequent periods and moved even higher after the re-opening of China.
Tesla’s Price To Sales Ratio
Tesla price to sales ratio
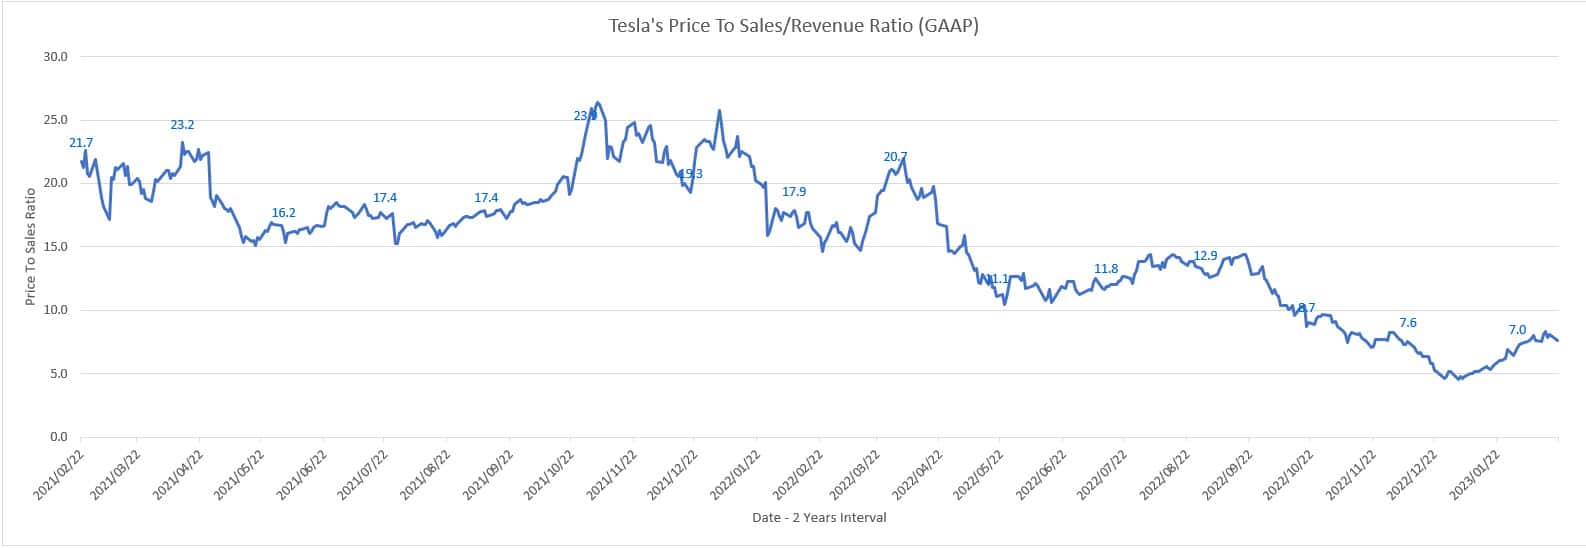
In terms of price to sales, Tesla’s stock valuation has gone through a dramatic change.
Tesla used to have a price-to-sales ratio of more than 20.0X prior to 2022.
This double-digit valuation ratio has been at this level for nearly 2 years before it dramatically tumbled to below 10X as of 2023.
As of Feb 2023, Tesla’s stock valuation with respect to TTM revenue declined to only 7.0X, a record low since 2021.
Tesla’s Price To Book Value Ratio
Tesla price to book value ratio
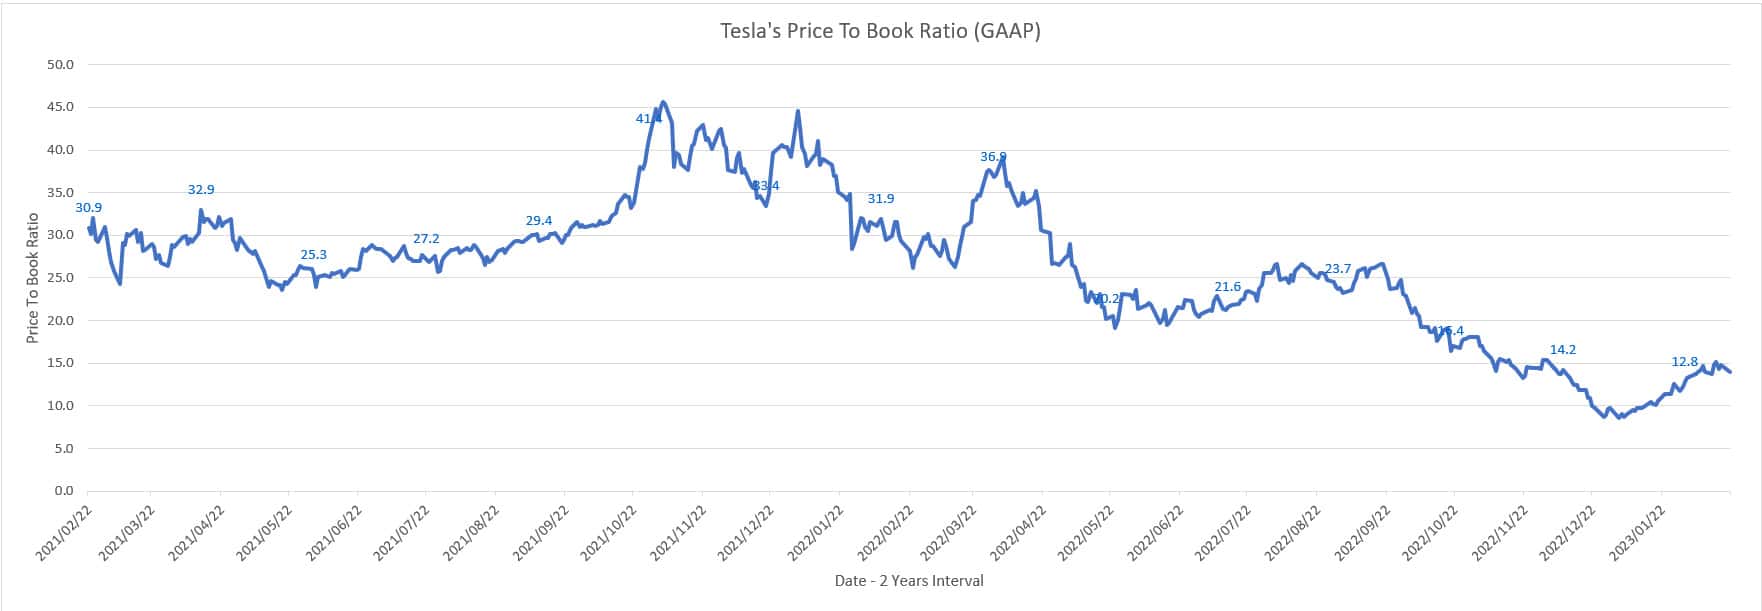
The chart above shows Tesla’s valuation with respect to shareholders’ equity for the period between 2016 and 2023.
Tesla’s shareholder equity or book value is the net worth or the net assets after accounting for the liabilities of the company.
Prior to 2022, Tesla’s price-to-book ratio was significantly higher, notably at more than 20.0X.
However, this valuation has been on a decline and came in at only 13.0X as of Feb 2023.
At this valuation, Tesla’s stock price was trading at about 13 times the company’s net worth or book value.
From a comparison perspective, Toyota’s price to equity was only slightly above 1.0X as of Feb 2023.
GM and Ford’s price-to-equity ratio was about the same as that of Toyota according to Yahoo Finance during the same period.
In short, Tesla’s valuation with respect to shareholder’s equity was so much higher than its peers even though it was already trading at record lows as of Feb 2023.
Tesla’s Price To Gross Profit Ratio
Tesla price to gross profit ratio
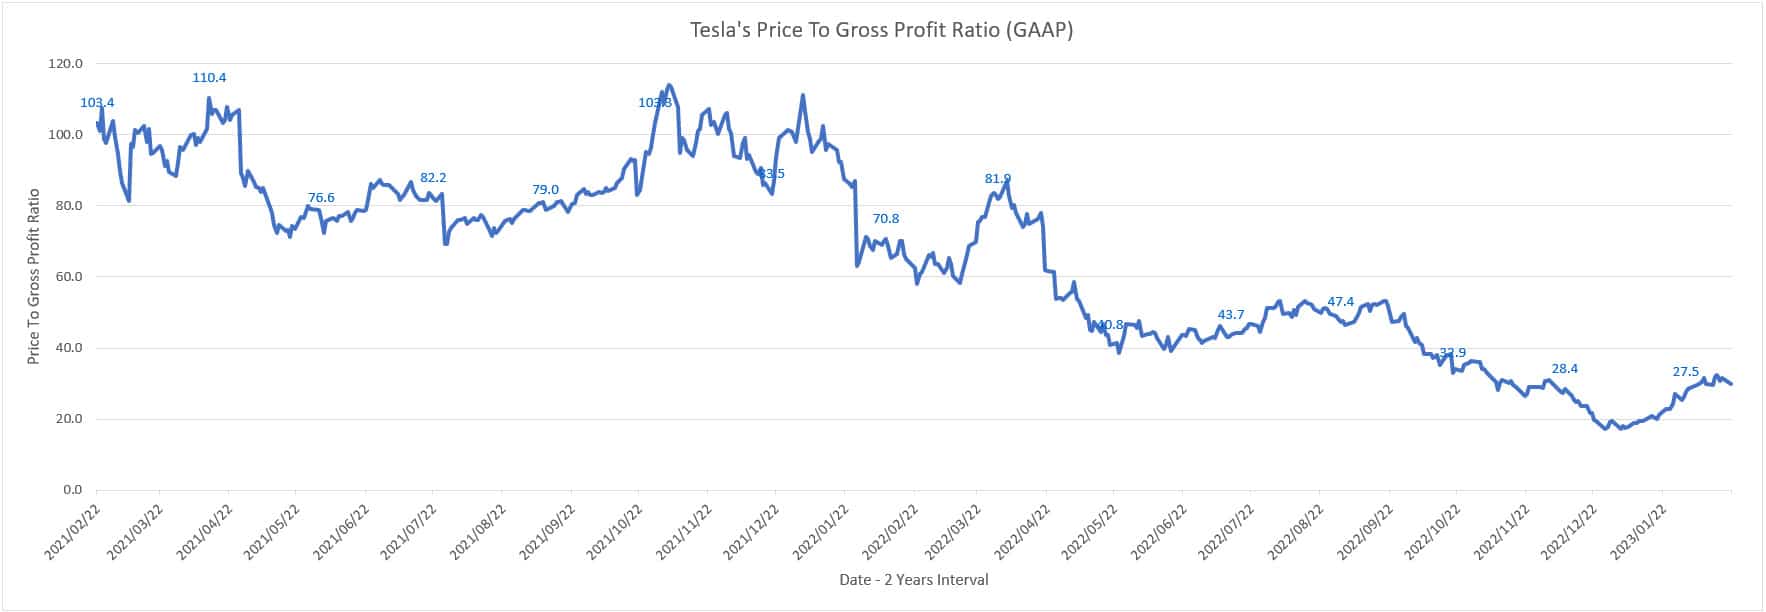
In terms of gross profit, Tesla’s valuation also experienced a similar trend as seen in the plot above.
As seen, Tesla’s market cap to gross profit has been on a decline, tumbling to only 27.5X as of Feb 2023.
Prior to 2022, Tesla’s price-to-gross profit averaged more than 80.0X.
This ratio was only around 40.0X in 2022 and was even lower as of 2023, illustrating the declining valuation of Tesla’s stock.
Tesla’s Price To EBIT Ratio
Tesla price to EBIT ratio
EBIT stands for earnings before interest and taxes. In other words, EBIT also represents operating income or profit.
Tesla’s EBIT covers almost all costs of doing business including costs of revenues, R&D and SGA expenses.
However, the EBIT does not cover interest expenses and taxes.
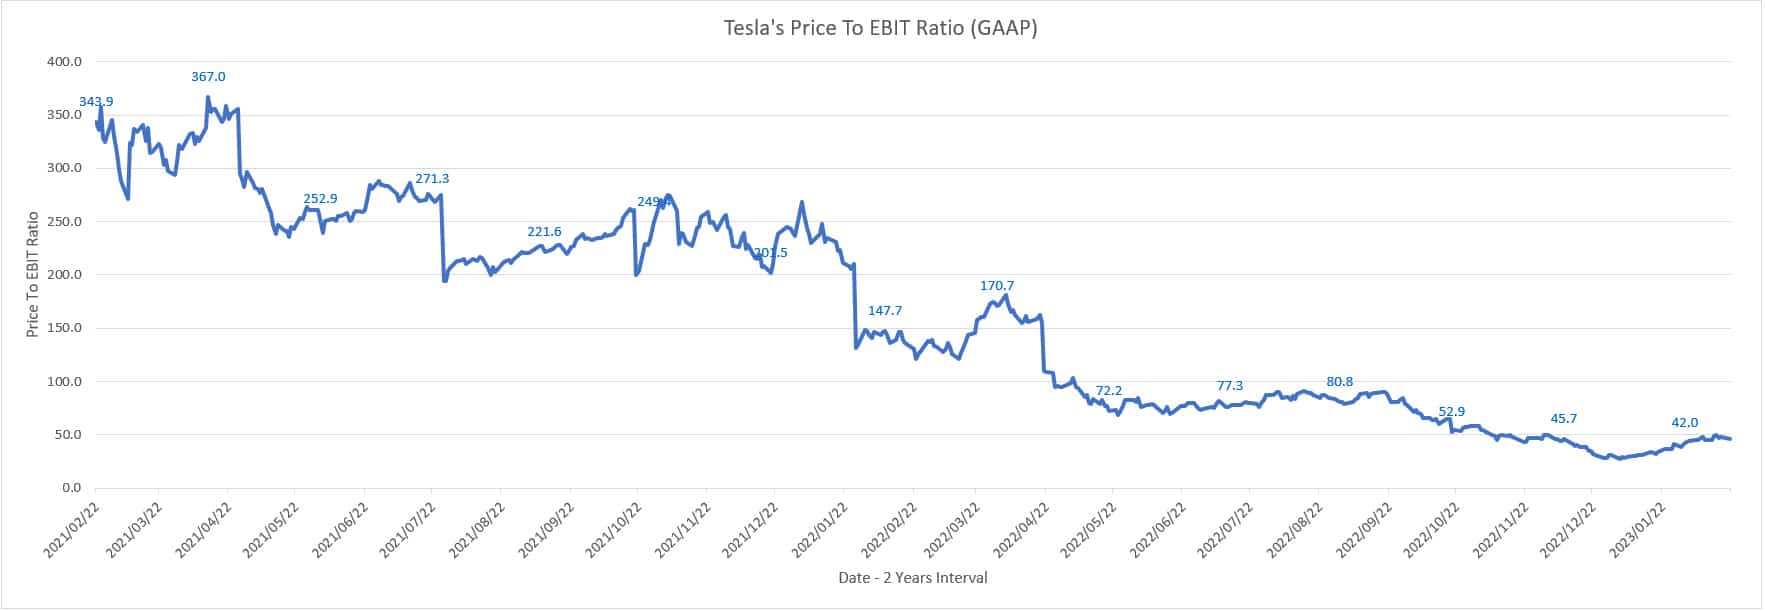
Nevertheless, Tesla’s price to EBIT or operating income ratio soared beyond 300X in 2021 as shown in the chart above.
As of Feb 2023, Tesla’s price-to-operating profit ratio was only at 42.0X, driven partly by the declining stock price and also the improving operating profits in 2022.
Tesla’s Price To EBITDA Ratio
Tesla price to EBITDA ratio
Another important variable that relates closely to Tesla’s valuation is EBITDA.
EBITDA is a metric that measures Tesla’s liquidity and is similar to operating cash flow but before taking into account the investment in working capital and fixed assets as explained in this article: Tesla’s EBITDA.
For your information, the EBITDA used in the chart above comes from Tesla’s adjusted EBITDA published in its earnings releases.
According to the chart above, Tesla’s price-to-EBITDA ratio has had quite a dramatic fluctuation in the past.
For example, the ratio averaged above 100.0X back in 2021.
Nevertheless, Tesla’s valuation with respect to EBITDA slowly declined over the years and reached only 30.0X as of Feb 2023, a record low valuation in the last 2 years.
Tesla’s Price To Operating Cash Flow Ratio
Tesla price to operating cash flow ratio
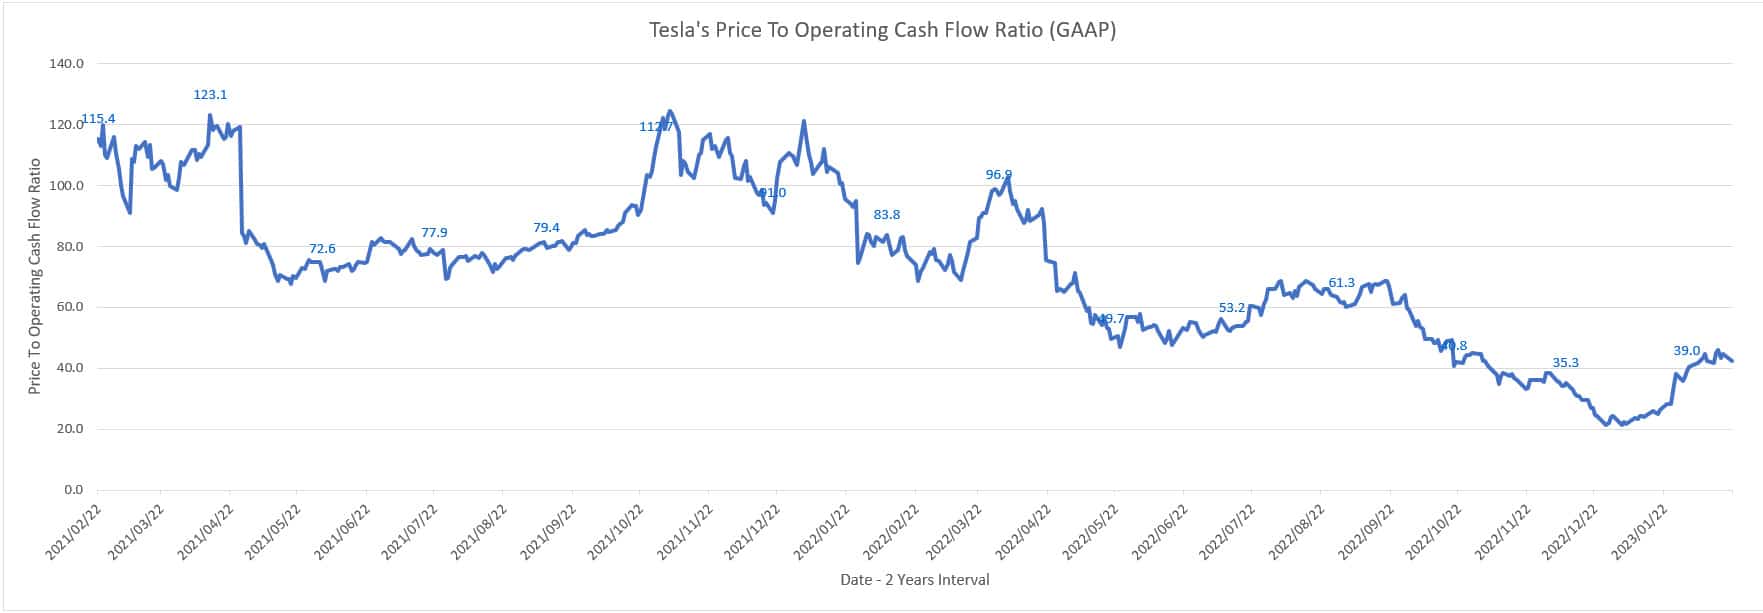
Tesla’s stock valuation with respect to operating cash flow also has been on a decline.
As of Feb 2023, Tesla’s price to operating cash flow ratio totaled only 39.0X, a much lower figure compared to prior results which averaged 70.0X.
Tesla’s Price To Free Cash Flow Ratio
Tesla price to free cash flow ratio
Free cash flow is another important metric that can be used to measure Tesla’s valuation.
As we all know, cash is king when it comes to the survival of a company.
A company can operate without a profit but not without cash.
All it takes is only a quarter of operation with zero cash balance to plunge the company into bankruptcy.
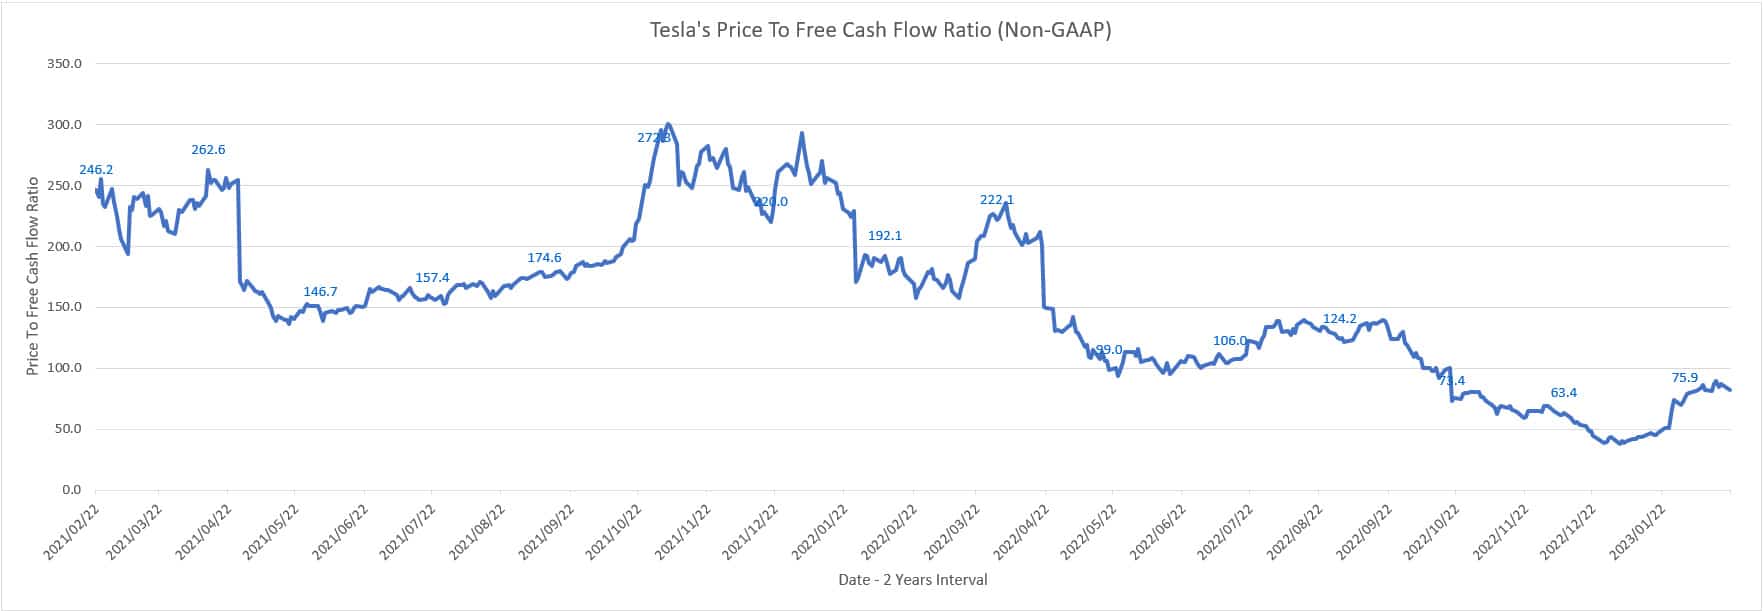
As such, I have created the chart above to track Tesla’s market cap to free cash flow ratio for the period from 2021 to 2023.
Similar to the operating cash flow ratio, Tesla’s stock was traded to about 76.0X of free cash flow as of Feb 2023.
This ratio also has been on a decline and was at record lows as of 2023.
Tesla’s Price To Earnings (PE) Ratio
Tesla PE ratio
One last valuation ratio that is as important as the free cash flow ratio is the price-to-earnings ratio or PE ratio.
The net earnings are the net income or net profit available to common stockholders.
The net earnings dictate the price of Tesla’s stock.
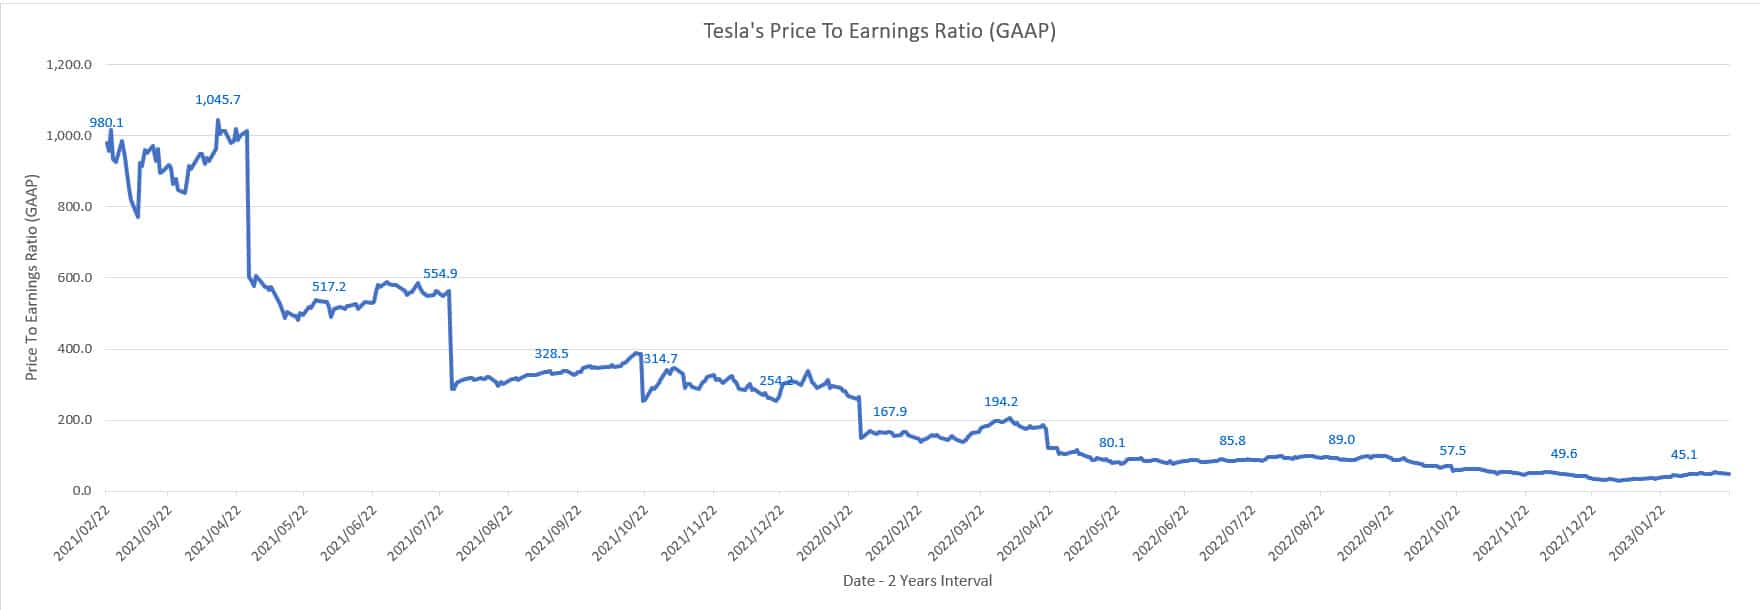
According to the chart above, Tesla’s price-to-earnings or PE ratio has been on a decline in the last 2 years, indicating the tumbling valuation with respect to earnings.
As seen, Tesla’s price-to-earnings ratio debuted at 1,000.0X in 2021 but dropped to only 45.0X by Feb 2023.
Conclusion
To recap, Tesla’s stock valuation has been on a decline with respect to several metrics, including revenue, gross profit, operating profit, and cash flow.
While Tesla’s fundamentals have been on a rise, its valuation has been on a decline.
The contrasting trend may point to a maturing company within Tesla as investors have come to realize that Tesla may have been valued too much in the past.
Notes to Readers
A spreadsheet that presents Tesla’s valuation has been created on the following page.
You can get more valuation metrics, such as a longer interval, and other features such as average valuation, and high and low valuation in a given period, ie. 6-month, 1-year, 2-year, and 5-year.
Apart from the historical valuation, you also get to see the forward valuation and a comparison between the historical and forward valuation ratios.
References and Credits
1. All financial figures in this article were obtained and referenced from the following websites:
a. Tesla Financial Results Released Date
b. Tesla Annual and Quarterly Filings
c. Tesla Key Statistic From Yahoo Finance
2. Featured images in this article are used under creative commons license and sourced from the following websites: Paulius Malinovskis.
Disclosure
The content in this article is for informational purposes only and is neither a recommendation nor a piece of financial advice to purchase a stock.
If you find the information in this article helpful, please consider sharing it on social media and also provide a link back to this article from any website so that more articles like this one can be created in the future.


Thank you for sharing